
In this guide
The UK's housing stock is, by the measure that matters most to a householder, improving but still split in two. Under SAP 2009, which allows comparison over a longer period, 62% of dwellings were rated C or better in 2024, up 38 percentage points since 2010, and the share in the lowest bands E, F or G fell from 27% in 2010 to 8% in 20241. Under the newer SAP 2012 method, 56% of Scottish properties were rated C or better in 2024, with 10% in bands E, F or G2. Homes in England had a median EPC score of 69, which is band C3.
The split is between new and old. In England in the first quarter of 2026, 87% of new dwellings were given an A or B rating, and 67% received a B energy efficiency rating, while 88% of existing dwellings sat at C or D4. In Wales, 92% of new domestic properties received an A rating in the same quarter4. The existing stock is where the work remains, and it is also where the data thins out: around a third of domestic properties in England and Wales do not have an EPC rating at all5.
That gap matters because an EPC is the only standardised, comparable statement of how a home performs. It provides an assessment of a home's energy efficiency, and it is produced using standard information about buildings so that buyers and tenants can compare likely heating and lighting costs before entering a contract6. Where no certificate exists, a household is effectively unmeasured, and so is the national stock.
What the EPC figures actually show
The headline numbers come from two different assessment methods, and the difference between them is not a rounding error. SAP 2009 is retained precisely because it allows a long run comparison: on that basis 62% of dwellings were rated C or better in 2024, a rise of 38 percentage points since 2010, and the proportion in the lowest bands E, F or G fell from 27% in 2010 to 8% in 20241. Under SAP 2012, the method used for the Scottish House Condition Survey, 56% of all properties in 2024 were rated C or better, similar to 2023 but an increase of around 13 percentage points from 2018, and 10% were in bands E, F or G2. The mean energy efficiency rating of the Scottish stock under SAP 2012 was 68.1 SAP points, with a median of 702.
The register itself is a moving picture rather than a fixed census. In the quarter January to March 2026, 460,000 EPCs were lodged in England and Wales, a 2% decrease on the same quarter in 2025, of which 416,000 were domestic EPCs in England, a 1% decrease4. Over the 12 months to March 2026, 1,649,000 domestic EPCs were lodged in England, a 4% increase on the previous 12 months4. In Wales, 90,000 domestic EPCs were lodged over the same 12 months, a 10% increase4.
Those lodgements are heavily weighted towards transactions and new construction, which is why the register is not the same thing as the stock. The register does not hold records for all dwellings in England and Wales, because not every dwelling has an EPC: certificates are only required when a dwelling is constructed, sold or let8. Coverage is estimated at around 60% of housing stock in England and around 55% in Wales, based on Census 2021 analysis by the ONS9. An earlier estimate put EPC coverage in England at around 71% of the housing stock, also based on Census 2021 analysis4. The two figures are not reconciled in the published material, and the difference is large enough to matter when reading any national percentage.
What drives the difference between homes
Three things explain most of the variation in the stock: age, tenure and fuel.
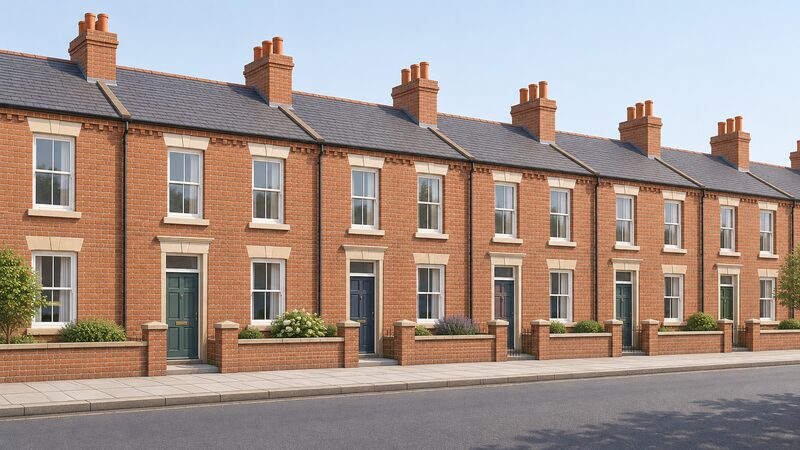
Age is the strongest single factor. In Scotland in 2024, the oldest, pre-1919, properties were the least energy efficient, with a mean EER of 59.3 and 23% rated C or better, while those built after 1982 reached a mean of 74.92. Mean ratings by age band ran from 59.3 for pre-1919, through 66.6 for 1919 to 1944, 67.2 for 1945 to 1964 and 67.3 for 1965 to 1982, to 74.9 for post-19822. Dwellings in the lowest bands F and G are more likely to be older pre-1919 dwellings (9%), non-gas homes, detached (5%), off the gas grid (14%) and in rural areas (10%)2.
Dwelling type follows the same pattern. Detached and semi-detached properties have the lowest average ratings, at mean EER 65.6 and 66.1, against 68.1 for terraced, 71.6 for tenements and 69.6 for other flats2. Household composition shows a smaller but consistent effect: older households average 66.8, families 70 and other households 68.32.
Fuel is the third driver, and it is the one that most directly limits what a household can do. In Scotland, around half of homes use gas and around 8% use oil, and the oil group has fewer options to offset fuel cost increases11. Off-gas-grid homes are also over-represented in the worst bands, at 14%2. A home with no mains gas connection cannot simply switch fuel to improve its rating; the fabric has to carry more of the work.
How the nations differ
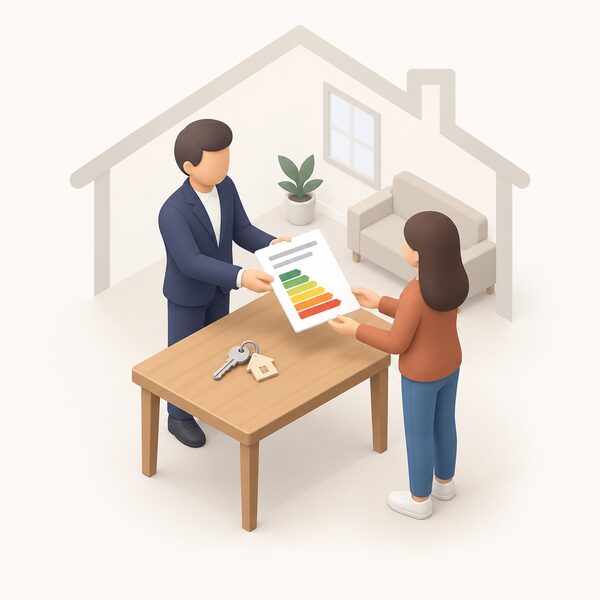
England and Wales share a register and a set of regulations; Scotland and Northern Ireland run their own arrangements, and the published figures are not directly comparable.
In England, the median EPC score was 69, band C, as of March 20253. In the first quarter of 2026, 87% of new dwellings in England were given an A or B rating, an increase from 86% in the same quarter a year earlier, and 67% of new dwellings received a B energy efficiency rating4. Existing dwellings were more likely to be given a C or D rating, at 88%, compared with 12% of new dwellings4. In Wales in the same quarter, 92% of new domestic properties received an energy efficiency rating of A, and 55% of new dwellings were given an A EER; existing dwellings were more likely to receive a C (47%) or D (31%) rating4.
Scotland's stock is measured through the Scottish House Condition Survey. In 2024, 71% of social housing was in band C or better under SAP 2012, higher than both the private rented sector at 50% and the owner-occupied sector at 52%2. Around 2% of dwellings in the social sector are within bands E, F or G, against 12% of owner-occupied dwellings and 14% of the private rented sector2. Social housing as a whole is more energy efficient than the private sector, with a mean EER of 71.8 compared with 66.92. Across Scotland, 2% of properties were in bands F or G in 20242.
In England and Wales, tenure shows the same ordering. Around two-thirds of Council or Housing Association houses have EPC ratings A to C, compared with around 40% of houses in other tenure types5. The pattern is consistent across datasets: the social sector leads, owner occupation and the private rented sector trail, and the gap is widest at the bottom of the scale.
Northern Ireland operates its own EPC regime. District councils are the enforcing authority, and a buyer or new tenant who has not been given a certificate can contact their local district council building control for advice6.
| Measure | England | Wales | Scotland | Northern Ireland |
|---|---|---|---|---|
| Register coverage | around 60% of housing stock9 | around 55% of housing stock9 | Scottish House Condition Survey2 | District councils enforce6 |
| New dwellings A or B, Q1 2026 | 87%4 | 92% A rating4 | not published on this basis | not published on this basis |
| Existing dwellings C or D, Q1 2026 | 88%4 | C 47%, D 31%4 | 56% C or better, SAP 20122 | not published on this basis |
| Social housing C or better | around two-thirds A to C5 | around two-thirds A to C5 | 71%2 | not published on this basis |
The rules that set the targets
The regulatory floor under the stock is rising, and it is rising at different speeds in different parts of the UK.
In England and Wales, it is a legal requirement for all new build domestic dwellings to have an EPC when completed12. For privately rented homes, the government has consulted on raising the minimum standard to EPC band C and is considering the responses13. The 2025 update to that consultation sets out a minimum standard equivalent to EPC C by 203014. Under the Clean Flexibility Roadmap, landlords will be required to ensure their properties meet a minimum score of EPC C against the fabric performance metric and either the heating system or smart readiness metric, from 1 October 203015.
"Landlords will be required to ensure their properties meet a minimum score of EPC C against the fabric performance metri"
For fuel poor homes in England, the target is EPC band C "where reasonably practicable"16. The wider economic case is set out in parliamentary research: upgrading all homes to EPC band C would deliver around £40bn in benefits to the UK economy in the period to 203017.
Scotland is reforming the certificate itself as well as the standard. The reform programme covers new ratings, redesigned certificates and improvements to the operational infrastructure18. A new EPC rating system for domestic buildings will give clearer information on the fabric energy efficiency of a property, the emissions, efficiency and running costs of its heating system, and the cost of energy to run the home to standardised conditions19. The Energy Cost Rating will be based on the cost of energy to run the dwelling to standardised conditions, modelled on UK-wide fuel cost factors and normalised climate data, showing a current and a potential rating20. In Scotland, an EPC is required as part of the Home Report for buildings for sale21.
The Climate Change Committee holds the delivery of these targets to account. It will continue to hold the Government to account for how it delivers against its targets, and its assessment of the Scottish plan will come in its progress report early next year22. Its number one recommendation remains to make electricity cheaper by taking policy costs off electricity bills, which it describes as vital for ensuring the required scale-up of heat pump installations24.
What this means for a household's energy independence
A home's EPC band is a rough proxy for how much of its running cost is fixed by the fabric rather than chosen by the occupant. A dwelling in band F or G is one where the heating system is working against the building; a dwelling in band C or better is generally regarded as having an adequate level of energy efficiency25. That is the threshold the regulations are converging on, and it is the threshold at which a household has real discretion over how it heats and powers the home.
The independence argument runs through the fuel, not just the bill. The Climate Change Committee's position is that the lower-cost, energy-secure future is electric, and that the Government should plan to accelerate electrification, in particular by making electricity cheaper22. It models that emissions must fall by 87% compared to 1990 levels by 2040, and that electrification makes up 60% of emissions reductions by 204026. A household that has upgraded its fabric is in a position to take part in that shift; one that has not is tied to whatever it currently burns.
The dependence that remains is real and worth stating plainly. An EPC is a modelled assessment, not a meter reading: the Energy Cost Rating is based on standardised conditions and UK-wide fuel cost factors, so it will not match a particular household's bills20. The register covers only part of the stock, so a household in the uncovered portion has no benchmark at all8. And the targets themselves are targets: the private rented minimum of EPC C against the fabric performance metric applies from 1 October 2030, and the fuel poverty target for England is qualified by "where reasonably practicable"15.
For a householder, the practical reading is that the direction of travel is set. The stock is improving on every published measure, the regulatory floor for rented homes is moving to band C, and the assessment method itself is being redesigned to say more about fabric and running cost. What varies is the starting point, and that is determined mostly by when the home was built, what it is made of, and what fuel it can reach.
Sources28 cited
- Energy Performance Certificates and the housing stock, Parliamentary Office of Science and Technology, 2024
- Scottish House Condition Survey 2024: Key Findings, Scottish Government, 2026
- Energy efficiency of housing in England and Wales, Office for National Statistics, 2025
- Energy Performance of Buildings Certificates, January to March 2026, GOV.UK, 2026
- National Energy Efficiency Data Framework: need report summary of analysis 2026, GOV.UK, 2026
- Energy Performance Certificates, nidirect, 2026
- Climate change policy, Scottish Government, 2026
- Energy Performance of Buildings Certificates, January to March 2023, GOV.UK, 2023
- Energy Performance of Buildings Certificates, April to June 2025, GOV.UK, 2025
- Energy Performance of Buildings (Scotland) Amendment Regulations 2026: BRIA, Scottish Government, 2026
- Heat in Buildings Strategy: Business and Regulatory Impact Assessment, Scottish Government, 2021
- Energy Performance of Buildings Certificates: change note, GOV.UK, 2025
- GB Insulation Scheme: government response, GOV.UK, 2023
- Improving the energy performance of privately rented homes: 2025 update, GOV.UK, 2025
- Clean Flexibility Roadmap, July 2026 update, GOV.UK, 2026
- Fuel poverty and energy efficiency, House of Commons Library, 2022
- Warm Homes Plan inquiry, House of Commons Environmental Audit Committee, 2025
- Energy Performance of Buildings (Scotland) Regulations 2025 update, Scottish Government, 2025
- Reforming Energy Performance Certificates, Scottish Government, 2025
- EPC reform consultation: government response, Scottish Government, 2025
- Energy Performance Certificates: buildings for sale, Scottish Government, 2026
- Response to the Government's Seventh Carbon Budget target, Climate Change Committee, 2026
- Response to the Scottish Government's climate change plan, Climate Change Committee, 2025
- Response to the Government's Carbon Budget and Growth Delivery Plan, Climate Change Committee, 2025
- Energy efficiency advice and assessment, London Borough of Bromley, 2026
- End the fossil fuel age for a secure and prosperous future, Climate Change Committee, 2025
- Bristol Warm Homes Plan, Bristol City Council, 2025
- Energy Performance Certificates explained, House of Commons Library, 2026
 New Build Energy PerformanceHow energy efficient are new build homes compared with older ones?
 Housing Stock Data for EnglandHow energy efficient are English homes, and how many have insulation or low carbon heating?
 Housing Stock and EPCsHow energy efficient are Scottish homes, and how many reach a good rating?
 Housing Stock and EPCsWelsh homes are among the oldest and least energy efficient in the UK, so what does that mean for yours?
 Housing Stock Data for ScotlandScotland's housing is measured differently from England's, so the numbers you see may not compare directly.
 The Full Where to Start GuideWhich home improvements actually cut your bills, and which should you do first?