In this guide
UK Home Energy Statistics: The Full Guide to Deployment, Prices and Fuel Poverty Data
UK home energy statistics come from several publishers, and no single dataset covers them all. The Department for Energy Security and Net Zero (DESNZ) publishes the national series on energy supply, consumption, prices and fuel poverty. Ofgem publishes the price cap and its regional rates. The Microgeneration Certification Scheme (MCS) database underlies the government's counts of heat pumps and retrofit batteries. Housing is devolved, so England, Scotland, Wales and Northern Ireland each produce their own housing statistics.
The figures people ask for most often are these. Ofgem's price cap put the bill for an average dual fuel household paying by Direct Debit at £1,755 a year for October to December 20251. That figure assumes typical consumption of 2,500 kWh of electricity and 9,500 kWh of gas2. A Parliamentary briefing records 1,366,599 domestic solar installations in owner-occupied UK homes as of April 20263. In 2024, 16.0% of domestic properties in Great Britain had no gas grid connection4. DESNZ counts 2.36 million fuel poor households in England for 2025 on provisional figures, and projects 2.13 million for 20265. Heating and powering buildings accounts for 30% of the UK's total energy use6.
For household energy independence, these numbers show progress and also its limits. Each certified solar array, battery or heat pump reduces a home's exposure to wholesale gas and to the quarterly cap. The great majority of homes still buy all their energy from a supplier at rates a regulator sets four times a year. Around one home in six sits outside the gas grid and uses fuels that the cap does not cover.
What the UK's home energy statistics cover, and who publishes them
Home energy statistics fall into five groups:
- Deployment: how many homes have a given technology.
- Prices and bills.
- Consumption.
- The condition of the housing stock.
- Fuel poverty.
Each group has its own publisher, release cycle and geographic coverage. Coverage is the point readers most often get wrong. The Office for National Statistics notes that "housing is a devolved area of policy, each UK country is in charge of the housing statistics that they produce". A figure labelled "UK" may therefore have been assembled from four differently designed surveys7.
The backbone is the DESNZ national series. The Digest of United Kingdom Energy Statistics is the department's annual energy publication. It gives a detailed picture of the production and consumption of individual fuels, and of energy as a whole, over the previous three years8. Monthly statistics cover UK production and consumption of coal, electricity, gas, oil and total energy. Each release runs to a stated month: the August 2017 release, for example, covered the period to the end of June 20179. Older compilations carry their own limits. The Housing Energy Fact File, which gathered the main data on energy use in homes, covered Great Britain and not the UK10.
Scheme statistics are narrower again. The Household Energy Efficiency release, which tracks Energy Company Obligation measures, is a National Statistics publication. It was last fully assessed against the Code of Practice for Statistics on 12 June 2014, and it is issued as monthly headline releases alongside detailed ones11. The Green Homes Grant Local Authority Delivery and Home Upgrade Grant release covers England only12.
Consumer protection reviews follow the same devolved pattern. The Each Home Counts review was commissioned by the UK Government in October 2015 and chaired by Dr Peter Bonfield13. The Welsh Government describes it as an English exercise covering consumer advice, protection, standards and enforcement for home energy efficiency and renewable energy measures14.
Headline shares depend on what is counted, so they differ between documents. Ofgem's Domestic Renewable Heat Incentive annual report says heating homes accounts for 15% of the UK's total greenhouse gas emissions15. The government's response to the Future Homes Standard consultation gives 22% for heating and powering homes in 201816. Both figures are official. They measure different things.
| Series | Publisher | Coverage | Status or frequency |
|---|---|---|---|
| Digest of United Kingdom Energy Statistics | DESNZ (formerly BEIS) | UK | Annual8 |
| Monthly energy statistics | DESNZ | UK | Monthly9 |
| Household Energy Efficiency statistics | DESNZ | Scheme-based | National Statistics, headline and detailed releases11 |
| LAD and HUG release | DESNZ | England | Official statistics12 |
| Housing Energy Fact File | UK government | Great Britain | Historic compilation10 |
A fuller directory of bodies is on the page who publishes UK home energy data. The release calendar is set out under official UK energy statistics publications.
Renewable deployment: the MCS data on certified installations
Most household-scale deployment counts in the UK rest on one administrative record, the MCS Installation Database. Ofgem describes MCS as "an independent certification scheme for microgeneration installation companies and products". Under the Boiler Upgrade Scheme, MCS has several roles17:
- setting and maintaining technical standards;
- certifying installers and products against those standards;
- issuing certificates for completed eligible installations;
- helping certification bodies deal with consumer issues.
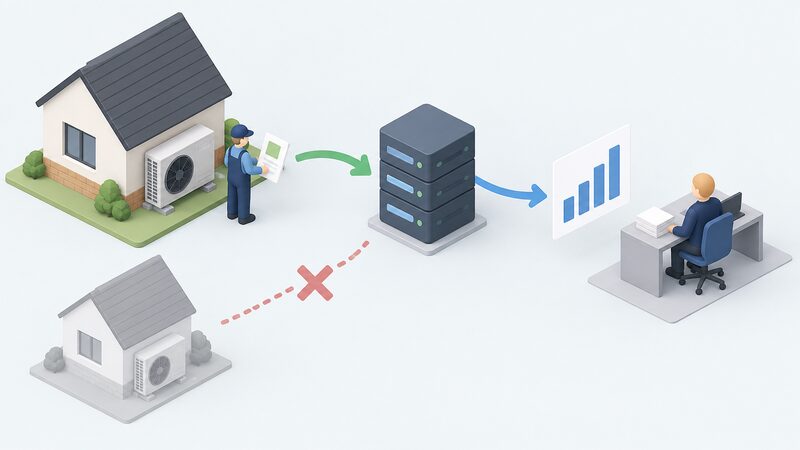
When an installer registers a job, a line is added to the database, and DESNZ uses that database for its quarterly heat pump deployment statistics for the United Kingdom18.
The counts are therefore precise about what they include and leave out the rest. The heat pump series excludes all installations in new dwellings. It also excludes retrofit installations that are not MCS certified, which DESNZ describes as "thought to be small in number"19. A home built with a heat pump does not appear in the series. A heat pump fitted outside the certification route does not appear either.
The battery series follows the same approach. It covers MCS certified retrofitting of electric batteries into domestic properties in the United Kingdom, and DESNZ reports that these installations have been increasing20. The series was first published on 29 May 2025 and is labelled "official statistics in development", because it is new and still being refined21.
"MCS requires installers to provide a design-stage prediction of system efficiency, not verify actual performance."
That sentence limits what the statistics can show. An MCS certificate records that a system was installed to a standard. It does not record how well the system works in use. The same review makes three further observations22:
- MCS does not require remediation of systems that underperform relative to their design.
- Weather compensation is not mandatory under current MCS requirements.
- MCS specifies handover documentation, but not the quality of explanation or follow-up support.
The deployment counts therefore measure how many systems exist. They say nothing about how those systems perform. The page on measured versus modelled home energy performance takes up that gap.
For householders, MCS is the body to contact about problems with the installation process, the installer, or the certificate or product23. Ofgem's guidance for property owners gives the telephone number 0333 103 813024. After a Boiler Upgrade Scheme installation, MCS may carry out a short routine verification on Ofgem's behalf by email or by phone on 0333 103 819824. Installer guidance says owners contacted for additional checks should aim to respond within seven days25.
The detailed series are covered under MCS installation statistics, with a local breakdown in MCS data by local authority and an explanation of what the MCS Data Dashboard shows.
How many homes have solar, heat pumps and storage
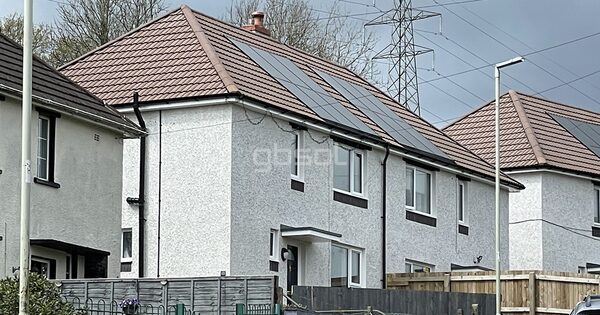
The firmest single count available is for solar. A Parliamentary Office of Science and Technology briefing records 1,366,599 domestic solar installations in owner-occupied homes across the UK as of April 2026. Its table breaks installations down by tenure3. A second official figure of 697,538 for UK domestic solar installations also appears in 2026 material. A reader who meets either number needs to check what it counts: which tenures, which certification routes, and whether the unit is installations or homes.
This page does not quote one combined total of "registered installations" across solar, heat pumps and batteries. No such total could be verified against an official release. The available series are separate and have different scopes:
- Heat pumps: quarterly UK deployment statistics, MCS certified retrofits only, new dwellings excluded19.
- Batteries: MCS certified domestic retrofit installations, UK, official statistics in development, rising trend20.
- Solar: tenure-based counts in Parliamentary briefings, plus the national renewables tables in Energy Trends3.
Adding these series together would double count homes that have more than one technology. It would still miss new-build systems.
For independence, the more useful question is what share of homes each count represents, and the series above do not answer that directly. One reference point is England's fuel poverty projection, where 2.13 million households make up 8.4% of all households5. Against that, 1,366,599 owner-occupied solar installations across the whole UK is a minority of the housing stock. Most households still draw every kilowatt hour from the grid.
The individual technologies have their own pages: UK solar PV deployment statistics, UK heat pump installation statistics and home battery storage installation statistics. Nation-level counts are on the pages for heat pumps in England, Scotland, Wales and Northern Ireland.
The Ofgem price cap: what a typical household pays
The price cap is quoted more often than any other figure in British home energy, and it is also widely misread. It limits the unit rates and standing charges a supplier can charge on a default tariff. The headline pound figure is only an illustration, showing what those rates cost a household with typical consumption. Ofgem announced on 27 August 2025 that for an average household paying by Direct Debit for gas and electricity "the overall bill will be £1,755 per year" for October to December 20251. Ofgem said the rise reflected increases to parts of the cost of transporting energy in Great Britain, along with costs towards government schemes and essential support26.
The cap's history shows how exposed households on default tariffs were to wholesale gas prices. The figures below are for a typical medium household paying by Direct Debit, as compiled by an independent comparison service27. The Scottish Government's social tariff working group separately confirms the January to March 2025 level of £1,73828.
| Cap period | Level | Change on previous period |
|---|---|---|
| Winter 2018/19 | £1,053 | First period listed |
| Winter 2021/22 | £1,216 | +£132 |
| Summer 2022 | £1,877 | +£661 (54%) |
| October to December 2022 | £3,371 | +£1,494 (80%) |
| January to March 2024 | £1,928 | +£94 (5%) |
| January to March 2025 | £1,738 | +£21 (1%) |
The same source records that government support was extended because the cap was predicted to reach £3,280 for typical households in April 202327. The winter 2018/19 level was £1,053 and the October to December 2022 level was £3,371, a difference of £2,318. A household with no generation or storage of its own could not avoid any of that increase.
The cap was first set by season. It is now reset quarterly. The Commons Library says Ofgem "revises the cap each quarter"29. The Welsh Government says it is updated every three months30. The Lords Library adds that the review is "based on the cost of wholesale energy"31. Published commentary on cap levels beyond 2025 conflicts with itself, and competing forecasts remain unreconciled, so this page quotes only levels Ofgem has announced.
The cap applies in Great Britain, that is England, Scotland and Wales26. Northern Ireland has a separate energy market and is outside it. Longer price histories are on the page UK domestic energy prices over time.
Unit rates and standing charges: the numbers behind the bill
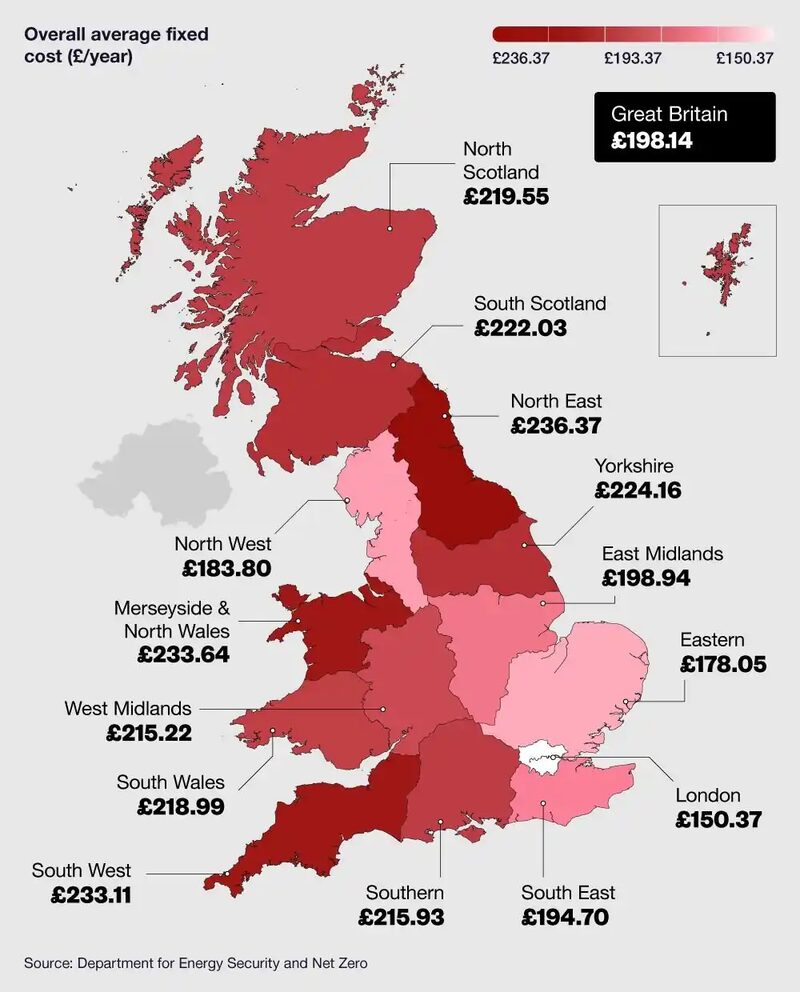
The headline cap rests on a set of regional tables. For 1 July to 30 September 2026, Ofgem's benchmark maximum charges for electricity give an annual standing charge and an annual bill for each region. They are set at 2,500 kWh for single-rate meters and 3,400 kWh for multi-rate meters32.
| Region | Standing charge, single-rate | Annual bill at 2,500 kWh | Standing charge, multi-rate | Annual bill at 3,400 kWh |
|---|---|---|---|---|
| Midlands | £207.57 | £810.72 | £206.15 | £977.09 |
| Northern | £223.48 | £824.03 | £220.70 | £986.44 |
| South East | £189.27 | £824.22 | £190.23 | £996.63 |
| Yorkshire | £223.79 | £826.29 | £221.43 | £992.07 |
| Southern | £172.77 | £801.74 | £172.65 | £973.28 |
| Southern Western | £201.24 | £829.48 | £202.58 | £1,000.86 |
In these regions the fixed element of an electricity bill ranges from £172.77 to £223.79 a year before any energy is used32. For energy independence this is the key fact in the table. A home with solar panels and a battery can reduce its metered consumption a great deal. For as long as it stays connected, it still pays the full standing charge, because the charge pays for the connection itself.
The consumption basis differs between documents, so bill figures from different periods are hard to compare. Ofgem's default tariff cap tables for April to June 2024 gave a London figure of £1,110.43 for a multi-register electricity meter at 4,200 kWh a year33. That is a different benchmark from the 3,400 kWh used in 2026.
For a longer view, the government's Quarterly Energy Prices series gives average unit costs with standing charges folded in. For 2014 it put the average UK domestic standard electricity price at 15.57 pence per kWh across all payment types, including VAT and standing charges. Prepayment customers paid 16.38 pence per kWh, and average gas in Great Britain was 5.02 pence per kWh. Real-terms electricity bills that year, at 2010 prices, ranged from £572 to £636 depending on payment type34. The 2012 edition recorded a 2011 average standard electricity bill of £523 for customers paying by credit35.
Insulation affects the bill as well as price. The Climate Change Committee estimated in June 2022 that the average annual UK household energy bill was "around £40 higher than if insulation rates from pre-2012 had continued for the last decade"36.
Regional variation: why your postcode changes your rates
In the table above, a Yorkshire household's single-rate standing charge is £223.79 and a Southern household's is £172.77. That is a difference of £51.02 a year for the same service32. The ranking changes once usage is included. Southern has the lowest annual single-rate bill at £801.74 and Southern Western the highest at £829.48. The South East has the second lowest standing charge of the six regions, yet its bill is among the higher ones. The split between fixed and unit costs therefore varies by region. A low-use household and a high-use household gain from different parts of that split.
Transport costs drive the variation. When Ofgem explained the cap change for October to December 2025, it pointed to "increases to parts of the costs of transporting energy in Great Britain (England, Scotland and Wales)"26. Network costs are recovered region by region. The cap is therefore a set of regional caps that share one headline average.
This is why Ofgem's switching guidance starts with the postcode. It lists five things a household needs in order to compare tariffs37:
- the postcode;
- the name of the current supplier;
- the name of the current tariff;
- the amount paid per unit in kWh;
- the amount of energy used each year.
Ofgem also notes that a bill "can also vary based on how your home or business is heated, for example if you use heating oil or your property is on a heat network"38. Postcode decides the rate, heating system decides the fuel, and the two together decide the bill. Sub-national consumption figures are on the page regional and local authority energy consumption statistics.
Off-gas homes: heating oil, LPG and the homes outside the cap
The cap covers mains gas and electricity. It does not cover the delivered fuels that heat a large minority of homes. The House of Commons Library puts the number at four million UK households, 15%, off the mains gas grid. These households heat with heating oil, liquefied petroleum gas (LPG), solid fuels, mains electricity and microgeneration39. A separate Library briefing, using 2024 data for Great Britain alone, puts the share at 16.0% of domestic properties4. The two figures differ in geography and in unit. One counts households and the other counts properties, so they do not contradict each other.
The share varies widely by area4:
| Area | Domestic properties off the gas grid, 2024 |
|---|---|
| Great Britain | 16.0% |
| Scotland | 19.5% |
| Outer London | 14.9% |
| West Midlands | 13.4% |
| East Midlands | 11.9% |
| Hartlepool | 2.1% |
Scotland's 19.5% reflects its rural and island housing. The Outer London figure of 14.9% shows that being off-gas is not only a rural condition, because flats with electric heating count as off the gas grid too. The Scottish position is covered under how many Scottish homes are off the gas grid.
Off-gas households are an instructive case for independence. They do not depend on the gas network. Instead they depend on tanker deliveries, global oil prices and a market with no price cap. They are also more likely to be in fuel poverty. In England in 2025, 16.2% of households heating with oil and 16.9% of those heating with electricity were fuel poor. The average fuel poverty gap for electrically heated homes was £730. About 35% of homes using other heating fuels reached energy efficiency bands A to C4. Price series for these fuels are on the page heating oil and LPG price data. Spending is covered under average heating oil spending.
Fuel poverty and prepayment customers
Each nation defines fuel poverty in its own way, so headline totals cannot be added together across the UK. The main official series for England comes from DESNZ. The department's annual report gives 2.36 million fuel poor households (9.4%) for 2025 on provisional figures, and projects 2.13 million (8.4%) for 2026. On those figures both the count and the share are projected to fall between the two years5. The ONS local indicator for fuel poverty uses the same DESNZ source, and its region-level numbers come from the national fuel poverty statistics for 202440.
Other measures give much larger numbers. National Energy Action estimates that more than six million UK households are in fuel poverty, as quoted by the smart meter data company DCC in 202541. The Energy Security and Net Zero Committee reports that 36.4% of households in England, 8.91 million, spent more than 10% of their income after housing costs on domestic energy in 2023. That was up from 20.5% (4.93 million) in 202142. The 10% measure responds directly to price changes. England's official measure also depends on a home's energy efficiency rating. This explains why one country in one year can be described by figures of 2.36 million and 8.91 million.
Prepayment is a marker of vulnerability that is closely related to fuel poverty. Ofgem's 2024 consumer archetypes put the Great Britain average at 12% of households on prepayment for electricity. In one archetype, labelled E13, 36% prepay for electricity and 37% for gas43. Devolved governments have funded emergency support for households that pay for fuel in advance. In December 2024 the Welsh Government announced an extra £700,000 for the Fuel Bank Foundation, to help people who prepay for their fuel and are at risk of disconnection44.
The methods are explained on the page fuel poverty statistics. Local figures are under local fuel poverty statistics. The household segmentation is covered under Ofgem consumer archetypes, and the prepayment evidence is on the page self-disconnection and prepayment meter data.
EV charging statistics: official tables and the Zapmap picture
An electric car is often the largest new electrical load a household takes on, so charging data belongs alongside home energy statistics. The official series is the Department for Transport's Electric Vehicle Charging Infrastructure statistics (EVCI). Its main table, EVCI0101, reports public EV chargers by country and region for the United Kingdom, and the latest edition gives the position at 1 July 2026. Monthly tables of public chargers by country and region are published separately. They sit on the department's page for developing faster indicators of transport activity45.
Zapmap is a commercial charge point mapping service that publishes running counts of public chargers and of electric cars on UK roads. The press quotes its figures widely. Its data is an industry tracker and not an official statistic, and its figures are not reproduced here. The DfT tables are the series with a published methodology and a fixed reference date.
Both sources count public devices. Neither counts home chargers. For most households with a driveway, the home charger is where the energy is actually bought, at domestic rates under the tariff rules described above. The EVCI tables therefore say something about dependence on public infrastructure and little about home charging itself. More detail is under electric vehicle charging device statistics, UK electric vehicle registration statistics and public EV charging price data.
How home energy use fits the UK total: about 30%

A Parliamentary Office of Science and Technology briefing from January 2025 states that "heating and powering buildings accounts for 30% of the UK's total energy usage"6. That figure covers all buildings, not only homes. It is the best supported share available, and higher figures sometimes quoted could not be verified against an official release.
Shares of emissions are quoted more often than shares of energy, and they vary with what is counted:
| Measure | Share | Scope | Source date |
|---|---|---|---|
| UK total energy use | 30% | Heating and powering buildings | 20256 |
| UK greenhouse gas emissions | 22% | Heating and powering homes, 2018 | 202116 |
| UK carbon emissions | 22% | Home energy consumption | Local authority guidance46 |
| UK greenhouse gas emissions | 15% | Heating homes only | 202415 |
The 22% figure for heating and powering homes and the 15% figure for heating alone differ by seven percentage points. The 22% figure includes electricity use in the home, and the 15% figure does not.
The authoritative consumption series is Energy Consumption in the UK, published by DESNZ as accredited official statistics47. UK Energy in Brief 2026 has the same accredited status and summarises the national picture each year48. Household averages are covered on the page average household gas and electricity consumption statistics.
Households themselves are less sure of their own use than they were. Ofgem's consumer survey ran from 19 August to 17 September 2021. It found that around three quarters (75%) of energy consumers in Great Britain said they understood how much energy they use at home, down from 79% in 202049.
Where the data comes from: DESNZ, Energy Trends, Energy Saving Trust and MCS
DESNZ produces most of the primary data. Several other bodies publish data too. The Energy Saving Trust issues its own analyses and explains its data methods. MCS holds the installation record described above. Ofgem publishes regulatory data. The ONS republishes departmental figures as local indicators.
The main DESNZ and related series are these:
- Energy Trends, renewables section: the running national record of renewable capacity and generation, last updated on 10 September 2026, when the Renewables Obligation Certificate tables were revised50.
- Energy Performance of Building Certificates statistics: quarterly releases for England and Wales, based on certificates for buildings constructed, sold or let since 2008. Recent editions are built from EPCs for domestic buildings only. Earlier ones also covered non-domestic certificates and Display Energy Certificates51.
- Energy efficiency characteristics of new dwellings: drawn from EPCs lodged on the Energy Performance of Buildings Register, and published as official statistics in development54.
- DESNZ Public Attitudes Tracker: a survey of public awareness, attitudes and behaviours relating to the department's policies, such as energy and climate change55.
- Local authority and regional greenhouse gas emissions, 2005 to 2024: built mainly from the UK National Atmospheric Emissions Inventory and DESNZ's sub-national energy consumption statistics56.
- Scheme releases: statistics on low carbon heating schemes remain available through their individual releases57. DESNZ also collected the payment data for the Energy Bills Support Scheme in Great Britain58.
The ONS local indicator for domestic electricity consumption shows how coverage is handled. It cites DESNZ data for Great Britain and a separate DESNZ source for Northern Ireland59.
Status labels help a reader judge how much weight a series will bear. "Accredited official statistics" have been assessed against the Code of Practice. "Official statistics in development" are new, and their methods may change. Administrative counts such as the MCS database are complete for what they record and leave out everything else. These distinctions are explained on the page how to read UK energy statistics. Related pages cover EPC statistics, public attitudes tracking data, Boiler Upgrade Scheme statistics and ECO and household energy efficiency statistics. The market data hub lists every page in this section.

What's changing: the SAP replacement and the Warm Homes Plan target
Two changes will affect the statistics over the next few years. One alters how home energy performance is measured. The other sets the target against which deployment will be judged.
The first is the replacement of the Standard Assessment Procedure (SAP), the calculation behind every EPC. The Commons Library records that the UK Government has proposed replacing SAP with a new methodology, the Home Energy Model (HEM), for England and Wales60. Scotland's Climate Change Plan says HEM will replace the current SAP methodology in autumn 202661. Scottish Government stock modelling research likewise describes SAP as due to be superseded by HEM in 2026 as the energy calculation model for EPCs62. SAP itself is still being revised in the meantime. A notice of approval dated 24 March 2026 updated the methodology for new dwellings in England from version 10.2 to version 10.363.
The second change is the Warm Homes Plan. A Parliamentary briefing describes the £15 billion plan as the main source of funding for home energy upgrades3. DESNZ's statistical releases describe its aim as to "upgrade up to 5 million homes by 2030"64, and the department's annual report repeats the target of 5 million homes5. The Climate Change Committee's monitoring framework notes that the plan expands rooftop solar and home battery storage, which places the plan within energy system resilience as well as bill reduction65.
Progress is already being reported scheme by scheme. The Warm Homes: Social Housing Fund release for August 2026, for example, monitors measures installed in domestic properties in England66. The MCS battery and heat pump series described earlier are the clearest measure of households acting for themselves, outside grant schemes. The modelling assumptions are explained on the page SAP, RdSAP and the assumptions behind home energy ratings. The wider picture is drawn together on the page what the data says about household energy independence.
Sources66 cited
- Energy price cap will rise 2 percent in October, Ofgem, 27 August 2025
- Research briefing CBP-9714 on the energy price cap, House of Commons Library, 28 August 2026
- POSTnote 771, Parliamentary Office of Science and Technology, 2026
- Research briefing CBP-9838: households off the gas grid and fuel poverty, House of Commons Library, 2025
- DESNZ annual report and accounts 2025 to 2026: performance report, Department for Energy Security and Net Zero, 2026
- POSTnote 736, Parliamentary Office of Science and Technology, 6 January 2025
- How energy efficiency data can help reduce our carbon footprint, Office for National Statistics, 23 September 2020
- Digest of UK Energy Statistics, GOV.UK, 27 July 2017
- Energy trends and prices statistical release, 31 August 2017, GOV.UK, 2017
- Housing Energy Fact File 2012: energy use in homes, GOV.UK, 19 December 2012
- Household Energy Efficiency detailed release, March 2023, GOV.UK, 30 March 2023
- Green Homes Grant LAD and Home Upgrade Grant release, February 2025, GOV.UK, 27 February 2025
- Energy Efficient Scotland route map, Scottish Government
- Written statement: cavity wall insulation in Wales, Welsh Government, 13 June 2017
- Domestic Renewable Heat Incentive annual report 2023 to 2024, Ofgem, July 2024
- Government response to the Future Homes Standard consultation, UK Parliament deposited papers, 2021
- Boiler Upgrade Scheme, Ofgem
- Heat pump deployment quarterly statistics, United Kingdom, 2026 Q1, GOV.UK, 11 June 2026
- Heat pump deployment tables, Q2 2026, GOV.UK, 10 September 2026
- MCS domestic retrofit battery installations 2025 to 2026, GOV.UK, 28 May 2026
- MCS certified domestic battery installation statistics, GOV.UK, 29 May 2025
- Report on the heat pump transition, GOV.UK, May 2026
- Domestic RHI: who to contact, Ofgem
- Boiler Upgrade Scheme guidance for property owners, version 5, Ofgem, 25 March 2026
- Boiler Upgrade Scheme guidance for installers, version 5, Ofgem, 28 April 2026
- Changes to the energy price cap between 1 October and 31 December 2025, Ofgem, 27 August 2025
- The history of Ofgem's energy price cap, Energyhelpline
- Social tariff working group final report, spring 2025, Scottish Government, 2025
- Research briefing CBP-10958, House of Commons Library
- Energy price cap explained, Welsh Government, 4 March 2026
- Electricity prices in Great Britain, House of Lords Library, June 2026
- Energy price cap levels, 1 July to 30 September 2026, Ofgem, 2026
- Default tariff cap level, 1 April 2024 to 30 June 2024, Ofgem, 2024
- Quarterly Energy Prices, December 2014, UK Parliament deposited papers, 2014
- Quarterly Energy Prices, March 2012, UK Parliament deposited papers, 2012
- Current programmes will not deliver Net Zero, Climate Change Committee, 29 June 2022
- Switch your home energy supplier, Ofgem, 2026
- Understand your electricity and gas bills, Ofgem, 2026
- Research briefing SN05806: households off the gas grid, House of Commons Library
- Fuel poverty indicator, Explore local statistics, Office for National Statistics
- Helping to tackle fuel poverty through smart data, Smart DCC, 2025
- Energy Security and Net Zero Committee report, UK Parliament
- Ofgem consumer archetypes update 2024, final report, Ofgem, February 2024
- Safe, warm and connected: community hubs helping communities this winter, Welsh Government, 19 December 2024
- Electric vehicle charging infrastructure statistics: data tables (EVCI), GOV.UK, 2026
- Home and business grants, schemes and advice, East Herts District Council
- Energy Consumption in the UK (ECUK) 2025, GOV.UK, 20 April 2026
- UK energy in brief 2026, GOV.UK, 30 July 2026
- Consumer Survey 2021: decarbonisation and home energy use, Ofgem, 2021
- Energy Trends: UK renewables, GOV.UK, 10 September 2026
- Energy Performance of Building Certificates in England and Wales: April to June 2025, GOV.UK, 31 July 2025
- Energy Performance of Building Certificates in England and Wales: July to September 2025, GOV.UK, 30 October 2025
- Energy Performance of Building Certificates in England and Wales: April to June 2023, GOV.UK, 27 July 2023
- Energy efficiency characteristics of new dwellings, GOV.UK, 4 February 2026
- DESNZ Public Attitudes Tracker: winter 2025, GOV.UK, 12 March 2026
- UK local authority and regional greenhouse gas emissions statistics, 2005 to 2024, GOV.UK, 25 June 2026
- Heat pump deployment statistics: December 2025, GOV.UK, 12 March 2026
- Energy Bills Support Scheme: payments made by electricity suppliers to customers, GOV.UK, 20 October 2022
- Domestic electricity consumption indicator, Explore local statistics, Office for National Statistics, 18 December 2025
- Research briefing CBP-8830, House of Commons Library
- Scotland's Climate Change Plan 2026 to 2040, Scottish Government, 6 November 2025
- Energy Performance of Buildings (Scotland) Regulations 2025: stock model research, Scottish Government, 2026
- Notice of approval of the methodologies for the energy performance of new buildings, 24 March 2026, GOV.UK, 24 March 2026
- Warm Homes: Local Grant statistics, August 2026, GOV.UK, August 2026
- Monitoring framework: well-adapted energy system, Climate Change Committee
- Warm Homes: Social Housing Fund statistics, August 2026, GOV.UK, 27 August 2026