

In this guide
The DESNZ Public Attitudes Tracker is the UK government's long-running measure of what households think about energy and climate policy. It began in March 2012, ran quarterly for more than a decade, and moved to a triannual design from Spring 2024, with waves every spring, summer and winter1. It is a nationally representative survey of adults aged 16 and over in the UK, and it tracks awareness, attitudes and behaviours relating to the policies of the Department for Energy Security and Net Zero, such as energy and climate change2.
The most recent waves give the shape of the series. The Summer 2025 wave ran from 8 July to 13 August 2025 and was the 14th wave since the Autumn 2021 methodology change3. The Winter 2025 wave ran from 4 November to 9 December 2025 and recorded 3,279 respondents4. The Spring 2026 wave was published on 2 July 20262.
The tracker is not the only source of this kind. Ofgem runs an Energy Consumer Satisfaction Survey with a much larger sample, and Nesta has built an eight-segment picture of British attitudes to heat pumps. Read together, they show a public that is broadly satisfied with its suppliers, worried about bills, and increasingly positive about renewable technology, with cost the dominant concern.
What the Public Attitudes Tracker is and how it works
The tracker is an official statistics series, not a one-off poll. Its stated purpose is to track public awareness, attitudes and behaviours relating to the policies of the Department for Energy Security and Net Zero, such as energy and climate change4. It is a nationally representative triannual survey of adults aged 16 and over in the UK2. The department commissions Verian, formerly Kantar Public, an independent research organisation, to conduct it1.
The series has a long history and more than one name. It began in March 2012 and ran on a quarterly basis1. It was later rebranded as BEIS's Energy and Climate Change Public Attitudes Tracker, a change recorded in the Wave 21 material published on 4 May 20179. That wave's documentation set the pattern the series still follows: a summary of key findings, a questionnaire, summary tables and a technical note giving full details of the methodology9. The current technical report covers the Winter 2024, Spring 2025 and Summer 2025 waves1.
A new methodology was adopted from Autumn 2021 onwards, which is why the wave numbering restarts there1. The Summer 2025 wave is the 14th wave in the series that began in Autumn 20213. The move to three waves a year followed a consultation with users over Summer 20231.
For a household trying to read the energy transition, the tracker's value is that it is consistent and repeated. It asks the same questions across waves, so movement between them is meaningful rather than an artefact of a single poll. It is also a measure of the public's side of energy policy: not how many heat pumps were installed, but how many people would consider one, and what puts them off. That makes it a companion to the installation data rather than a substitute for it.
Survey method and sample: how the tracker and Ofgem's survey are built

The tracker's sample is large enough to support national figures but not local ones. The Winter 2025 wave recorded 3,279 respondents4. The Summer 2025 wave ran from 8 July to 13 August 20253. The Winter 2025 fieldwork ran from 4 November to 9 December 20254. The Spring 2026 wave was published on 2 July 20262.
Ofgem's Energy Consumer Satisfaction Survey is a different instrument with a different scale. The July and August 2025 wave was based on 3,790 interviews with a representative sample of energy bill payers across Great Britain, carrying a maximum confidence interval of plus or minus 1.59 per cent5. Of those, 3,068 consumers took part via online interview panels to capture the digitally enabled population, and 220 digitally excluded consumers were interviewed face to face5. The survey uses a quota-based approach to sampling and a mixed mode method of data collection, largely online with face-to-face interviewing targeted at digitally excluded respondents10.
Earlier waves show the same design. The January 2025 wave surveyed 3,854 domestic energy bill payers across Great Britain using mixed mode data collection including face-to-face interviewing with digitally excluded respondents11. The August and September 2023 wave comprised 3,311 consumers via online interview panels, 210 through river sampling, 221 face to face, and 310 prepayment and standard credit boost respondents12. Wave 19, in July 2024, carried out fieldwork from 10 July to 1 August13.
The distinction matters when reading any single figure. The tracker is a UK-wide official series with a sample in the low thousands. Ofgem's survey is Great Britain only, larger, and weighted towards bill payers rather than adults generally. Neither is a census, and neither supports statements about a single town or a single supplier's customers without further data.
| Survey | Body | Coverage | Sample | Period |
|---|---|---|---|---|
| Public Attitudes Tracker | DESNZ | UK adults aged 16+ | 3,279 (Winter 2025)4 | 4 November to 9 December 20254 |
| Energy Consumer Satisfaction Survey | Ofgem | GB energy bill payers | 3,790 interviews5 | July and August 20255 |
| Energy Consumer Satisfaction Survey | Ofgem | GB energy bill payers | 3,85411 | January 202511 |
| Energy Consumer Satisfaction Survey | Ofgem | GB energy bill payers | 3,311 online panel plus boosts12 | August and September 202312 |
What households worry about: paying bills and switching supplier
Bill affordability is the recurring theme across the trackers. Ofgem stated in September 2022 that millions of domestic consumers would struggle with their energy bills that winter and beyond14. Consumer Scotland's Energy Tracker, published on 19 December 2022, found that 69 per cent of Scottish consumers were finding it more difficult than last year to keep up with their energy bills7. The same tracker found 52 per cent of all consumers agreed that their energy bills provide guidance on what to do if they are worried about paying7.
Satisfaction with suppliers has held up better than bill worry might suggest. Ofgem's Consumer Perceptions of the Energy Market for Q2 2021 found around three quarters, 73 per cent, of consumers satisfied with their energy supplier overall, and 20 per cent thinking of switching supplier, down from a peak of 23 per cent in Q1 202115. Ofgem's later Energy Consumer Satisfaction Survey found satisfaction levels relatively high, averaging 75 per cent across the last four waves to January 20256. In the July 2024 wave, 72 per cent were satisfied with the range of methods available to contact their supplier16.
Price perception is the weaker spot. Consumer Scotland found less than a quarter, 23 per cent, of consumers thought they were being offered a good price for energy by their supplier7. That is consistent with the pattern in Ofgem's own research: satisfaction with the supplier relationship is not the same as satisfaction with the price.
The complaints households actually raise are documented by Ofgem. A supplier is the first point of contact for late, incorrect or missing bills, back billing, being overcharged, a faulty meter, poor customer service, and refusing to refund credit from an account17. Ofgem also directs households to ask their supplier about schemes or grants that can help with energy costs, paying off energy debt, and making energy-saving improvements to the home18. The English Housing Survey covers whether households had changed their fuel supplier or tariffs and the methods of payment they use19.
"We know millions of domestic consumers will struggle with their energy bills this winter and beyond."
Support for renewables, nuclear and fracking: the headline findings
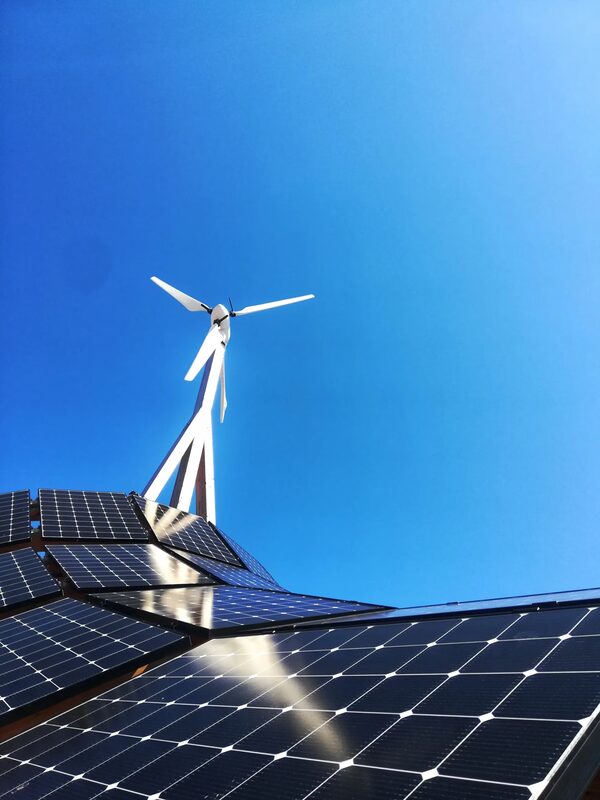
The tracker's published material on renewables is directional rather than a single number. The Planning Portal records that renewable energy technologies like solar panels, wind turbines, and biomass heaters are becoming increasingly popular20. The same statement appears in the Planning Portal's home energy generation guidance20.
The strongest dated figure in this area comes from an earlier wave of the same series. In Autumn 2021, 85 per cent of respondents to BEIS's Public Attitudes Tracker were concerned about climate change21. That figure is from a parliamentary committee publication and is the clearest single measure of climate concern in the material covered here.
Renewable generation itself is measured separately, and that measurement carries official status. Energy Trends section 6 on renewables is published as accredited official statistics22. The distinction is worth holding on to: the tracker measures what people say, while Energy Trends measures what the system generated. A rise in renewable capacity does not by itself tell you whether public support rose, and a rise in stated support does not tell you how much capacity was built.
Wales has published its own engagement material alongside the UK-wide picture. The Welsh Government's spring 2023 biannual update on renewable energy included a draft Strategy for Public Engagement and Action on Climate Change23. That is a devolved addition to the UK-wide tracker rather than a replacement for it, and it reflects the fact that energy policy touches on devolved matters even where the statistics are collected centrally.
Community-level engagement has its own history in this area. The role of community groups in smart metering-related energy efficiency activities was set out in a policy paper published on 25 March 201324. It is an old document, but it marks the point at which the government began treating community intermediaries as part of the delivery chain for household energy measures, a theme that recurs in later attitudes work.
Record support for onshore wind, offshore wind and biomass
The material covered here does not contain wave-by-wave support percentages for onshore wind, offshore wind and biomass separately, so no such figures are given. What it does contain is the direction of travel: renewable energy technologies including solar panels, wind turbines and biomass heaters are becoming increasingly popular20. That statement is the Planning Portal's summary of the position, and it is the strongest claim the available facts support.
The absence of a single headline number is itself informative about how the tracker works. It asks about a range of technologies and policies rather than producing one composite score, and the results are published across a summary report, tables and a questionnaire. The Wave 21 material, for example, was released as a summary of key findings, a questionnaire, summary tables and a technical note9. Anyone wanting a specific technology figure needs to go to the wave in question rather than to a general summary.
Where the tracker does give a clear national reading, it is on climate concern rather than on individual technologies. The Autumn 2021 figure of 85 per cent concerned about climate change21 sits alongside the directional finding on renewables20. Read together, they suggest a public that is concerned about the issue and positively disposed towards renewable technology, without the material here supporting a precise ranking of onshore wind against offshore wind against biomass.
For a household, the practical relevance is indirect but real. Attitudes data does not determine what a home can install, but it shapes the policy environment: grant schemes, planning guidance and supplier obligations all respond to what the public will accept. The installation side of that picture is covered in the MCS installation statistics and the UK heat pump installation statistics, which measure what was actually fitted rather than what people say they would consider.
From DECC to DESNZ: who runs the tracker now

The tracker has changed hands as departments have been reorganised, and the naming follows the machinery of government rather than the survey design. It began in March 2012 and ran quarterly1. It was rebranded as BEIS's Energy and Climate Change Public Attitudes Tracker, a change recorded in the Wave 21 material of 4 May 20179. It now covers public attitudes, awareness and behaviours relating to policies under the remit of the Department for Energy Security and Net Zero, and formerly BEIS, such as energy, climate change and net zero1.
The current administrator is Verian, formerly Kantar Public, an independent research organisation commissioned to conduct the survey on behalf of DESNZ1. The department publishes the results as official statistics. The Winter 2025 headline findings were published on 12 March 20264. The Spring 2026 wave was published on 2 July 20262. The technical report covering the Winter 2024, Spring 2025 and Summer 2025 waves was published on 15 December 20251.
The wave numbering reflects the methodology change rather than the full history. A new methodology was adopted from Autumn 2021 onwards1, and the Summer 2025 wave is the 14th wave in the series that began then3. Earlier waves, including Wave 21 in 2017, belong to the previous design9. Anyone comparing a figure from 2017 with one from 2025 is comparing two different instruments, and the technical reports are the place to check what changed.
The move to three waves a year followed a consultation with users over Summer 20231. That consultation is recorded in the technical report covering the Winter 2023, Spring 2024 and Summer 2024 waves25. The change reduced the frequency from quarterly to triannual, which means fewer data points per year but a consistent spring, summer and winter pattern.
Beyond the tracker: Nesta's heat pump attitudes research for Great Britain
Nesta's heat pump research takes a different approach from the government tracker. It covers Great Britain and segments the population into eight groups, labelled Segment A to Segment H, built with Experian through advanced clustering of Mosaic groups8. The starting point is that treating the population of Great Britain as a homogenous group when speaking about heat pumps is not going to result in the right outcome8.
The findings are consistent across the segments. Self-sufficiency is the strongest motivator, and cost is the biggest barrier8. Cost, comfort and confidence remain the three guiding principles across the segments, with cost being the overriding priority8. That ordering is worth noting: the thing that would most encourage a household is control over its own energy, and the thing that most holds it back is money.
Nesta also identifies who the public trusts to deliver the message. Independent, consistent advice through respected neutral parties such as Which? and Money Saving Expert are critical sources, alongside forums and people with lived experience of heat pumps8. That is a finding about the messenger as much as the message, and it sits alongside the government's own use of community groups in earlier energy efficiency work24.
The data is not open. To access the segments, Nesta directs enquirers to contact Experian to discuss a licence that enables full access to the underlying data, or, for those who already hold an Experian licence, to reach out to their Experian account manager8. That places the segmentation in the paid and restricted category rather than alongside the official statistics. The Nesta home energy research page covers the wider body of work.
The contrast with the tracker is instructive. The tracker is official, UK-wide, repeated three times a year, and free to read. Nesta's work is independent, Great Britain only, structured around eight segments rather than a national average, and licensed through Experian. Neither replaces the other: one measures the national mood over time, the other explains why that mood differs so sharply between groups of households.
Other trackers to know: Cadent's Energy Diaries and upcoming publications
Beyond the government series and Nesta's segmentation, several other trackers and publications bear on household energy attitudes. Cadent publishes a twice-yearly consumer poll, the Energy Diaries Customer Tracker, and in August 2026 it published key parts of that data in a new public dashboard for the first time26. That is a gas network operator's own research rather than official statistics, and it should be read as such.
The publication calendar matters for anyone tracking this material. The DESNZ Public Attitudes Tracker Spring 2026 report was published on 2 July 20262. The Winter 2025 wave was published on 12 March 20264. The technical report covering three waves was published on 15 December 20251. The pattern is a headline release shortly after fieldwork closes, with the technical documentation following.
Some of the material that sits alongside attitudes data is not suitable for the use people sometimes put it to. The Energy Performance of Buildings Certificates statistical release states plainly that the methodology used to assess energy efficiency does not take into account changes in energy prices, and that the data is therefore not suitable for tracking energy prices27. EPC data is publicly available, and some underlying data may be shared for monitoring and compliance of the EPB regulations, with government possibly using some for research or statistical purposes28. In Northern Ireland, EPCs are handled separately through nidirect28.
For a household, the practical use of all this is orientation rather than instruction. The trackers show that bill affordability is the dominant worry, that supplier satisfaction has held up, and that renewable technology is increasingly popular while cost remains the barrier to adoption. The switching and supplier market statistics and the energy debt and arrears statistics pages carry the market-side numbers that sit behind those attitudes. The who publishes home energy data page maps the bodies involved.

Sources28 cited
- DESNZ Public Attitudes Tracker technical report, Winter 2024 to Summer 2025, GOV.UK, 15 December 2025
- DESNZ Public Attitudes Tracker: Spring 2026, GOV.UK, 2 July 2026
- DESNZ Public Attitudes Tracker: Summer 2025, GOV.UK, 28 October 2025
- DESNZ Public Attitudes Tracker: Winter 2025, GOV.UK, 12 March 2026
- Energy Consumer Satisfaction Survey findings report, July to August 2025, Ofgem, December 2025
- What drives consumer satisfaction with energy suppliers, Ofgem, July 2025
- Consumer Scotland briefing: consumers' experiences of the energy market, Consumer Scotland, 19 December 2022
- How the British population views heat pumps: what our research means, Nesta, 2 July 2026
- Energy and Climate Change Public Attitudes Tracker: Wave 21, GOV.UK, 4 May 2017
- Customers' satisfaction with their supplier: supplier level findings, January 2026, Ofgem, May 2026
- Energy Consumer Satisfaction Survey: January 2025, Ofgem, 2025
- Energy Consumer Satisfaction Survey findings report, August to September 2023, Ofgem, February 2024
- Energy Consumer Satisfaction Survey Wave 19: interim report of findings, Ofgem, October 2024
- Good practice: supporting customers in payment difficulty, Ofgem, 27 September 2022
- Consumer Perceptions of the Energy Market Q2 2021, Ofgem, September 2021
- Energy Consumer Satisfaction Survey findings report, July 2024, Ofgem, November 2024
- Complain about your energy supplier or network operator, Ofgem, 2026
- Get help with your home or business energy bills, Ofgem, 2026
- English Housing Survey 2021 to 2022: energy, GOV.UK, 13 July 2023
- Home energy generation, Planning Portal, 2026
- Strategy for Public Engagement and Action on Climate Change, UK Parliament, 27 April 2023
- Energy Trends section 6: renewables, GOV.UK, 9 January 2013
- Written statement: publication of spring 2023 biannual update on renewable energy, Welsh Government, 2023
- Role of community groups in smart metering-related energy efficiency activities, GOV.UK, 25 March 2013
- DESNZ Public Attitudes Tracker technical report, Winter 2023 to Summer 2024, GOV.UK, 13 December 2024
- What our summer customer insights tell us about attitudes, Cadent, 5 August 2026
- Energy Performance of Buildings Certificates statistical release, July to September 2023, GOV.UK, 26 October 2023
- Energy Performance Certificates, nidirect, 26 February 2026
 The Full Statistics GuideHow many homes in the UK have solar panels, heat pumps or batteries?
 Data and Energy IndependenceHow many UK homes actually make their own power, and is that number really growing?
 Policy, Targets and Coming RulesHeat pumps are central to the government's plans for greener home heating.
 Demonstration and Test HomesBefore new heating systems reach your home, they get tested in real houses with real people living in them.
 Heat Pump Install StatisticsHow many heat pumps are actually being fitted in the UK each year, and is that number going up?
 Solar PV Deployment StatisticsHow much solar power does the UK actually have, and how much of it sits on people's roofs?