
In this guide
Public charging in the UK is priced per kilowatt hour, and the published averages sit well above what a household pays for the same electricity at home. One comparison puts average standard and standard plus public charging at 54.00 pence per kWh and average rapid or ultra-rapid charging at 79.00 pence per kWh, against a home price cap rate of 26.11 pence per kWh and an off-peak home rate of 3.59 pence per kWh1. An earlier series recorded 52p per kWh on slow and fast devices and 76p for rapid charging2.
The gap is not a small one. Over 7,100 miles, the same comparison puts off-peak home charging at £158, home charging at the price cap at £516, average standard public charging at £1,068 and petrol at £7351. Independent guidance gives the same picture in full-charge terms: £17 for home charging, £37 for a public fast charge, £53 for a public rapid charge and £45 for a tank of petrol covering 220 miles3.
What follows is the published price series, what drives the numbers, how the network differs across the four nations, the rules that apply, and what public charging means for a household's energy independence. The short version is that public charging is a bought service, not a self-supplied one, and its price reflects that.
What the published price series show
The figures that matter most are the per-kWh averages, because they are the only numbers that can be compared across networks and speeds. The most recent published comparison sets average standard and standard plus public charging at 54.00 pence per kWh and average rapid or ultra-rapid charging at 79.00 pence per kWh, with home electricity at the price cap at 26.11 pence per kWh and off-peak home electricity at 3.59 pence per kWh1. The same table gives an 80% home, 20% rapid split at 22.20 pence per kWh, which is the blended rate a driver with off-street parking and a time-of-use tariff would see1.
An earlier series recorded the average cost of charging on a public network at 52p per kWh on slow and fast charging devices, about 15p per mile, and average rapid charging at 76p2. A later series puts the slower bands at 54.00 pence per kWh and rapid charging at 79.00 pence per kWh. The two sets of figures do not reconcile exactly: 52p against 54.00 pence for the slower bands, and 76p against 79.00 pence for rapid. The difference is partly timing and partly the device bands each series covers, and both should be read as averages rather than as prices any particular network charges.
In full-charge terms, independent guidance puts home charging with an EV tariff or other time-of-use tariff at £8, home charging generally at £17, a public fast charge at £37 and a public rapid charge at £53, against £45 for a tank of petrol covering the same 220 miles5. Those figures move with battery size and with the speed of the device used, so they are illustrative of a typical car rather than a fixed price.
"Home charging, £17"
What drives the price
Three things sit behind the per-kWh rate: the speed of the device, the cost of the site, and the cost of the electricity itself.
Speed is the clearest driver. Rapid and ultra-rapid charging is priced above standard charging in every published series, at 79.00 pence against 54.00 pence per kWh in the most recent comparison1. The rapid band is defined as from 50kW up to 149kW6. Faster devices cost more to install, more to connect and more to maintain, and they are used by drivers who need a charge quickly rather than cheaply.
Site type matters too. Official statistics classify public chargers by use case: 52% were classed as destination EV chargers, 33% as on-street chargers and 11% as en-route chargers as of 1 July 20264. Destination charging, at supermarkets, hotels and car parks, is often slower and cheaper; en-route charging at motorway services is the most expensive category in practice because it combines rapid hardware with high site costs.
The underlying electricity price feeds through as well. The energy price cap sets maximum prices for a unit of energy and daily standing charges for customers in each energy supply region of Great Britain7. Ofgem attributed part of a cap increase to rises in the costs of transporting energy in Great Britain and costs towards government schemes and essential support8. ChargeUK has attributed a 38 per cent rise in public EV charging prices since 2025 to policy decisions1.
How the network differs across the UK nations
The published price series are UK-wide and do not split by nation, so there is no official per-kWh figure for England, Scotland, Wales or Northern Ireland separately. What does differ is the shape and density of the network, and that shapes what a driver can actually pay.
Official statistics recorded 121,171 public EV chargers in the United Kingdom as of 1 July 2026, or 174.9 public EV chargers per 100,000 of the population, with 41.7 rated rapid or above per 100,0004. Of those, 83.3% of public EV chargers in England and Wales were located in urban areas, compared with 82.4% of the population living in them4. That urban concentration matters for price: on-street and destination charging dominate in cities, while rural drivers depend more on en-route rapid charging at the higher rate.
Scotland has a distinct position. Ofgem noted that the public charging experience is significantly different in Scotland to the rest of Britain, with a greater variety of charge point operators and processes in Great Britain outside Scotland10. A Scottish Government consultation recorded that Scotland held 10.3% of the total UK charge point stock11.
Density varies sharply within England. SMMT reported one public charger for every 40-plus plug-in cars in the South East and North West, compared with one for every nine in London12. An earlier SMMT figure put the ratio at 1:30 electric cars to standard public chargers in the south of England and 1:52 in the north13. Northern Ireland's building regulations discussion document is the main official source on charge point provision there, and it does not publish a price series14.
| Measure | Figure | Date | Source |
|---|---|---|---|
| Public EV chargers, UK | 121,171 | 1 July 2026 | 4 |
| Chargers per 100,000 population | 174.9 | 1 July 2026 | 4 |
| Rapid or above per 100,000 | 41.7 | 1 July 2026 | 4 |
| Urban share, England and Wales | 83.3% | 1 July 2026 | 4 |
| Scotland's share of UK charge points | 10.3% | 2021 | 11 |
| Chargers per plug-in car, London | one for every nine | August 2026 | 12 |
| Chargers per plug-in car, South East and North West | one for every 40-plus | August 2026 | 12 |
The VAT difference behind the comparison
The single largest structural reason public charging costs more than home charging is not the hardware. It is that electricity bought at home for domestic use is charged VAT at the reduced rate, while electricity bought from a public charge point is a service and is charged at the standard rate. ChargeUK has made equalising VAT on charging a formal policy ask, alongside encouraging lower costs15.
That difference compounds with the unit rate. A household on an off-peak tariff pays 3.59 pence per kWh before the reduced rate of VAT; a driver on a public rapid charger pays 79.00 pence per kWh before the standard rate1. The result is that the same kilowatt hour can cost more than twenty times as much away from home, and the VAT treatment widens rather than narrows that gap.
The practical consequence is that a household with off-street parking and a time-of-use tariff is buying its motoring energy at a rate close to the wholesale price, while a household without off-street parking is buying it at a retail service rate. ChargeUK polling found that reducing public EV charging prices to below petrol could increase EV demand by nearly 50 per cent16. A separate ChargeUK release put the same finding at 48 per cent, so the two documents disagree slightly on the exact figure1.
What the rules require
The rules that govern public charging are about access and payment rather than price. Following a 2021 announcement, the government set out that it would introduce new rules to mandate a minimum payment method, such as contactless payment, for new charging devices of 7.1 kW and above, including rapid devices17. That requirement applies to new installations rather than to the whole existing estate.
Public funding has supported the rollout. The government's EV charge point grant provides funding of up to 75% towards the cost of installing EV charge points, up to a maximum of £350, for rental accommodation or flat owners in the UK18. The On-Street Residential Chargepoint Scheme installed 5,676 public charging devices across local authorities in the twelve months to 1 July 202619. A Northern Ireland consultation on building regulations discussed a cost cap of £3,600 for the average connection cost in the context of an England charge-point requirement14.
The network itself is classified into three categories: en-route charging, destination charging and on-street charging20. That classification matters for what a driver can expect to pay, because the three categories carry different hardware, different site costs and different rates.
- En-route charging: motorway services and trunk road sites, predominantly rapid and ultra-rapid.
- Destination charging: car parks, supermarkets, hotels and workplaces, predominantly standard speed.
- On-street charging: residential streets, predominantly standard speed and aimed at households without off-street parking.
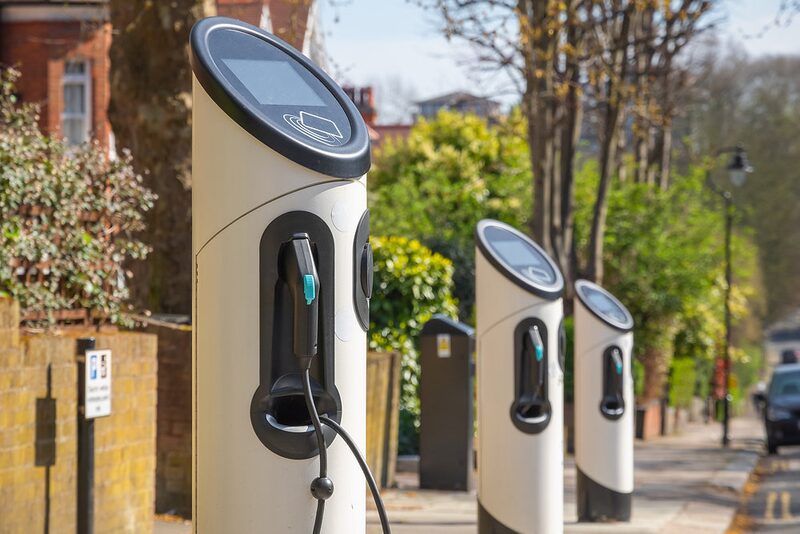
How the network has grown
The price series only makes sense against the growth of the network, because density affects what a driver can choose and therefore what they pay.
Official statistics recorded 97,266 public charging devices in the United Kingdom as of 1 July 2026, against 82,002 devices a year earlier on 1 July 20254. Independent tracking put the network at 123,677 EV chargers across 47,810 charging locations at the end of August 2026, including 41,054 on-street chargers, 20,730 rapid or ultra-rapid chargers and 1,069 charging hubs open to all EVs22. The two counts differ because devices, connectors and chargers are counted differently, so the headline totals are not directly comparable: 97,266 devices against 123,677 chargers.
Growth in 2025 was recorded at 13,281 chargers added to the UK public network6. An earlier independent count recorded 82,369 devices at 40,479 locations at the end of June 2025, with 673 charging hubs23. Official statistics for 1 July 2025 recorded 121.3 devices per 100,000 population and 24.7 devices rated 50kW and above per 100,00021.
The target set out in official guidance is 300,000 EV charging points throughout the UK by 203024. SMMT modelling suggests between 689,000 and 2.33 million public chargepoints are required by 2030, with the range depending on whether on-street residential charging or forecourt and hub charging dominates25. The Climate Change Committee estimate sits at 280,000, the International Council on Clean Transportation at 430,000 and Transport and Environment at 480,00025. Those projections are modelled, not observed, and the spread is wide.
| Measure | Figure | Date | Source |
|---|---|---|---|
| Public charging devices, UK | 97,266 | 1 July 2026 | 4 |
| Public charging devices, UK | 82,002 | 1 July 2025 | 21 |
| EV chargers, UK | 123,677 | August 2026 | 22 |
| Charging locations, UK | 47,810 | August 2026 | 22 |
| Rapid or ultra-rapid chargers | 20,730 | August 2026 | 6 |
| Chargers added in 2025 | 13,281 | 2025 | 6 |
| Government target | 300,000 by 2030 | 2025 | 24 |
What public charging means for energy independence

Public charging is the clearest case in the electric vehicle market where a household remains dependent on a bought service rather than on self-supplied energy. A driver with off-street parking and a time-of-use tariff buys electricity at 3.59 pence per kWh off peak and can, with solar and a home battery, reduce that further1. A driver without off-street parking buys the same kilowatt hour from an operator at 54.00 pence or 79.00 pence per kWh, and has no route to the off-peak rate at all1.
The dependence is layered. The household depends on the charge point operator for the price, on the site owner for access, on the electricity network for the connection, and on the grid for the power itself. ChargeUK has noted that the network can deliver nearly seven gigawatts of power every day, enough to enable every UK EV to drive 580 miles a day, or a total of over 500 million miles, against an average daily car journey of 21 miles15. That capacity is real, but it is delivered as a service.
The price gap also shapes who can benefit from cheaper motoring. Over 7,100 miles, off-peak home charging costs £158, home charging at the price cap costs £516, average standard public charging costs £1,068 and petrol costs £7351. A household without off-street parking therefore pays more for the same mileage than a petrol driver on those averages, which is the opposite of the usual expectation.
"There are plenty of publicly available chargepoints across the UK, although these are more expensive than charging at home."
The direction of travel is toward more devices and, through the government review, potentially lower prices9. Until the VAT treatment and the site cost structure change, the published data shows public charging as a service priced above domestic electricity and, on the averages, above petrol.
Sources25 cited
- Reduced public charging prices could boost EV sales, ChargeUK, 2026
- EV charging statistics, Uswitch, 2025
- Charging electric vehicles, Energy Saving Trust, 2026
- Public electric vehicle charging infrastructure statistics, 1 July 2026, Department for Transport, 2026
- Electric vehicles: debunking myths, Energy Saving Trust, 2025
- EV charging statistics, Zapmap, 2026
- Energy price cap levels, 1 October to 31 December 2025, Ofgem, 2025
- Changes to the energy price cap between 1 October and 31 December 2025, Ofgem, 2025
- Four more EV models qualify for £3,750 discount under Electric Car Grant, Department for Transport, 2025
- Phase 1 EV publication, Ofgem, 2021
- Scottish building regulations: proposed changes to energy standards, Scottish Government, 2021
- EV mandate debate needs facts not anti-industry fiction, SMMT, 2026
- UK automotive calls for EV chargepoint mandate governed by independent regulator, SMMT, 2021
- Building regulations discussion document 2023, Northern Ireland Department of Finance, 2023
- EV charging network can deliver half a billion miles of motoring every day, ChargeUK, 2024
- ChargeUK responds to review of the ZEV mandate, ChargeUK, 2026
- Government cuts plug-in grant scheme, Zapmap, 2021
- Electric vehicles for home charging, Electricity North West, 2026
- Grant schemes for electric vehicle charging infrastructure statistics, 1 July 2026, Department for Transport, 2026
- Guide to EV charging, Zapmap, 2026
- Electric vehicle public charging infrastructure statistics, July 2025, Department for Transport, 2025
- EV charging statistics, Zapmap, 2026
- Zapmap statistics for H1 2025, Zapmap, 2025
- Electric vehicle charging market study final report, Competition and Markets Authority, 2025
- SMMT EV infrastructure position paper, SMMT, 2024
 Public EV ChargingWhat does public charging really cost when you cannot plug in at home, and how do you pay for it?
 Cost to Charge an EV at HomeHow home charging cost is worked out from battery size, efficiency, the unit rate paid and the tariff behind it, with full-charge costs of about £8 to £17, cost per mile, annual running costs and what changes for EV owners from April 2028.
 EV Charging Device StatisticsHow many public charging points are there in the UK, and why do different sources give different totals?
 Charging by Home TypeHow the practical and legal position for home EV charging changes by property type: flats and leasehold consent, terraced homes without frontage, shared car parks and metering, rural properties with long cable runs, and listed or conservation area homes.
 Home EV Charger ManufacturersWhich home EV charger brands are worth considering, and how do you choose between them?
 Electric Vehicle TariffsCharging an electric car at home can cost far less overnight, but only on special electricity plans.