In this guide
Household energy independence is not one number, and no official series measures it directly. What the published data does show is a set of partial movements: a rising count of certified renewable installations, a slowly falling share of energy that has to be imported, and a metering and tariff system that gives households more information about their own consumption than they had a decade ago. The direction is real. The scale is smaller than the language of independence suggests.
The strongest single figure for household generation is MCS reporting 210,000 UK certified renewable installations between January and June 2026, 17% above the previous highest start to a year1. Against that, UK fossil fuel dependency stood at 76.6% of energy consumption in 2023, down from 78.2% in 20222. Those two figures describe the same country: a growing number of homes adding their own generation, inside an energy system that still imports most of what it burns.
The third strand is information. Ofgem states that a smart meter automatically sends your electricity and gas meter readings to your supplier, that bills are based on accurate meter readings and not estimates, and that a household can access more flexible tariffs, including dual-rate tariffs3. None of that generates a kilowatt hour. All of it changes what a household can see and respond to.
What the figures actually measure
The statistics that bear on household energy independence fall into four groups, and they are not interchangeable. Installation counts record how many certified devices have been fitted. Consumption data records how much energy a home draws. Efficiency data records how well the building holds heat. Attitude and satisfaction data records how households experience the market they buy from. A page that mixes them without saying which is which will overstate what is known.
The installation side is the most quoted and the least precise. MCS reported 210,000 UK certified renewable installations between January and June 2026, 17% above the previous highest start to a year in 20251. That is an installation count, not a household count: one property can hold more than one certified installation, and the figure covers the UK as a whole rather than any single nation.
The consumption side is built on metered data. The Domestic electricity consumption indicator is based on meter level electricity consumption data, and it is one of 109 local indicators on the Explore local statistics service6. The National Energy Efficiency Data-Framework assesses the impact of installing home efficiency measures such as loft insulation on household energy consumption, with data tables for that impact of measures analysis7. Domestic NEED records annual electricity consumption in the range of 100 to 25,000 kWh8.
The efficiency side has a status problem worth understanding. The Energy Performance of Buildings Certificates statistics for England and Wales were published as Official Statistics in Development9, and the energy efficiency characteristics of new dwellings are published as Official Statistics In Development10. The National Energy Efficiency Data-Framework, by contrast, is an accredited official statistics publication7. The distinction matters: an accredited statistic has been through a fuller assessment than one still in development.
What drives the numbers
Three forces sit behind the movement in the data: cost pressure on households, the certification and standards regime that governs installations, and the metering and tariff infrastructure that determines what a household can do with what it generates.
Cost pressure is the clearest. In England, 36.4% of households, 8.91 million, were spending more than 10% of income on domestic energy after housing costs in 2023, up from 20.5%, or 4.93 million, in 20215. Average required energy costs as a percentage of household income reached 14.9% for low income households in England on 2025 provisional figures2. The same release gives 6.8% on the same 2025 provisional basis, and the two figures are not reconciled in the published material. Where a household faces that kind of pressure, generation and efficiency measures are read as cost control as much as independence.
The standards regime shapes what gets installed and how well. MCS is an independent certification scheme for microgeneration installation companies and products, and its roles include setting and maintaining technical standards for installations and products, certifying installers and products against those standards, and issuing MCS certificates for completed eligible installations12. The limits of that regime are documented. MCS requires installers to provide a design-stage prediction of system efficiency, not verify actual performance, and does not require remediation of systems that are underperforming relative to their design13. Weather compensation is not mandatory under current requirements of the Microgeneration Certification Scheme13. MCS specifies handover documentation but not the quality of verbal explanation, household understanding, structured follow-up or ongoing support13.
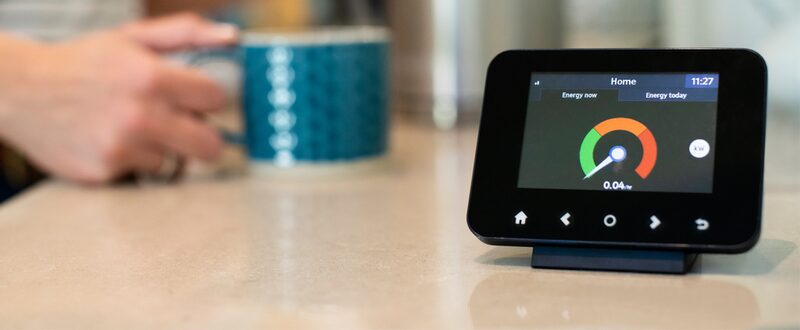
The metering layer is where a household gains the most direct control. Readings are automatically sent via the DCC's secure network to the energy supplier, which ensures the household only pays for the energy it has used rather than the approximate costs of an estimated bill14. The meter's in-home display shows how much energy is being used during the day15. What the household does not control is the price: except by switching, you do not control the tariff your energy supplier sets14.
How the picture differs across the UK nations
The four nations do not publish on the same basis, and the differences are structural rather than cosmetic.
For England and Wales, the National Energy Efficiency Data-Framework records no change in domestic electricity consumption between 2022 and 2024, against a fall of 2% for Scotland over the same period8. That is one of the few directly comparable nation-level consumption figures in the published set, and it shows Scotland reducing consumption while England and Wales held flat.
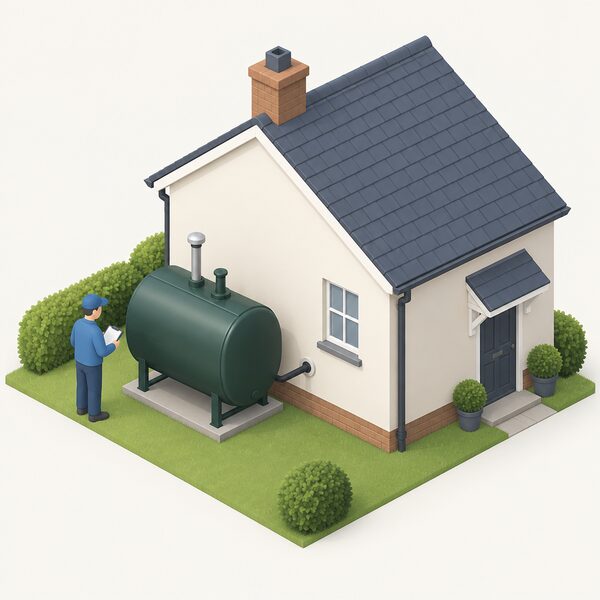
Northern Ireland sits on a different reporting footing. The Domestic electricity consumption indicator draws its Northern Ireland source from the Department for Energy Security and Net Zero (Northern Ireland)6. The Energy Rating of Housing in Northern Ireland statistics are published as Official Statistics in Development16. Northern Ireland also has a higher share of homes off the gas grid than Great Britain, which changes what independence means in practice: a household heating with oil is already independent of the gas network and dependent on a delivered fuel instead.
Scotland publishes its own fuel poverty modelling. The Scottish Government's scenario modelling is based on Ofgem energy price caps up to October to December 2026, and notes that previous price cap figures are based on 12,000 kWh gas and 2,900 kWh electricity17. That consumption basis is a modelling assumption, not a measurement of what Scottish households use.
England and Wales share the Energy Performance of Buildings Certificates series, which carries Official Statistics status18. The Green Homes Grant Local Authority Delivery and Home Upgrade Grant statistics release covers measures installed, homes upgraded, installation rates, installations by region, local authority and parliamentary constituency, carbon, bill and energy savings, and changes in Energy Performance Certificate19. That is the closest thing to a delivery record by area, and it is England-only in scope.
The rules that govern the data and the schemes
Two sets of rules matter here: the rules about how the statistics themselves are produced, and the rules about the schemes the statistics describe.
On production, the Household Energy Efficiency Statistics headline release of 25 June 2026 states that these statistics are provisional and are subject to future revisions, and that the release includes measures installed under the Energy Company Obligation and the Green Deal schemes20. That provisional status is not new. The October 2022 release carried the same wording and the same scheme coverage21, as did the May 2018 release22 and the December 2015 release23. A household reading a headline figure from any of these releases is reading a number that may be revised.
The statistical practice behind the newer series is regulated. The energy efficiency characteristics of new dwellings publication states that its statistical practice is regulated by the Office for Statistics Regulation, and that it sets the standards for the energy performance of new dwellings and non-domestic buildings10.
On schemes, the Feed-in Tariff is closed to new applicants but still generates a published record. Ofgem's Feed-in Tariff levelisation report is a transparency document published on 31 August 2026, and it details the total Feed-in Tariff payments made by FIT Licensees for the quarter from April to June 202624. The Boiler Upgrade Scheme remains open, and Ofgem publishes guidance for installers and property owners on it12. The Domestic Renewable Heat Incentive is also closed, and Ofgem directs enquiries about it to MCS26.
Where a household has a problem with a certified installation, the route is defined. Ofgem states that a household with issues with the installation process, the installer, or the MCS certificate or product contacts MCS26. MCS can be contacted on 0333 103 8130, and may contact a household for a short, routine verification on behalf of Ofgem either by email or by phone on 0333 103 819825. Property owners contacted for MCS checks are asked to respond within seven days25.
"MCS requires installers to provide a design-stage prediction of system efficiency, not verify actual performance."
What independence the data supports, and what it does not
Read together, the figures support a modest claim and refuse a larger one.
What they support: a growing number of UK homes hold certified renewable installations, with 210,000 fitted between January and June 2026, 17% above the previous highest start to a year1. Households that install efficiency measures reduce their consumption, which the National Energy Efficiency Data-Framework is built to assess7. Households with smart meters get accurate rather than estimated billing, and access to more flexible tariffs including dual-rate tariffs3. Heating controls affect domestic energy demand, a point the government's rapid evidence assessment addressed when it was published on 28 January 201428.
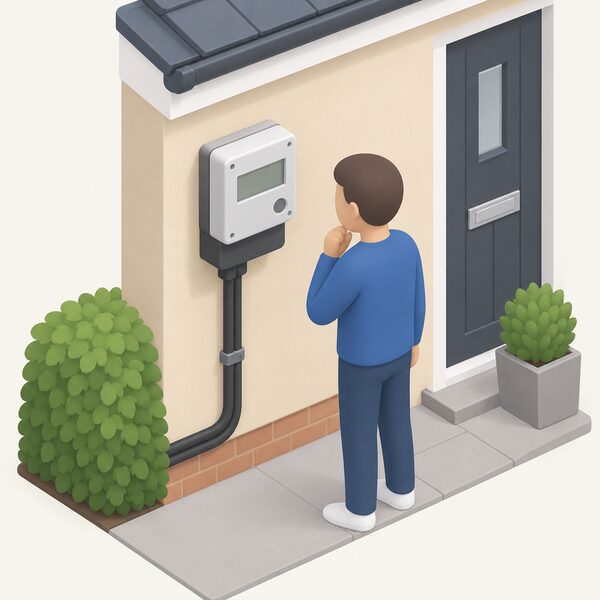
What they refuse: any claim that the average UK home is self-sufficient. UK fossil fuel dependency was 76.6% of energy consumption in 20232. A home with solar and a battery still imports in the hours it cannot cover, still buys that import from a supplier, and still has no control over the tariff except by switching14. A home with a heat pump depends on the electricity system and on the manufacturer's company for parts and support. A home with a smart meter depends on the DCC network and on the supplier's systems: a meter may stop recording the energy used, or may no longer send readings to the supplier3, and a meter may not work in smart mode after a change of supplier, requiring manual readings, though it may work in smart mode again if tariffs or suppliers change29.
The dependence that remains is therefore specific and nameable: the grid for imported units, the supplier for tariff and billing, the network operator for connection, the certification body for standards, and the manufacturer for the life of the equipment. Independence in the household energy sense is a reduction in volume imported and an improvement in information, not a severance.

Where the data is weakest
Three weaknesses are worth stating plainly, because they limit what any conclusion can carry.
First, several of the series that would answer the independence question most directly are either in development or discontinued. The Energy Efficiency of Housing statistics were discontinued, with the Office for National Statistics stating that it had reviewed its outputs and decided to discontinue them11. The energy efficiency characteristics of new dwellings are published as Official Statistics In Development10. The Energy Rating of Housing in Northern Ireland statistics are Official Statistics in Development16.
Second, the headline household efficiency series is provisional. The June 2026 release states that these statistics are provisional and are subject to future revisions20, and every earlier release in the same series carried the same caveat21. A figure quoted from one of these releases may change.
Third, the installation counts do not measure homes. MCS reported 210,000 UK certified renewable installations between January and June 20261, but an installation is a certified device, not a property, and the count does not tell a reader how many households hold more than one technology or how much of their consumption those technologies cover. Self consumption, the share of generated electricity used on site rather than exported, is not given as a national figure in the published set.
For a household trying to read its own position, the practical route is the metered data rather than the national aggregates: the Domestic electricity consumption indicator is built on meter level electricity consumption data6, and the National Energy Efficiency Data-Framework assesses the impact of efficiency measures on household consumption7. Those are the series that describe a home rather than a country.
Sources29 cited
- Record number of UK households combining renewables to improve energy resilience, MCS, 20 August 2026
- DESNZ annual report and accounts 2025 to 2026: performance report, GOV.UK, 2026
- Getting a smart meter, Ofgem, 2026
- Energy terms explained, Ofgem, 2015
- Energy spending and fuel poverty inquiry, House of Commons Environmental Audit Committee, 2023
- Domestic electricity consumption indicator, Office for National Statistics, 18 December 2025
- National Energy Efficiency Data-Framework: impact of measures data tables 2025, GOV.UK, 26 June 2025
- National Energy Efficiency Data-Framework: NEED report summary of analysis 2026, GOV.UK, 11 June 2026
- Energy Performance of Building Certificates in England and Wales, January to March 2024, GOV.UK, 25 April 2024
- Energy efficiency characteristics of new dwellings, GOV.UK, 4 February 2026
- Energy efficiency of housing in England and Wales, Office for National Statistics, 23 April 2026
- Boiler Upgrade Scheme, Ofgem, 2026
- Heat pump transition report, Committee on Climate Change, May 2026
- How do smart meters save energy?, Smart DCC, 2026
- Get help with your smart meter, Ofgem, 17 September 2026
- Energy Rating of Housing in Northern Ireland, Northern Ireland Department for Communities, July 2024
- Fuel poverty scenario modelling based on Ofgem energy price caps, Scottish Government, 2026
- Energy Performance of Building Certificates in England and Wales, April to June 2025, GOV.UK, 31 July 2025
- Green Homes Grant Local Authority Delivery and Home Upgrade Grant release, July 2025, GOV.UK, 31 July 2025
- Household Energy Efficiency Statistics, headline release June 2026, GOV.UK, 25 June 2026
- Household Energy Efficiency Statistics, headline release October 2022, GOV.UK, 27 October 2022
- Household Energy Efficiency National Statistics, headline release May 2018, GOV.UK, 17 May 2018
- Household Energy Efficiency National Statistics, headline release December 2015, GOV.UK, 17 December 2015
- Feed-in Tariff levelisation report, April to June 2026, Ofgem, 31 August 2026
- Boiler Upgrade Scheme guidance for installers, Ofgem, 24 April 2026
- Domestic Renewable Heat Incentive: who to contact, Ofgem, 17 September 2026
- Get help with your smart meter, Ofgem, 2026
- How heating controls affect domestic energy demand: a rapid evidence assessment, GOV.UK, 28 January 2014
- What happens if your energy supplier goes out of business, Ofgem, 2026
 The Full Energy Independence GuideCan you really run your home on your own power in the UK, and how far can that go before the grid still matters?
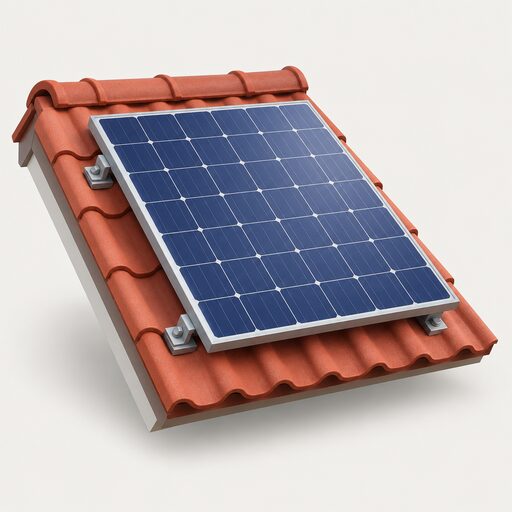 Solar PV Deployment StatisticsHow much solar power does the UK actually have, and how much of it sits on people's roofs?
 Can a Home Be Self-Sufficient?Can a UK home really run on its own energy all year, or does the grid still do the heavy lifting in winter?
 The Full Statistics GuideHow many homes in the UK have solar panels, heat pumps or batteries?
 Household Import DependenceGas and oil make up most of what a typical UK home spends on energy, and roughly half of that gas comes from abroad.
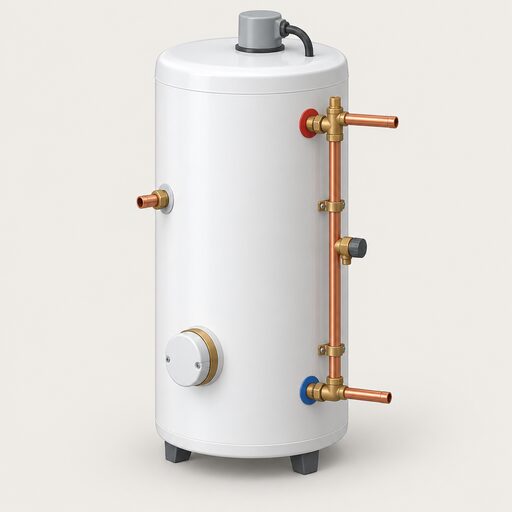 Solar and Energy IndependenceHow far domestic solar cuts dependence on suppliers and the grid, what self-consumption really looks like across the year, what a battery, diverter or EV adds, and the grid-outage limit of ordinary inverters.