
In this guide
Installed solar photovoltaic capacity in the UK is now nearly 24GW according to the University of Sheffield's PV_Live tracker, read in September 20261. Government statistics put the total at around 21 gigawatts by the third quarter of 20251, and the official monthly deployment series carried UK data up to the end of June 2026 in its July 2026 release2. On the household side, Energy Saving Trust states there are nearly 1.7 million solar installations on homes across the UK3, while certification data recorded 1,441,753 solar PV installations since 2009, described as equivalent to more than 5 per cent of all UK households4.
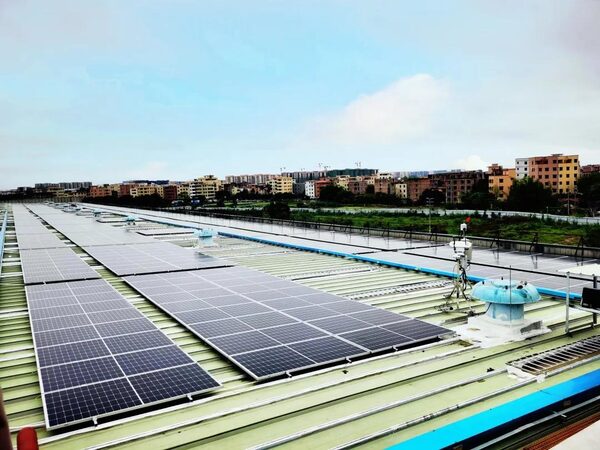
Those two strands, capacity in gigawatts and installations in counts, are the whole of the deployment picture, and they do not move together. A single ground-mounted array larger than 5 MW can add as much capacity as several thousand rooftops. In December 2017, installations greater than 5 MW made up 46 per cent of total installed UK solar PV capacity, while small scale systems of 0 to 4 kW, the band that covers most homes, made up 20 per cent5. Reading the capacity headline as a proxy for household uptake overstates how many roofs are involved.
The direction of travel is contested. The Climate Change Committee's 2025 report to Parliament found that the roll-out of solar appears significantly off track against what a decarbonised power system needs6. Against that, certified installation volumes are at record levels: almost 150,000 certified solar installations in the first half of 20267. This page sets out the published figures, the bands the official releases use, and where the numbers disagree.
Where the monthly numbers come from
Solar PV deployment is published as an accredited official statistic on a monthly cycle, covering deployment of all solar photovoltaic capacity in the United Kingdom10. The series has run in this form for well over a decade: releases covering the end of May 2015, November 2015, May 2016, November 2016, October 2017, November 2017, September 2018, February 2019, August 2019, February 2020, December 2020 and April 2021 all carry the same accredited status and the same territorial extent11. Continuity of definition across that span is what makes the back series usable.
Each release is dated by the month it covers rather than the month it appears. The release published on 30 June 2026 included UK data up to the end of May 202613; the release of 30 July 2026 ran to the end of June 20262. That lag of roughly a month, plus subsequent revision as late returns arrive, is the main reason a tracker figure and an official figure taken on the same day will differ. The December 2026 figures are scheduled for release at 9:30am on 28 January 202714. More on how revisions and accredited status work is set out in how to read UK energy statistics and in the guide to official energy statistics publications.
The series is also broken down by capacity band, which is what allows the domestic share to be separated out. The bands matter for classification rules too: under Feed-in Tariff guidance, an installation counts as stand-alone "if it is not wired to provide electricity to a building"15, which is how a field array is distinguished from a rooftop system on the same paperwork.
Capacity: from 2.7 GW to nearly 24GW
The growth is documented across two decades of official and independent readings, and more than 99 per cent of UK solar PV capacity was deployed since May 201016.
| Date | Installed UK solar capacity | Source type |
|---|---|---|
| September 2013 | 2.7 GW17 | independent news |
| End of 2013 | 14 per cent of UK renewable electricity capacity18 | official guidance |
| October 2016 | around 12 GW19 | independent news |
| December 2017 | 12,748 MW, approximately 12.75 GW5 | official |
| October 2018 | over 13 GW, enough to power over 3 million homes20 | official |
| 2018 | 13 GW, up from 3 GW21 | independent |
| April 2022 | almost 14 GW16 | official |
| January 2024 | 15.7GW22 | independent statistics |
| 2025 | 21.7GW after adding 2.8GW23 | independent news |
| September 2026 | nearly 24GW1 | independent, PV_Live |
Capacity during 2013 grew by almost 1,000 MWp18. The December 2017 total was an increase of 32 per cent, or 3,057 MW, on December 20155. Solar Energy UK put total installed UK capacity at 14.6GW in 2021, after 730MW was installed during that year, a 36 per cent increase on the 538MW deployed in 202024. In the first quarter of 2021 alone, 175 MW was installed across the UK25.
The figures do not perfectly reconcile. Solar Energy UK estimated at least 15GW in place in February 2023, two thirds of it on the ground and the remainder on residential and commercial roofs26, while independent statistics gave 15.7GW as of January 2024 with a further 58MW added in January 2024 alone22. One trade body reading placed capacity at more than 14 GW in mid-2021, enough to power around three million households27. Differences of this size reflect cut-off dates, revision, and whether very small systems are captured, not error. A shorter answer to the capacity question sits on how much solar capacity does the UK have.

Domestic installations: the count, not the capacity
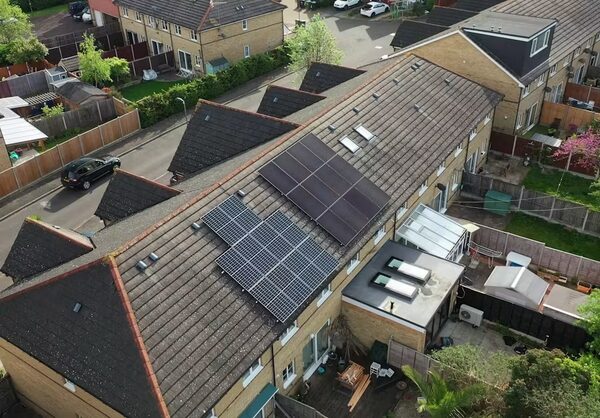
Household deployment is measured in installations. Certified counts for domestic systems ran as follows: 934,486 in April 2018, 1,024,942 in April 2020, 1,067,693 in April 2021, 1,145,498 in April 2022, 1,320,783 in April 2023 and 1,498,949 in April 202429. Energy Saving Trust put the figure at almost 1.5 million installations on homes across the UK at the end of 202430, rising to nearly 1.7 million by August 20263. A parliamentary briefing records 1,366,599 domestic installations among owner occupiers in April 202631.
Earlier estimates were smaller and rougher. Around 900,000 photovoltaic installations were recorded across the UK in March 201732, and 898,029 installations, a provisional figure, in November 20165. Ofgem's 2021 consumer survey estimated solar PV prevalence in domestic properties at roughly 3 to 4 per cent8, which is well below the "more than 5 per cent of all UK households" implied by cumulative certification counts since 20094. The gap is instructive: cumulative certification counts systems ever installed, including those on homes since demolished, re-roofed or with panels removed, while a survey counts homes that have working panels now. Neither is wrong; they answer different questions. MCS installation statistics sets out the certification basis in more detail.
What moves the monthly figures
Subsidy deadlines dominate the short-run series. Certified installations dropped from 26,941 in March 2012 to 5,522 in April 2012 as Feed-in Tariff rates were cut, and hit 25,614 in December 2015 ahead of a further reduction in February 20164. Any monthly chart of UK solar deployment shows those spikes and the troughs behind them, which is why a single month is a poor guide to underlying demand. The record of the closed scheme is covered in Feed-in Tariff installation statistics.
The more recent driver is volume rather than subsidy timing. Monthly certified installations reached 17,787 in May 2023, the twelfth highest month on record, and 18,049 in June 2023, the eleventh highest4. There were 102,797 certified solar PV installations in the first half of 202333 and 183,022 across the UK over that year to date34. In the first half of 2026 there were almost 150,000 certified solar installations7, and MCS reported 210,000 certified renewable installations of all types between January and June 2026, 17 per cent above the previous highest start to a year, in 20257.
Cost is the other lever. A typical domestic solar PV system costs around £6,100 to install, as reported by Which? in June 202635. That figure is not broken down by system size or VAT position, and installer quotes remain the operative price for any given roof; see what home energy installations have cost over time.
Policy ambition also shapes expectation rather than current output. The 2013 UK Solar PV Strategy set the principle that support "should deliver genuine carbon reductions that help meet the UK's target of 15 per cent renewable energy from final consumption by 2020"36. In 2021, solar supplied more than 4 per cent of the UK's entire electricity demand, which Solar Energy UK stated could treble by 203037.
Targets and the gap to them
Projections have repeatedly been overtaken or undershot, and the spread between them is wide.
| Target or projection | Figure | Source |
|---|---|---|
| 2013 estimate for 2020 | 10 to 12 GW20 | official |
| 2014 strategy, by end of decade | 10 to 12 GWp18 | official guidance |
| 2023 consultation projection | 14GW today to 70GW by end of decade38 | official |
| 2030 jobs methodology assumption | up to 47 GW in Great Britain39 | official |
| National ambition to 2030 | around 20GW today to 45 to 47GW40 | independent |
| Seventh Carbon Budget, 2040 | 82 GW41 | independent advisory |
| Warm Homes Plan, 2030 | triple solar installations across the UK42 | official target |
The 2013 estimate of 10 to 12 gigawatts by 2020 was exceeded well before that date, with over 13 GW installed by October 201820. The 2014 strategy's projection of 10 to 12 GWp by the end of the decade sits against an alternative figure of up to 20 GWp in the same document, and the two have not been reconciled18. An earlier roof-count ambition of one million roof installations by the end of 2015 followed deployment on over half a million buildings by 201418.
Against the current total, the 2030 ambitions require roughly a doubling. The Climate Change Committee's assessment is unambiguous:
"The roll-out of solar appears significantly off track and will need to improve to deliver its contribution to a decarbon"
Land use is often raised against ground-mounted expansion. The UK Solar Roadmap states solar deployment today occupies 0.1 per cent of total UK land9. Commercial and industrial rooftops accounted for 5 to 20 per cent of UK solar PV deployment in the 2014 assessment18.
Scotland, England and the regional spread
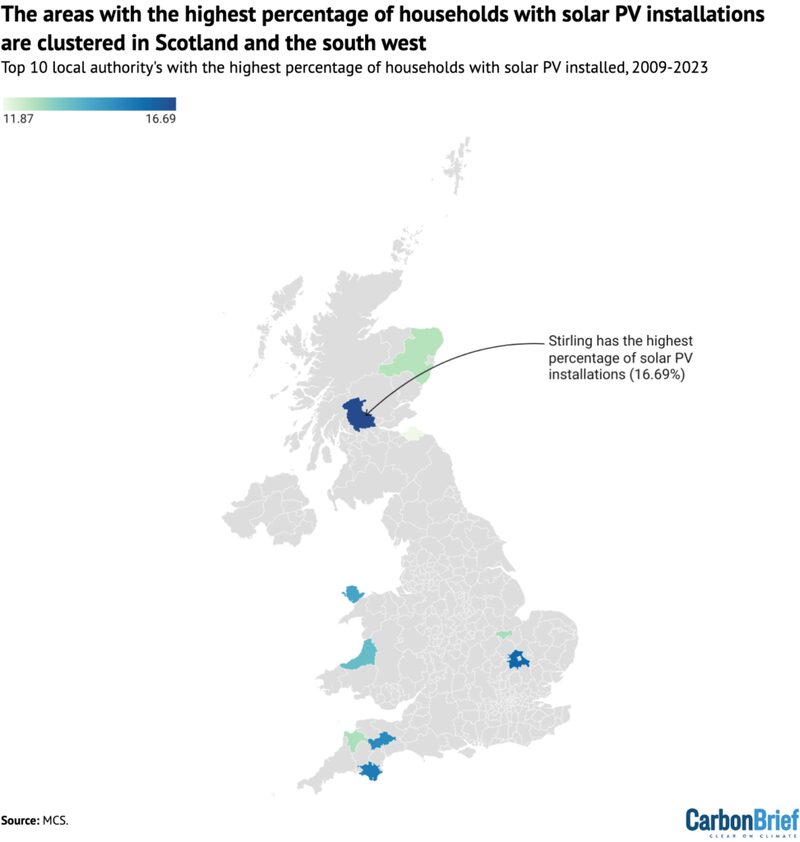
Deployment is markedly uneven. England recorded 44 solar PV systems per 1,000 households in the 2026 comparison, a rate Scotland sits below43. Feed-in Tariff reporting shows the structural reason for part of the difference: solar PV made up only 37.89 per cent of installed capacity in Scotland at 30 September 2024, whereas in all other regions it accounted for over 74 per cent44. Scotland's accredited small-scale fleet carries far more wind and hydro, so solar is a smaller slice of a differently composed whole rather than simply absent.
Within England, the spread is measured per head. The median number of solar panel installations per 10,000 people across UK local authorities is 123, calculated as the number of installations divided by population, multiplied by 10,00042. Areas flagged as having untapped potential combine a below-average installation rate against that median of 123, an above-average share of homeowners against a UK median of 68 per cent, a higher than average share of rural homes, and above-average growth compared with 2025, where the UK median growth was 23 per cent42. Tenure is the recurring constraint: owner occupation and roof control determine who can commission a system, which is why rural owner-occupied stock scores highest on potential. Local breakdowns are covered in MCS data by local authority and the comparison in rural versus urban renewable uptake.
On the physics, Energy Saving Trust is direct: "Solar panels are suitable for anywhere in the UK"42. Regional variation in deployment therefore reflects housing tenure, roof stock, installer coverage and policy history rather than latitude. Installer availability differs too: one supplier installs solar panels and batteries in multiple places across the south of England, another throughout Great Britain45. Northern Ireland is not separately covered by the Feed-in Tariff regional comparison cited here; uptake there is set out in certified renewable installations in Northern Ireland, and nation-level generation in renewable generation statistics by UK nation.
What the deployment data says about household independence
Solar PV is the most widely deployed domestic generation technology in the UK, and the deployment figures set the honest boundary on what it delivers. Nearly 1.7 million homes have an installation3, which against the UK housing stock leaves the overwhelming majority of households with no on-site generation at all. Even among those with panels, a rooftop system produces nothing at night and little in midwinter, so the grid connection and a supply contract remain in place year-round. Solar reduces the volume bought from a supplier; it does not sever the relationship.
At national level the effect is framed as import substitution. Solar Energy UK describes the technology as reducing dependence on fossil fuel imports46, and states that solar "can and must support the UK's transition to a NetZero economy"37. In 2021 solar supplied more than 4 per cent of UK electricity demand37. Capacity of almost 14 GW was described in Parliament as enough to power more than 3 million homes16. Those are system-level statements: capacity sufficient to power three million homes is not the same as three million homes running independently, because output and demand do not coincide in time.
The dependencies that remain are worth naming plainly. Two thirds of UK capacity was estimated to be ground-mounted rather than on roofs26, so most of the fleet is utility infrastructure owned by others. Domestic systems depend on a manufacturer for warranty, an installer for certification, and, where a battery or export tariff is involved, on supplier systems and often an app. Households increasingly combine technologies for resilience, which is the context in which the record 210,000 certified installations in the first half of 2026 were reported7. Storage changes the picture materially and is covered in home battery installation statistics; the broader question is treated in what the data says about household energy independence and across the UK home energy statistics pillar.
The practical reading of the deployment series is this: capacity is growing fast, household counts are growing steadily, the official monthly series is the authoritative record with a one-month lag, and the gap between around 21 to 24GW today and 45 to 47GW by 2030 is the measure of how much of this remains ahead.
Sources46 cited
- UK solar power hits record high over summer 2026, Carbon Brief, 4 September 2026
- Energy Trends and Prices statistical release, 30 July 2026, GOV.UK, 30 July 2026
- Solar power facts, Energy Saving Trust, 13 August 2026
- Surge in heat pumps and solar drives record for UK homes in 2023, Carbon Brief, 2023
- Fires and solar PV systems: investigations and evidence, GOV.UK, December 2017
- Progress in Reducing Emissions: 2025 Report to Parliament, Climate Change Committee, 2025
- Record number of UK households combining renewables, MCS, 20 August 2026
- Consumer Survey 2021: decarbonisation and home energy use, Ofgem, 2021
- UK Solar Roadmap, DESNZ, June 2025
- Energy Trends section 6: renewables, GOV.UK, 9 January 2013
- Solar PV deployment: April 2021, GOV.UK, 27 May 2021
- Solar PV deployment: November 2016, GOV.UK, 22 December 2016
- Energy Trends and Prices statistical release, 30 June 2026, GOV.UK, 30 June 2026
- Solar PV deployment: December 2026, release announcement, GOV.UK, 6 January 2026
- Feed-in Tariff guidance for renewable installations, Ofgem, 20 June 2016
- Domestic Solar Energy debate, Hansard, 20 April 2022
- Solar power: how renewable energy's Cinderella got a fancy new dress, Carbon Brief, 2 September 2013
- UK Solar PV Strategy Part 2, UK Parliament deposited papers, April 2014
- UK solar beats coal over half year, Carbon Brief, 4 October 2016
- HELMS and the Green Deal debate, Hansard, 23 October 2018
- Modelling Zero Carbon Britain, Centre for Alternative Technology, 2018
- Green energy statistics, Uswitch, 2024
- Faster electrification will put money back into people's pockets, Carbon Brief, 2025
- Six years of solar roofs: strongest growth since 2015, Solar Energy UK, 2021
- Solarwatt takes its pioneering role further, Flexi-Orb, 1 July 2021
- Rooftop solar power installations double in a year, Solar Energy UK, 24 February 2023
- Solarwatt establishes UK subsidiary, Flexi-Orb, 2 September 2021
- Smith Bros becomes UKSOL distributor for the United Kingdom, Flexi-Orb, 13 July 2021
- Green home statistics, Uswitch, 2024
- Buying a house with solar panels, Energy Saving Trust, 2024
- POSTnote PN-0771, UK Parliament POST, 2026
- Future Insights Series 4, Ofgem, March 2017
- UK on track for best year ever for renewable energy and heat installations, MCS, 30 June 2023
- UK sees the best year ever for the installation of renewable energy and heating, MCS, 2023
- Solar panel myths debunked, Which?, 9 June 2026
- UK Solar PV Strategy Part 1: roadmap to a brighter future, GOV.UK, 8 October 2013
- Everything under the sun: the facts about solar energy, Solar Energy UK, 17 September 2026
- Smoothing the journey: engaging domestic consumers in energy flexibility, Ofgem, 17 August 2023
- Job estimates for solar PV by 2030: methodology note, GOV.UK
- Setting the standard: product certification and the future of UK solar, MCS, 8 December 2025
- The Seventh Carbon Budget, Climate Change Committee
- UK solar panel hotspots, Energy Saving Trust, 13 August 2026
- Uptake of net zero technologies in Scottish homes, ECIU, 2026
- Feed-in Tariffs Quarterly Report Issue 57, Ofgem, 30 September 2024
- Solar panel costs, Which?, 3 August 2026
- The UK's clean energy leadership: insights from the World Energy Outlook 2024, Solar Energy UK, 29 November 2024
 Data and Energy IndependenceHow many UK homes actually make their own power, and is that number really growing?
 The Full Statistics GuideHow many homes in the UK have solar panels, heat pumps or batteries?
 System SizingMost UK homes need a solar system of around four kilowatts, which takes up roughly twenty square metres of roof.
 Solar Panel CostsA typical UK home pays somewhere between four and eleven thousand pounds for solar panels fitted, with most landing in the middle.
 Home Battery Install StatisticsHow many homes in the UK actually have a battery, and is that number growing quickly?
 Monitoring a Solar PV SystemHow do you keep an eye on what your solar panels are actually generating?