
In this guide
Domestic gas and electricity prices in Great Britain are anchored to Ofgem's default tariff cap, which came into force at the beginning of 2019 and is revised each quarter. The cap sets maximum prices for a unit of energy and for the daily standing charge, with separate caps for gas and electricity, and it applies where a customer has not signed up for a fixed-term contract with their supplier. It does not limit annual bills, which depend on how much energy a household uses1.
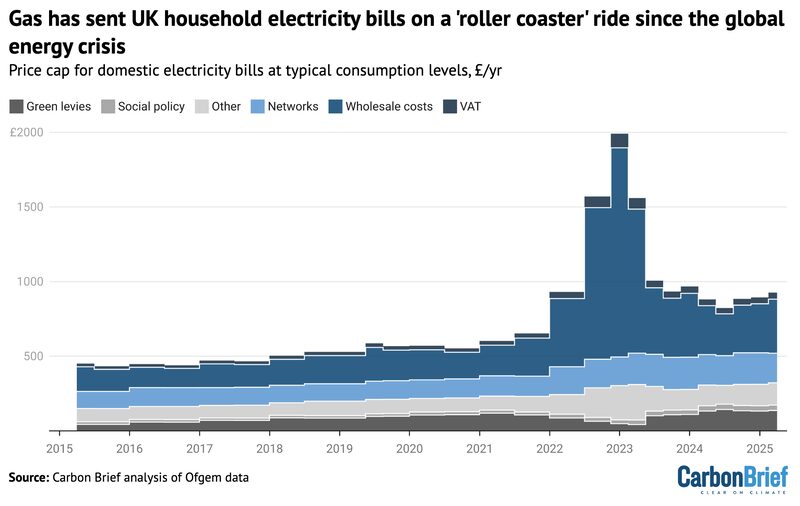
The price series that most people recognise is the illustrative annual figure for a household with typical consumption, assumed to be 2,500 kWh of electricity and 9,500 kWh of gas a year2. On that basis the cap stood at £1,277 a year in early 20223, rose by 54% in April 2022 as wholesale prices climbed2, and reached its crisis peak under the Energy Price Guarantee, which held the equivalent figure at £2,500 from January 20234. By 1 October to 31 December 2025 the average Direct Debit dual fuel bill under the cap was £1,755 a year5, which Ofgem described as £625, or 26.3%, lower than at the peak at the start of 20236. For 1 July to 30 September 2026 the cap equated to £1,862 a year for Direct Debit customers in England, Scotland and Wales7.
Prices have not returned to pre-crisis levels. In October 2023 annual bills for typical consumption under the cap were still almost £800, or 69%, above their summer 2021 levels4. That gap is the practical reason households look at on-site generation, storage and fabric measures: the cap constrains the price per unit, not the number of units a home has to buy.
What the price cap is and what it actually limits
The cap is UK government legislation, first introduced in January 20198. Ofgem, Great Britain's energy regulator, sets the maximum amount suppliers can charge for each unit of energy used10, and the maximum the supplier can charge for a unit of energy and the standing charge together11. It protects people on tariffs where the unit rate can go up or down depending on the energy market, described as standard variable tariffs11. The Treasury's own framing during the crisis was that the cap "protects consumers from the rapid changes observed in the wholesale energy market in the short term"12.
The limit is a price limit only. Ofgem is explicit: "It does not limit the cost of your total bill. The more energy you use, the higher your bill will be."11 Independent consumer guidance says the same, that the cap "doesn't limit your total bill"13. Every headline pound figure quoted in the press is therefore a modelled annual bill for a typical household, not a maximum charge any household will see.
Coverage is large. Ofgem stated in May 2025 that the cap protects 22 million default tariff and standard variable tariff customers14; a Commons Library briefing put it at around 28 million customers in Great Britain as at July 202415. The difference reflects different counting of meters and customers across the two documents.
From £1,277 to the crisis peak and back down
The series over time is the clearest way to see what happened to household energy costs.
| Period | Cap level or change | Source |
|---|---|---|
| Early 2022 | £1,277 a year, typical consumption3 | Carbon Brief |
| April 2022 | 54% increase in the cap2 | Commons Library |
| October to December 2022 | £3,371, with £4,059 also given in the same briefing2 | Commons Library |
| From January 2023 | £2,500 under the Energy Price Guarantee4 | Ofgem |
| 1 July to 30 September 2024 | £1,568 a year16 | Which? |
| 1 October to 31 December 2025 | £1,755 a year, Direct Debit5 | Ofgem |
| 1 January to 31 March 2026 | around £1,758, dual fuel Direct Debit17 | Welsh Government guidance |
| 1 April to 30 June 2026 | £1,64118 | Welsh Government |
| 1 July to 30 September 2026 | £1,862 a year7 | Centre for Sustainable Energy |
Two figures in that table carry a caution. Sources give both £3,371 and £4,059 for the Q4 2022 cap, and they are not consistent; the £3,371 figure is the one stated as "the Q4 (October-December) 2022 price cap"2. For January to March 2026, figures of around £1,758 and around £1,711 for a typical dual fuel Direct Debit home both appear, and the two cannot be reconciled here17.
The direction of travel since 2023 has been downward but uneven. Ofgem's February 2025 announcement raised the cap by £111 for an average household per year, around £9.25 a month over the three-month period, leaving it £531, or 22%, lower than at the height of the crisis at the start of 202319. In September 2024 the cap rose by £149 a year for a typical variable tariff household16. The October 2025 change was a 2% rise6, described in independent statistics as a 2.03% increase on the previous quarter8. For January to March 2026 the increase amounted to 28 pence a month for a typical dual fuel Direct Debit household20. The April 2026 cap fell by 7%17, leaving a typical household paying just under £10 less a month than between January and March that year16. Then in July 2026 the price of electricity rose 6% per unit and gas 28% per unit21.
How the cap is set and why it changes every three months
Ofgem sets the level every three months11, calculated on a three month basis22, and reviewed every three months22. In each review the regulator sets how much a supplier can charge for each unit of energy and for the daily standing charge6. When the cap began it was revised every six months3; the move to quarterly reviews followed the volatility of the crisis, and the effect is that the retail price now tracks wholesale movements with a shorter lag.
The components Ofgem allows for are wholesale costs, network costs, policy costs, operating costs, EBIT, headroom, a levelisation allowance and VAT at 5% on gas11. Ofgem also states that it "will be closely monitoring supplier compliance and will continue to take firm action against suppliers who fall short of their requirements"23.
What moves the number between quarters is usually wholesale. Carbon Brief estimated that 87% of the increase in the UK cap in April 2022, relative to a year earlier, was due to wholesale prices3. Not every move is wholesale-driven: Ofgem attributed the October 2025 rise to increases in parts of the costs of transporting energy in Great Britain and costs towards government schemes and essential support6. For the period after April 2026, guidance reports estimates that the cap is expected to stay roughly the same until the end of the year17.
What makes up the bill: wholesale, network, policy and operating costs
Ofgem lists the elements used to calculate what a household pays as wholesale costs, the cost a supplier pays to buy energy, plus network costs, operating, debt and industry costs, EBIT, policy costs and VAT at 5%, together with the type of energy used, the type of meter installed and how the bill is paid24.
The relative weights matter for anyone judging how much of a bill can be avoided by generating at home. Network costs are the second most important component of the cap, making up almost 30% of the total1. On the rise since pre-crisis levels, a Lords Library analysis attributes 54% to higher wholesale prices, with network charges and "green levies" accounting for 20% and 6% of the rise respectively13. Policy costs were cut in April 2026, when the government ended a levy-funded energy efficiency scheme and shifted funding for the largest renewable generation support scheme to general taxation1.
For a household, the practical reading is that a large share of the unit price is not the energy itself. Self-generation displaces the wholesale and, in part, the policy and network elements carried in the unit rate, but it does not displace the standing charge at all while the property remains connected.
Standing charges: the fixed cost paid whatever you use
Standing charges are a daily charge that energy customers have to pay even if they use no energy26. Ofgem's own wording is plain:
"The standing charge is a fee you pay each day, even if you do not use any energy on that day."
The charge covers the fixed costs of providing a home with gas and electricity, including network connection, meter readings, maintenance and government initiatives27. For the cap period running from 1 July to 30 September 2026 the average electricity standing charge was 57.19p per day27; the October figure quoted alongside it was 54.83p per day28.
This is the single most important item for a household pursuing energy independence. A home that generates and stores most of its own electricity still pays the daily charge on every connected fuel, and the charge is not reduced by using less. The cap's regional tables show the fixed element directly: for 1 July to 30 September 2026 the standing charge component ran from £172.77 a year in Southern to £223.48 a year in Northern on the first electricity table21. Removing a gas connection removes that fuel's standing charge, but nothing in the cap framework reduces the electricity standing charge for a low-consumption home.
Regional variation: why your postcode changes the cap
A separate price cap is set for each of the 14 regions and applies throughout the region, with no breakdown below regional level1. Ofgem's original design explained why: "the cap level will vary across Great Britain, because the costs of transporting the energy from the generation source to the customer (the 'network charges') vary by region"29.
The table below uses Ofgem's benchmark maximum charges for 1 July to 30 September 2026, electricity, single-rate metering, showing the standing charge component and the annual figure at 2,500 kWh21.
| Region | Standing charge element (£/yr) | Annual bill at 2,500 kWh (£) |
|---|---|---|
| Northern | 223.48 | 824.03 |
| Midlands | 207.57 | 810.72 |
| Southern Western | 201.24 | 829.48 |
| South East | 189.27 | 824.22 |
| Southern | 172.77 | 801.74 |
| London (second table) | 181.21 | 843.39 |
The spread persists across cap periods. For 1 October to 31 December 2025, standard credit electricity cap levels at 3,100 kWh were £1,023.11 in Eastern, £1,008.32 in Southern and £983.41 in London30. In the Charge Restriction Period 15b tables, the nil-consumption electricity figure was £207.59 in Yorkshire against £158.87 in Southern31. Older periods show the same pattern: at 3,100 kWh in period 12b, prepayment electricity came to £832.24 in Eastern and £813.48 in London32.
Daily standing charges show the gap most sharply. Against a UK average of 57.19p per day for July to September 2026, London was 44.78p per day9.
Payment method: Direct Debit, standard credit and prepayment compared
Payment method is one of the factors Ofgem names as changing the capped price, alongside where you live, fuel type and meter type11. For the October to December 2025 period the totals were £1,755 for Direct Debit, £1,890 for standard credit and £1,707 for prepayment, each a £35, or 2%, increase on the previous quarter23.
| Payment method | Cap total, 1 Oct to 31 Dec 2025 | Previous quarter |
|---|---|---|
| Direct Debit | £1,755 | £1,720 |
| Standard credit | £1,890 | £1,855 |
| Prepayment | £1,707 | £1,672 |
All three figures come from Ofgem's summary of changes for that period23.
The gaps are set deliberately. Ofgem applies a levelisation allowance to make sure prepayment and Direct Debit customers pay the same standing charge11. From 1 April 2024 that meant prepayment customers typically paid £49 a year less, or £52 a year less including VAT, while customers paying by standard credit, cash or cheque paid an additional £106 compared with those paying by Direct Debit33. On Economy 7 the pattern repeats: for 1 July to 30 September 2025 standard credit was £82 more for electricity alone than Direct Debit34, and for 1 April to 30 June 2025 Economy 7 prepayment was £25 less than Direct Debit35. Independent statistics put the average annual prepayment electricity bill at £987 in 2024, 10.84% less than standard credit8. Ofgem has also set out proposals to help ensure customers at risk of getting into debt are better supported4. More detail sits with prepayment versus direct debit satisfaction and costs.
Unit rates over time
Unit rates are the figure that matters when comparing the grid price with the cost of self-generated or stored energy. Ofgem stated that for 1 October to 31 December 2025, a standard variable customer paying by Direct Debit paid on average 26.35p per kWh for electricity across England, Scotland and Wales, including VAT6. For 1 January to 31 March 2026, guidance gives 27.69p per kWh for electricity with a 54.75p daily standing charge17; the same document carries a 5.93p per kWh figure alongside it, and the two are not reconciled.
Independent tracking of historic cap rates, rounded, gives the following picture for electricity and gas28:
| Cap period | Electricity (£/kWh) | Gas (£/kWh) |
|---|---|---|
| 1 April to 30 September 2022 | 0.28 | 0.07 |
| 1 October 2022 to 30 March 2023 | 0.34 | 0.10 |
| 1 July to 30 September 2024 | 0.22 | 0.05 |
| 1 October to 31 December 2024 | 0.24 | 0.06 |
| 1 April to 30 June 2025 | 0.27 | 0.07 |
| 1 October to 31 December 2025 | 0.26 | 0.06 |
During the Energy Price Guarantee, Great Britain averages including VAT for direct debit customers from 1 October to 31 December 2022 were 34.0p per kWh for electricity and a gas standing charge of 28.5p per day [12 note: see Sources]. The Welsh Government recorded that households on default tariffs paid by direct debit had seen a typical average household energy bill increase of £693 a year by June 202218.
For April to June 2026 the electricity unit rate is given as 24.67p10, and independent guidance quotes 26.11p per kWh for the July cap alongside a 57.19p daily standing charge28.
Who is covered and who is not
The cap applies to default tariffs regardless of payment method, and not to fixed, green or time of use tariffs17. Ofgem lists fixed tariffs, business energy contracts, heat networks and heating oil as outside it11. A fixed-rate tariff instead "protects you from changes in energy prices during the fixed term"13, which cuts both ways when the cap falls.
Heat network households sit outside the cap entirely, and in Northern Ireland both consumer protection and regulation of heat networks are devolved to the Northern Ireland Assembly36.
Northern Ireland: a separate market and a separate regulator
The Ofgem cap regulates suppliers in England, Wales and Scotland only37, and it "doesn't apply to households in Northern Ireland"37. Prices there are not set by Ofgem38; the Utility Regulator oversees the market, and its Code of Practice for Consumers in Vulnerable Circumstances applies to all electricity and gas suppliers, gas network operators (Evolve, firmus energy and Phoenix Energy) and also NIE Networks and NI Water39.
During the crisis the Energy Price Guarantee operated, for the most part, in the same way for households across the whole of the UK40, but energy prices were not capped in Northern Ireland and suppliers kept the flexibility to set their tariffs independently to reflect their costs of operating40. Instead a unit rate discount applied: from January 2023 to March 2023, up to 13.6p/kWh for electricity and 3.9p/kWh for gas40. Directions under the Energy Prices Act 2022 applied to Northern Ireland separately, and the gas direction did not apply to tariffs notified to a consumer before the effective date or taking effect after the scheme end date40. The schemes in Great Britain and Northern Ireland were intended for customers on domestic tariffs, with some non-domestic premises with similar metering and tariff arrangements in scope, including places of worship, some farms and small businesses operating from former dwelling-houses36.
Tracking prices there relies on different series. The Consumer Council's Home Energy Index tracks changes in household gas, electricity and home heating oil prices in Northern Ireland, recording gas and electricity tariffs every month and home heating oil prices every week from different suppliers41. Average prices recorded for Northern Ireland as at 1 November 2025 were 30.8p per kWh for standard rate electricity, 35p per kWh on-peak and 16.7p per kWh off-peak Economy 7, 9.0p per kWh for gas and 5.5p per kWh for oil42. For England, Scotland and Wales the standard electricity rate was given as 25.9p per kWh as at 1 September 202642. Households off the gas grid may be eligible to apply for home heating oil support in Northern Ireland43. See also housing stock and home energy data for Northern Ireland and heating oil and LPG price data.
What the price series means for household independence
The cap is a consumer protection, not a route to independence. It limits what a supplier may charge per unit and per day, and it is revised every quarter in response to wholesale, network and policy costs largely outside a household's control. Energy Saving Trust has responded to successive cap announcements as Ofgem confirms each change38, and the Centre for Sustainable Energy publishes the resulting per-unit figures7.
Three dependencies remain whatever a home does. First, the standing charge is paid every day even if no energy is used11, so a connection has a floor cost. Second, the cap is regional, so a home's exposure to network costs is fixed by its supply region and cannot be changed29. Third, the components that drove the crisis, chiefly wholesale gas, still set the majority of the unit price13. Reducing consumption and generating on site shifts the variable part of the bill; it does not exit the cap, the region or the standing charge.
For the underlying series behind these figures, see official energy statistics publications and the wider market data section, along with average household gas and electricity consumption statistics.
Sources43 cited
- Domestic energy prices, House of Commons Library, 2026-09-20
- Domestic energy prices briefing CBP-9714, House of Commons Library, 2026-08-28
- Analysis: cutting the green crap has added to UK energy bills, Carbon Brief, 2022-01-20
- Debate pack on energy prices, House of Commons Library, 2023-10
- Energy price cap will rise by 2% from October, Ofgem, 2025-08-27
- Changes to the energy price cap between 1 October and 31 December 2025, Ofgem, 2025-08-27
- Current gas and electricity prices, Centre for Sustainable Energy, 2026
- UK energy statistics, Uswitch, 2025-12-17
- Gas and electricity standing charges, Confused.com, 2026-07-01
- Grants and schemes, Smart Energy GB, 2026-05-28
- Energy price cap, Ofgem, 2026-09-17
- Spring Statement 2022, HM Treasury, 2022-03
- Getting the best deal on energy, Home Energy Scotland, 2026-09-20
- Energy price cap operating cost and debt allowances decision overview, Ofgem, 2025-05-23
- Energy price cap briefing CBP-9428, House of Commons Library, 2024-07
- What the Middle East conflict means for your energy bills, Which?, 2026-04-10
- Energy price cap explained, Welsh Government, 2026-03-04
- Written statement on fuel poverty, Welsh Government, 2026-02-26
- Energy price cap will rise 6.4% in April, Ofgem, 2025-02-25
- Changes to the energy price cap between 1 January and 31 March 2026, Ofgem, 2025-11-21
- Energy price cap levels, 1 July to 30 September 2026, Ofgem, 2026
- Cost of living payments and energy help, Age UK, 2026-09-10
- Summary of changes to the energy price cap, 1 October to 31 December 2025, Ofgem, 2025-08-27
- Understand your electricity and gas bills, Ofgem, 2026
- Electricity prices in Great Britain, House of Lords Library, 2026-06
- Standing charges briefing, House of Commons Library, 2026-09-17
- Energy standing charges, Uswitch, 2026-08-26
- Guide to kWh and historic cap rates, Uswitch, 2026-08-26
- Default tariff cap policy consultation overview, Ofgem, 2018-05-25
- Energy price cap levels, 1 October to 31 December 2025, Ofgem, 2025
- Charge restriction period 15b cap tables, Ofgem, 2025-11
- Benchmark maximum charges for charge restriction period 12b, Ofgem, 2024-05
- Default tariff cap letter, 1 April 2024, Ofgem, 2024-02-23
- Summary of changes to the energy price cap, 1 July to 30 September 2025, Ofgem, 2025
- Summary of changes to the energy price cap, 1 April to 30 June 2025, Ofgem, 2025
- Heat networks briefing, House of Commons Library, 2026-09-17
- Switching your energy supplier, Energy Saving Trust, 2026-06-26
- Energy price cap response, Energy Saving Trust, 2026-08-26
- Code of Practice for Consumers in Vulnerable Circumstances factsheet, Utility Regulator, 2025
- Energy Price Guarantee up until 30 June 2023, GOV.UK, 2026-09-17
- Home Energy Index, Consumer Council for Northern Ireland, 2026
- Our data, Energy Saving Trust, 2026-09-01
- Home heating oil support, nidirect, 2026-09-17
 Price Cap HistoryThe energy price cap sets the most a supplier can charge you for each unit of gas and electricity, so it shapes what you pay.
 Official Energy StatisticsWhere can you find the government's official figures on UK energy prices and how much gas and electricity the country uses?
 What Makes Up a BillBreaks a domestic energy bill into wholesale costs, network charges, policy levies, operating costs, supplier margin and VAT, with the share each takes and how those shares have moved since the energy crisis.
 The Full Energy Bills and the Price Cap GuideWondering why your bill went up even when you used less power?
 Typical Household FigureThe energy price cap limits unit rates and daily standing charges, not the total bill.
 Energy Price CapThe price cap sets the most you pay for each unit of gas and electricity, plus the daily standing charge, but not your total bill.