

In this guide
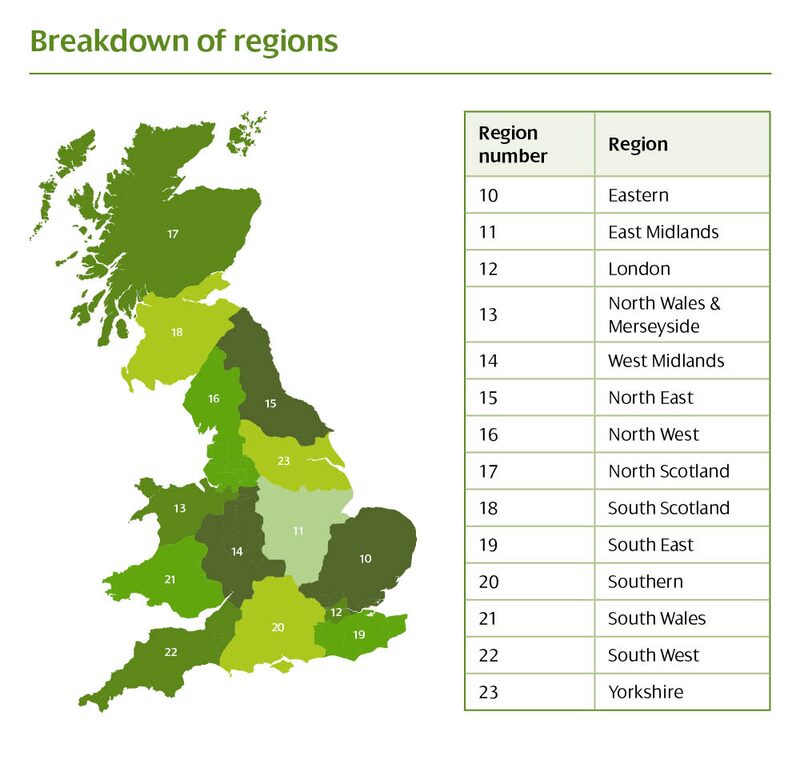
There is no single national price for electricity or gas in Great Britain. A separate price cap is set for each of the fourteen supply regions and applies throughout that region, with no breakdown below regional level1. The cap is set by Ofgem and limits the maximum a supplier may charge for each unit of energy on a default tariff, together with a limit on the daily standing charge2. It is a cap on rates, not on the total bill: a household that uses more pays more.
For the cap running from 1 July to 30 September 2026 the averages across Great Britain were 26.11p per kWh for electricity and 7.33p per kWh for gas, rising from 1 October 2026 to 26.32p and 7.97p3. Behind those averages the regional spread is wide. In the July to September period the electricity unit rate ran from 25.10p per kWh in the East Midlands to 27.66p per kWh in North Wales and Mersey, and the electricity standing charge from 44.78p a day in London to 70.76p a day in North Wales and Mersey4. Gas unit rates over the same period ranged from 7.19p per kWh in the East Midlands to 7.53p per kWh in Southern4.
The driver of the gap is not the cost of the energy itself, which is bought on national markets, but the cost of the local network that delivers it. Standing charges vary because of differences in local infrastructure costs, varying network distribution costs driven by geography and population density, and the cost of maintaining legacy infrastructure and systems5. A household cannot choose its region, and switching supplier does not change it.
Unit rates and standing charges: the two parts of every regional bill
Every capped bill is built from the same two components: the unit rate, which is how much is paid for each unit of gas or electricity used, and the standing charge, a fixed daily amount9. Both are capped, and both are set regionally. Anything described as an average national rate is a weighted figure that no individual household is actually charged.
There can be more than one unit rate on a bill, for example day, night and weekend rates11. Electricity rates are either a single unit rate or a dual rate providing two meter readings, usually called Economy 711. The cap reflects this: the regional tables carry separate columns for a single rate metering arrangement and a multi register metering arrangement, each with its own benchmark consumption and its own annual figure.
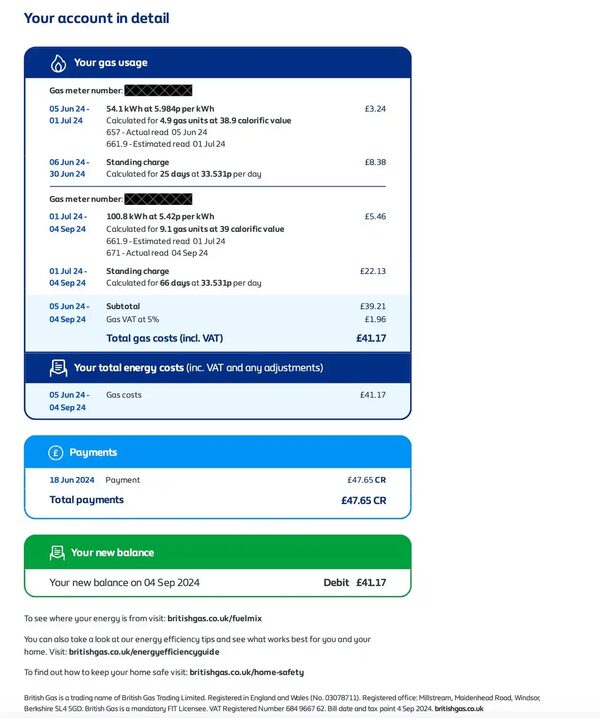
A bill should identify the tariff for each fuel, the price per unit and any standing charge12. Checking the tariff means reading four numbers, not one: the electricity unit rate, the electricity standing charge, the gas unit rate and the gas standing charge. More detail on how those lines appear is in the guide to reading an energy bill.
For independence, the split matters. The unit rate is the part a household can act on, through insulation, efficiency, solar generation or shifting use. The standing charge is not avoidable while the connection exists: it is paid every day even if no energy is used on that day13. A home that halves its consumption halves only one of the two components.

Standing charges: from 44.78p a day in London to 70.76p in North Wales and Mersey
Electricity standing charges show the widest regional spread of any line on the bill. For 1 July to 30 September 2026 the average was 57.19p a day, about £208.74 a year3. The regional figures for that period ran as follows.
| Region | Electricity standing charge, 1 Jul to 30 Sep 2026 | Electricity unit rate, same period |
|---|---|---|
| London | 44.78p a day | 26.35p per kWh |
| North West | 47.61p a day | 26.13p per kWh |
| Southern | 49.70p a day | 26.42p per kWh |
| South East | 54.45p a day | 26.67p per kWh |
| Northern Scotland | 57.55p a day | not stated for this period |
| South Wales | 57.84p a day | not stated for this period |
| Northern | 64.29p a day | 25.22p per kWh |
| North Wales and Mersey | 70.76p a day | 27.66p per kWh |
Figures from regional price cap tables for the July to September 2026 period4.
The gap between the lowest and highest standing charge in that table is 25.98p a day, the difference between 70.76p and 44.78p. Charges move each quarter: by the October to December 2026 period North Wales and Mersey had fallen to 67.66p a day, South Wales to 55.41p, the West Midlands stood at 57.23p, the East Midlands at 51.45p and North Western England at 45.68p14.
Published figures for the same region do not always match. London's electricity standing charge appears as 44.78p a day in one regional table and as 44.83p a day in another guidance page6. The national average is similarly unsettled: 57.19p a day for July to September 2026 sits alongside a reported 54.83p average for October to December 2026, while a further figure of 57.21p a day, or £209 a year, is also in circulation, and one page quotes a current cap of 60.97p for electricity and 31.65p for gas without naming the period15. Small differences of this kind reflect different reading dates, payment methods and VAT treatments rather than different rules, so the figure printed on the bill for the named region and period is the operative one. The wider argument about these charges is covered in standing charge reform.
Why the regions differ: distribution costs, density and legacy networks
Standing charges recover the fixed costs of providing a property with gas and electricity, including network connection, meter reading, maintenance and government initiatives6. Those costs are incurred locally, by the distribution network that owns the wires in a given area, and they differ sharply. Charges vary significantly across Great Britain primarily because of differences in network costs influenced by population density and terrain16. A long rural network serving few customers spreads its fixed cost over a small base; a dense city network does not.
The same three factors appear in independent analysis of why the charges differ: differences in local infrastructure costs, varying network distribution costs driven by geography and population density, and the cost of maintaining legacy infrastructure and systems5. This is why some regions, such as Merseyside and North Wales, pay substantially more than others such as London15, and why there are regional variations with some areas in Great Britain paying much more than others17.
The historic justification is now contested. The Energy Saving Trust has argued that the picture has changed, with more renewable energy being generated regionally and locally, removing the argument that standing charges need to be higher in regions such as Scotland to accommodate higher distribution costs5. That is a position in a live consultation, not a rule.
"historically the North of Scotland has paid higher standing charges and unit costs on the basis that the transmission and distribution costs in that area are higher"
For a household the practical consequence is blunt: the network component of the bill is set by postcode and cannot be shopped around. Reducing exposure to it means reducing the days or the units on which it is levied, and the standing charge element persists regardless. See why is the standing charge so high for the detail of that argument.
Why Northern Scotland pays more: distribution costs and the AAHEDC levy
North Scotland has some of the highest electricity distribution costs in Great Britain, reflecting the terrain and the population spread it serves14. Its electricity standing charge was 57.55p a day for July to September 2026, above the 57.19p national average for that period, and its unit rate was 26.35p per kWh for October to December 202614. Local unit rates and standing charges for electricity in the Northern Scotland region can differ from other regions across Great Britain18.
To limit the effect, a levy spreads part of the burden nationally. Assistance for Areas with High Electricity Distribution Costs supports electricity distribution costs in Northern Scotland, raises £40 million annually and adds about £1.14 to the typical household's annual electricity bill7. Expressed per unit it has been put at 0.04p per kWh19, and a supplier price list gives the AAHEDC unit rate as 0.046 pence per kWh from 1 January 2026 and 0.048 pence per kWh from 1 April 2026, so the published figures differ slightly by date20. Rounded to the nearest pound, one analysis of levies including VAT lists it at £1 on domestic bills19.
Across the nations, the aggregate difference is smaller than the regional spread within England suggests. Scotland's electricity bills have been reported at 0.47% higher than England and Wales and 0.85% higher than Northern Ireland, described as a negligible difference between nations21. Northern Ireland sits outside the Great Britain cap entirely and is covered separately in energy bills in Northern Ireland.
Ofgem's own regional tables show the ordering. For 1 July to 30 September 2025, the Northern Scotland electricity cap at 3,100 kWh a year on a single rate meter was £1,036.56 under the second payment method table and £941.40 under the third, with the multi register figure at 4,200 kWh reaching £1,189.05 under the first table22. Under an earlier charge restriction period the Northern Scotland multi register annual figures at 4,200 kWh were £1,234.55 and £1,142.19 across two of the tables, the spread reflecting the payment method rather than any change in the region's costs23.
Gas unit rates by region: 7.19p per kWh in the East Midlands and above
Gas rates vary by region too, but far less than electricity. For 1 July to 30 September 2026 the East Midlands was the cheapest gas region at 7.19p per kWh and Southern the most expensive at 7.53p per kWh, a spread of 0.34p, the difference between 7.53p and 7.19p4. The Midlands stood at 7.27p and the South East at 7.39p over the same period14. By October to December 2026 the West Midlands was 7.90p, Eastern England 7.91p and North Eastern England 7.92p, against a national average of 7.97p per kWh14. A tariff tracker also places the East Midlands cheapest but at 7.34p per kWh, a higher figure than the 7.19p quoted elsewhere for the same region24.
Gas standing charges are lower than electricity standing charges: North Wales and Mersey was 29.42p a day for July to September 2026 and 30.08p for October to December14.
Ofgem's benchmark tables for 1 July to 30 September 2026 set out gas maximum charges by region at 9,500 kWh a year on the other payment method basis. All values in those tables are exclusive of VAT, which suppliers then apply to bills25.
| Region | Annual standing charge | Annual bill at 9,500 kWh |
|---|---|---|
| East Midlands | £100.04 | £750.33 |
| North West | £101.39 | £756.14 |
| Eastern | £99.78 | £756.61 |
| South East | £99.53 | £767.86 |
| N Wales and Mersey | £102.26 | £760.71 |
| London | £102.62 | £781.21 |
Gas benchmark maximum charges, other payment method, 1 July to 30 September 2026, excluding VAT25.
The narrower spread on gas reflects the gas network's different cost structure. It also means that, for a household weighing gas against electric heating, the regional lottery falls mainly on the electricity side. The per unit comparison itself is set out in is gas cheaper than electricity per kWh.
How payment method changes the rate
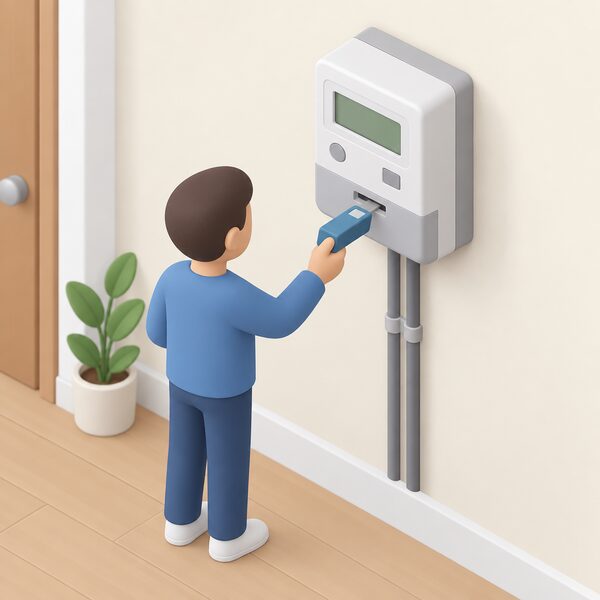
Region is one axis; payment method is the other. Rates and standing charges vary by region, payment method and meter type26. Most suppliers offer a cheaper rate for direct debit, and a prepayment meter or payment on receipt of the bill may carry a slightly higher unit rate27.
The position on prepayment has changed. Since February 2024 those prepaying for electricity and gas have paid slightly less for each unit than those on standard credit meters28. Prepayment unit rates are also slightly lower than direct debit rates, though the standing charges are the same29. For the cap from 1 October to 31 December 2026 the average prepayment electricity unit rate was reported at 25.52p per kWh30, against the 26.32p direct debit average for that quarter3; for July to September 2026 a prepayment rate of 25.32p per kWh was quoted31. In the Midlands from 1 January 2026 the prepayment electricity unit rate cap rose by 1.29p to 26.15p32.
Ofgem's own figure for a standard variable tariff paid by direct debit, announced in November 2025, was 27.69p per kWh averaged across England, Scotland and Wales, including VAT at 5%33.
The regional tables are published as separate blocks for each payment method. Charge restriction period 12b shows the pattern for the East Midlands34:
| East Midlands, period 12b | Single rate, 3,100 kWh | Multi register, 4,200 kWh |
|---|---|---|
| Standard credit | £887.39 | £1,072.11 |
| Other payment method | not stated | £1,008.59 |
| Prepayment | £811.19 | £985.17 |
The prepayment nil consumption figure in that table, the annual standing charge alone, was £194.7334. Comparisons between the methods are set out in price cap rates by payment method.
Benchmark maximum charges: the regional tables behind the cap
The cap is published not as a list of pence per kWh but as benchmark maximum charges: for each region and payment method, an annual figure at nil consumption and an annual figure at a set benchmark volume. The nil consumption figure is the standing charge for a year. The difference between the two is what the benchmark volume of energy costs at the capped unit rate.
For 1 July to 30 September 2026 the electricity tables use 2,500 kWh single rate and 3,400 kWh multi register25:
| Region and table | Single rate: standing charge / 2,500 kWh | Multi rate: standing charge / 3,400 kWh |
|---|---|---|
| N Wales and Mersey, first table | £245.97 / £904.48 | £243.13 / £1,079.21 |
| N Wales and Mersey, second table | £276.80 / £971.97 | £276.53 / £1,158.77 |
| N Wales and Mersey, third table | £245.97 / £884.59 | £243.13 / £1,053.89 |
| South Wales, first table | £201.07 / £828.06 | £197.56 / £996.34 |
| North West, first table | £165.50 / £787.60 | £163.01 / £952.88 |
| Yorkshire, first table | £223.79 / £826.29 | £221.43 / £992.07 |
Electricity benchmark maximum charges, 1 July to 30 September 2026, excluding VAT25.
The benchmark volumes have changed over time, which is why older tables are not directly comparable. Ofgem's benchmark review set the single rate electricity benchmark at 2,700 kWh a year from 1 January 202635. Earlier tables used 3,100 kWh single rate and 4,200 kWh multi register: for 1 April 2024 to 30 June 2024 the single rate annual figures included £919.15 for Eastern, £944.54 for the South East and £906.15 for the North West, with multi register figures of £1,097.46 for the East Midlands, £1,134.83 for Northern and £1,154.60 for Southern36. In charge restriction period 14a the North Wales and Mersey single rate figures were £241.73 standing charge with £1,083.17 annual in the first table and £263.66 with £1,149.42 in the second37. For 1 October to 31 December 2025 the standard credit figures for N Wales and Mersey were £272.95 at nil consumption and £1,136.66 at 3,100 kWh single rate, with £272.72 and £1,386.93 on multi register38.
Because the annual figures are keyed to a benchmark volume, they are not a prediction of any household's bill. That distinction is explained further in what the price cap typical household figure actually means.
The regional structure long predates the current cap. The Energy Price Guarantee published maximum rates by region and payment method in the same shape: for April to June 2023 the East Midlands rates excluding VAT were 30.86p per kWh electricity and 9.70p gas on other payment methods, 29.77p and 9.93p on prepayment, and 33.38p and 10.33p on standard credit, with the Midlands at 31.25p and 9.75p, 30.15p and 9.95p, and 33.80p and 10.38p respectively39. That closed scheme is described in the Energy Price Guarantee.
Tariffs with no standing charge, and what they trade away
Tariffs exist under which energy is paid for by the unit with no standing charge40. They do not remove the network cost, they relocate it. Such tariffs typically charge higher unit rates for gas and electricity, which could result in higher bills41, and the rates charged per kWh on them are often higher per unit of energy used40. One structure applies a much higher unit rate to the first two units of gas and electricity used each day, then a lower, more normal rate for everything after that17.
For a very low user, particularly one generating on site, the arithmetic can differ from a standard tariff; for a typical user it generally does not. The comparison is worked through in no standing charge tariffs.
VAT on household electricity: the temporary reduction and its planned end
VAT on domestic electricity was temporarily reduced from 5% to 0%, applying to all tariffs including fixed deals42. The zero rate runs from 1 October 2026 to 31 March 20278. A supplier estimate puts the average saving at £45 a year for households in Great Britain43.
The end date is set in legislation rather than left open. The zero rate will be replaced with the reduced rate after 31 March 2027 across the whole of the United Kingdom unless the position is changed44, with the reduced rate applying from 1 April 202745. Citizens Advice states that standard 5% VAT applies again from 1 April 20278.
Two points follow for anyone reading a regional rate. First, Ofgem's benchmark tables are published exclusive of VAT, which suppliers apply to bills25, while most consumer summaries of regional rates quote figures including VAT at 5%: comparing the two directly will not reconcile. Second, during the zero rate period the pence per kWh on a bill falls without any change in the underlying capped charge, and it returns when the relief lapses. The VAT treatment of energy is set out in how much VAT is charged on energy bills.
What the regional picture means for energy independence
Region is the one variable on an energy bill that a household cannot negotiate, switch away from or opt out of. Supplier, tariff, payment method and consumption are all open to change; the distribution network serving the postcode is not. A household in North Wales and Mersey paying 70.76p a day in standing charge for the July to September 2026 period was paying 25.98p a day more than one in London for the identical service, before a single unit was used4.
That shapes what self supply can and cannot achieve. On site generation and efficiency reduce the units bought and therefore the unit rate portion of the bill, which in gas terms for July to September 2026 was between 7.19p and 7.53p per kWh and in electricity terms between 25.10p and 27.66p per kWh4. They do not reduce the standing charge, which is charged every day the property has an energy connection13. Full independence from the standing charge means disconnection, with all that implies. Short of that, the dependence on the network, on the supplier's billing and on Ofgem's quarterly recalculation remains. The wider question is taken up in energy bills and energy independence, and the full structure of the cap in the guide to energy bills and the price cap.
Sources45 cited
- Energy price cap research briefing, House of Commons Library, 2026-09-20
- Energy price cap, Ofgem, 2026-09-17
- Average gas and electricity bills in the UK, Uswitch, 2026-08-26
- Regional UK energy prices, Confused.com, 2026-07-01
- Response on standing charges, Energy Saving Trust, 2025-09-30
- Guide to energy standing charges, Uswitch, 2026-08-26
- Household energy bills and green levies, Nesta, 2026-09-20
- Grants and benefits to help pay energy bills, Citizens Advice, 2026-09-17
- How to check your energy tariff, British Gas Energy Trust, 2026-07-30
- Understanding energy bills, StepChange, 2026-09-20
- Understanding your gas or electricity bill, Centre for Sustainable Energy, 2026-02
- How to understand your energy bill, Energy Saving Trust, 2024-11-08
- Check if you are owed money on your energy bill, Ofgem, 2026
- Regional energy prices, Uswitch, 2026
- Ofgem price cap, End Fuel Poverty Coalition, 2026-08-26
- Cheapest standing charge electricity in the UK, Fuse Energy, 2026-07-07
- Standing charges, National Energy Action, 2026-04-28
- Solar panel installation in Inverness, Fuse Energy, 2026-09-16
- Cheaper electricity, fairer bills, Nesta, 2024-12-04
- Flexi 2026 charges, ScottishPower, 2026
- Energy statistics, Uswitch, 2025-12-17
- Energy price cap levels, 1 July to 30 September 2025, Ofgem, 2025
- Benchmark maximum charges, charge restriction period 13a, Ofgem, 2025
- Tariff watch, End Fuel Poverty Coalition, 2026-09-20
- Energy price cap levels, 1 July to 30 September 2026, Ofgem, 2026
- Average gas and electricity bills, Hive, 2025-12-17
- How to calculate an electricity bill, EcoFlow, 2025-04-08
- Should I get a no standing charge tariff?, Uswitch, 2026-08-26
- Energy price cap will rise in April, Which?, 2025-02-27
- Is a prepayment energy meter right for you?, Which?, 2026-10-01
- Prepayment meters guide, Uswitch, 2026
- January 2026 price cap, Act on Energy, 2026-01-01
- Changes to the energy price cap, 1 January to 31 March 2026, Ofgem, 2025-11-21
- Benchmark maximum charges, charge restriction period 12b, Ofgem, 2024-05
- Energy price cap benchmark review decision, Ofgem, 2026-01-01
- Default tariff cap level, 1 April to 30 June 2024, Ofgem, 2024
- Benchmark maximum charges, charge restriction period 14a, Ofgem, 2025-02
- Energy price cap levels, 1 October to 31 December 2025, Ofgem, 2025
- Energy Price Guarantee regional rates, April to June 2023, GOV.UK, 2026-09-17
- Types of energy tariff, Confused.com, 2025-11-03
- Standing charges research briefing, House of Commons Library, 2026-09-17
- Cost of living payments and energy help, Age UK, 2026-09-10
- Energy bill savings in 2026, Fuse Energy, 2026-06-25
- Explanatory memorandum on VAT rates, legislation.gov.uk, 2026-09-17
- VAT order explanatory note, legislation.gov.uk, 2026-09-17
 Wholesale Energy MarketsGas and electricity prices are set by several markets, and gas often decides the electricity price even when wind is blowing.
 Regional Energy ConsumptionHow much gas and electricity does your area use compared with the rest of the country?
 Wholesale Prices and BillsGas prices around the world keep changing, so why do your bills move so slowly, and why does gas still set what you pay for electricity?
 UK Energy Prices vs EuropeWhy does the UK pay so much for electricity when our gas is cheaper than most of Europe?
 The Full Rules and Regulation GuideConfused about who actually decides what you pay for gas and electricity, or why rules differ in Scotland and Wales?
 The Full Energy Bills and the Price Cap GuideWondering why your bill went up even when you used less power?