
In this guide
Household energy bills are going up because the wholesale cost of gas is going up. The recent rise in energy bills is due to the rising cost of gas around the world1, and of the increase in bills since before the energy crisis, 54% is accounted for by higher wholesale prices, compared with 20% from network charges and 6% from so-called green levies2. From 1 October 2026 the Ofgem price cap rises 4%, from £1,663 to £1,723 a year for an average household on a standard tariff paying by direct debit3: an increase of £60 on those two figures.
The shape of that rise tells the story. Gas unit rates are rising from 6.29p per kWh last winter to 8p from 1 October 2026, up around 27% year on year and the highest on record in cash terms, while electricity unit rates are being held roughly stable, helped by the Government cutting VAT on electricity4. The cap is not a cap on a bill. It limits the unit rate and the daily standing charge only. Ofgem is explicit: "It does not limit the cost of your total bill. The more energy you use, the higher your bill will be."5
Wholesale prices reach bills slowly and unevenly because the cap is recalculated only every three months, using an observation window that closed weeks before the rates take effect, and because suppliers buy energy ahead of delivery. A fall in the gas market this week does not appear in a standard variable rate this quarter. That lag cuts both ways: it damped the worst of the 2022 spike and it delays relief when markets ease.
Gas sets the price, for gas and for electricity
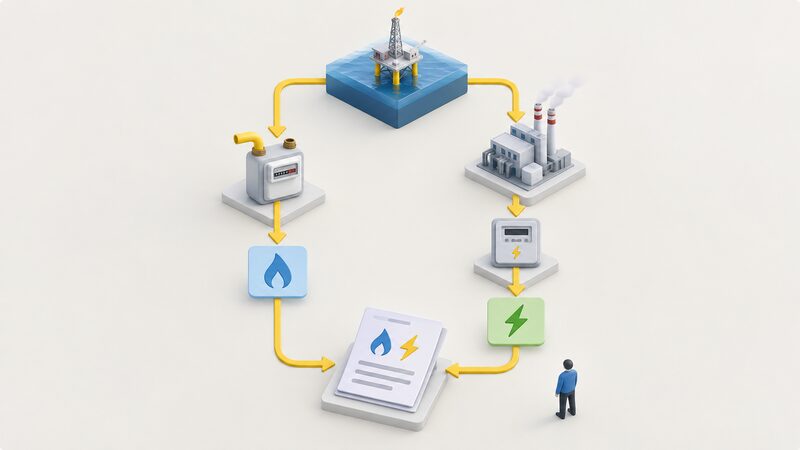
Gas is bought and sold on a global market, and the price cap moves with it. The rise in the cap is overwhelmingly caused by the increase in wholesale costs of energy, primarily the cost of gas6. The October 2026 cap rose as a result of ongoing volatility in wholesale gas markets6, with wholesale gas prices recently reaching a three-year high and further bill rises expected in January7. For the July 2026 cap, the gas wholesale price used in setting the cap rose by 50%8.
This is not new. During the crisis, the wholesale price of gas drove about 90% of the increase in bills9. Ofgem recorded a record increase in global gas prices over six months, with wholesale prices quadrupling in a year10, and by December 2021 weekly average wholesale gas prices had risen to nearly six-fold the level of February 202111.
The phrase in that Ofgem document matters for electricity as much as gas: wholesale gas prices, "to which electricity prices are closely linked"11. Gas-fired generation frequently sets the marginal price in the wholesale electricity market, so a gas price shock is an electricity price shock. That is why a household that has already switched from gas heating to electric heating is not insulated from the gas market: it is exposed through a different meter. The consequence shows in unit prices. Electricity in Great Britain has typically been three to five times more expensive per unit than gas12, and is currently around four times the price of gas4.
"network charges and 'green levies' account for 20% and 6% of the rise since pre-crisis levels, respectively"
Since 2021, some £63 has been added to bills as a result of rising network charges and another £18 from green levies2. Those are real and growing, and network costs were expected to push the April 2026 cap up, but they are not the main engine. The main engine is a commodity price set outside the UK.
What the price cap limits, and what it leaves open
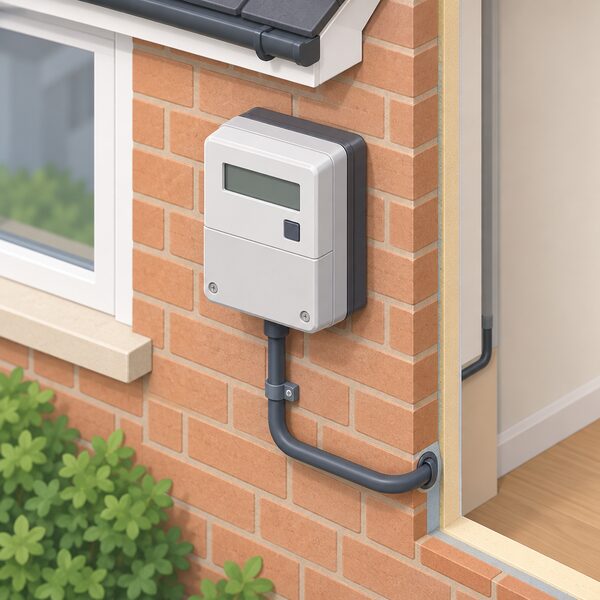
The cap is set by Ofgem and limits how much a supplier can charge for each unit of electricity and gas used1. It also limits the daily standing charge. It does not limit the total bill5. The headline annual figure is a modelled illustration for a household with typical consumption paying by direct debit, not a ceiling on any individual account.
Two practical consequences follow. First, as a result of a unit rate increase, the higher the consumption in a household, the bigger the increase in the annual bill13. A large, poorly insulated, gas-heated house sees a far larger cash rise from the same percentage move than a small flat. Second, the cap says nothing about how much a supplier collects by direct debit in a given month: payments can rise simply because a household is using more energy than the supplier expected.
The cap was introduced on 1 January 2019 under the Domestic Gas and Electricity (Tariff Cap) Act14. It has always been a cap on default tariff rates, not a subsidy and not a guarantee of affordability. More on the illustration itself is covered in what the price cap 'typical household' figure means and in why a bill can be higher than the cap figure.
The cap level: £1,723 from 1 October 2026
| Cap period | Level, typical household, direct debit |
|---|---|
| 1 October to 31 December 2024 | £1,71715 |
| 1 October to 31 December 2025 | £1,755, 2.2% higher than the same period a year earlier16 |
| 1 October to 31 December 2026 | £1,723, up 4% from £1,6633 |
The October 2026 level sits below the October 2025 level of £1,75516 but above October 2024's £1,71715, which the National Audit Office noted was already higher than pre-crisis levels15. The path since 2019 has been anything but smooth: rapid increases in wholesale energy prices from mid-2021 onwards led to a 54% increase in the cap in April 202217.
Within the latest reset the composition has shifted sharply. Gas unit rates rose 8.7% and gas standing charges 2.2% between the July and October 2026 caps, while electricity unit rates rose 0.8% (up 0.21p per kWh) and electricity standing charges fell 4.1% (down 2.36p a day)4. A household heating with gas therefore feels this rise considerably more than an all-electric one. Ofgem is also altering the definition of an "average" household4, which affects the headline figure without changing anyone's rates. The full sequence of levels is set out in price cap history and announcement dates.
How a bill is built up: unit rate plus standing charge
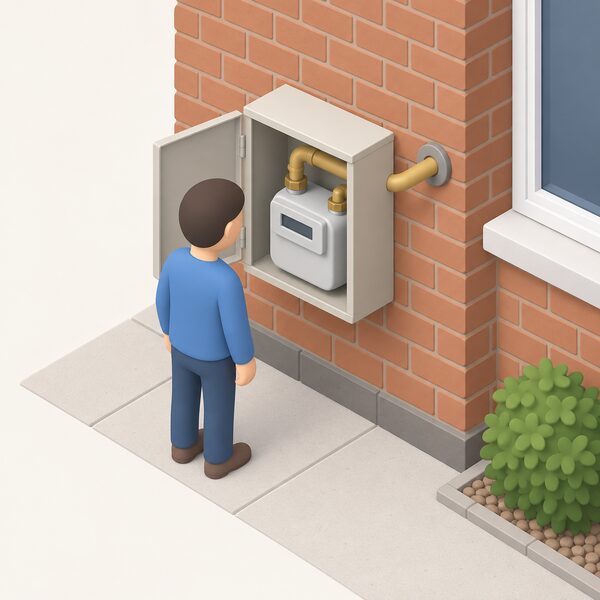
Every capped bill has one charging structure made up of a standing charge and the unit prices of gas and electricity18. The standing charge appears as a daily rate, with separate figures for each fuel, and covers the fixed costs of supplying the property: network connection, meter reading, maintenance and government obligated programmes19.
The standing charge has grown for reasons largely unconnected to the gas market. As well as infrastructure and obligated programmes, much of the rise has paid for the cost of transferring customers of failed energy suppliers to new suppliers, and it reflects a conscious decision from Ofgem on how to pay for energy networks20. That is why standing charges did not fall when wholesale prices fell.
Tariffs advertised with no standing charge do not remove the fixed costs. They charge a much higher unit rate for the first two units of gas and electricity used each day, then a lower rate thereafter20, and generally carry higher unit rates that can result in higher bills overall13. Low-use households may gain, high-use households usually do not. See standing charges and no standing charge tariffs.
Quarterly resets, the lag, and why relief arrives late
The cap is recalculated every three months. Ofgem moved from setting the cap every six months to every quarter in summer 2022, in response to high and volatile wholesale prices21. Quarterly resets pass market falls through faster than six-monthly ones did, but they also pass rises through faster, and they do not remove the delay.
The delay has three parts. The wholesale allowance is built from observed forward prices over a window that ends before the announcement. The announcement itself comes weeks before the rates apply: the October 2026 level was announced in late August 20263. And the resulting rate then runs for a full quarter regardless of what markets do inside it. A household on a standard variable tariff is, in effect, paying a price derived from a market that has already moved on.
For most people the change is felt later still, because it reaches them through a revised bill or a revised direct debit rather than on the day itself. A rise in the cap starts being reflected in revised bills only once suppliers reissue them.
Fourteen regional caps, and Northern Ireland outside them
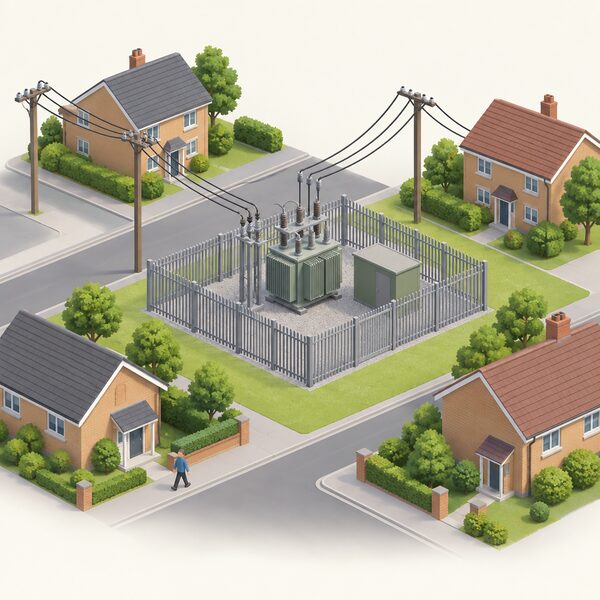
A separate price cap is set for each of the 14 regions and applies throughout the region, with no breakdown below regional level11. Regional differences follow the cost of each distribution network, so some regions, such as Merseyside and North Wales, pay substantially more than others, such as London4.
The scale is visible in published regional rates. For January to March 2026, the direct debit single-rate electricity unit rate was 27.83p per kWh in southern Scotland and 28.36p per kWh in northern Scotland12. In South Wales, cap rates of 26.33p per kWh with a 57.84p daily standing charge were recorded for a single-rate meter in September 202622.
Northern Ireland has a separate energy market and is not covered by the Great Britain default tariff cap: Ofgem's October to December 2025 level applied to typical households in England, Scotland and Wales16. Households there should read energy bills in Northern Ireland. Regional detail for Great Britain is in electricity and gas unit rates by region.
Who is covered and who is not
The cap protects people on standard variable tariffs, where the unit rate can go up or down depending on the energy market5. It applies where a customer has not signed up to a fixed-term contract11, and covers people on standard plans whether they pay by direct debit, on receipt of a bill, or through a prepayment meter.
- Covered: around 20 million households in Great Britain on variable tariffs, including 5 million prepayment meter customers and 3 million standard credit customers4.
- Not covered: fixed-term tariffs. Ofgem's guidance states, "Your prices will not be protected by the caps if you have chosen to be on a fixed-term energy tariff."23 Around 11 million households in Great Britain hold fixed deals4.
- Not covered: business energy customers. "Business energy customers are not protected by the energy price cap."24
- Not covered: heat networks, and heating oil5.
Around 60% of households are on rates set by the cap because they have not moved to fixed deals25.
Heating oil and LPG: no cap at all
Heating oil prices are not regulated by Ofgem and are not covered by the energy price cap26. Trading Standards has warned that heating oil is not covered by Ofgem's energy price cap, "leaving consumers fully exposed to sudden market increases"27. Households using heating oil and LPG sit outside the cap and have no equivalent protection when global prices spike28.
This matters disproportionately to rural homes off the gas grid, which are the same homes that typically have the fewest tariff choices. A spike in crude prices arrives at the tank in days, not at the next quarterly reset. Nothing in the cap mechanism dampens it, and there is no regulated maximum unit price for a delivery.
Fixed tariffs, prepayment and how payment method changes the price
A fixed-rate tariff locks in the price per unit of energy, protecting the household from increases in energy prices29. The unit cost and the daily fee are fixed; the amount charged still depends on how much energy is used, so bills still vary month to month. A fix is also not protected by the cap, so a rate agreed above the cap stays above it when the cap falls.
Prepayment tariffs are capped by Ofgem, so they cannot charge more than a specified unit rate, with the cap calculated and updated once every three months30. Historically, prepayment meter consumers faced higher energy costs than those paying by direct debit31. That premium has been addressed: the cost premium associated with paying by prepayment, as opposed to direct debit, was removed through the Ofgem price cap32, and one market analysis found that as of June 2026 prepayment customers were paying less for both gas and electricity than direct debit customers33. Some older guidance still describes prepayment as one of the most expensive types of deal, reflecting the position before levelisation.
The remaining penalty falls elsewhere: customers paying by standard credit, that is by cash, cheque or bank transfer, are hit with a significant price premium4. Comparisons are set out in price cap rates by payment method and standard credit vs direct debit.
VAT, levies and policy costs
Ofgem sets out the components used to calculate capped bills: wholesale costs, network costs, operating, debt and industry costs, earnings before interest and tax, policy costs, and VAT18. Domestic energy has carried VAT at 5% on both gas and electricity34. From 1 October 2026 electricity unit rates are being held roughly stable, helped by the Government cutting VAT on electricity4.
Policy costs are the smallest of the three commonly blamed elements: green levies account for 6% of the rise in bills since before the crisis, against 20% for network charges and 54% for wholesale prices2. Costs move between the standing charge and the unit rate as policy changes: government modelling of Warm Home Discount cost recovery found that a gas-heated house with high demand due to medical needs could see its annual energy bill increase by around £29 under the move to the unit rate in isolation, while approximately £195 of net costs were removed from bills when Budget 2025 measures were accounted for35. See policy costs and levies on energy bills and what makes up a UK energy bill.
What this means for household energy independence
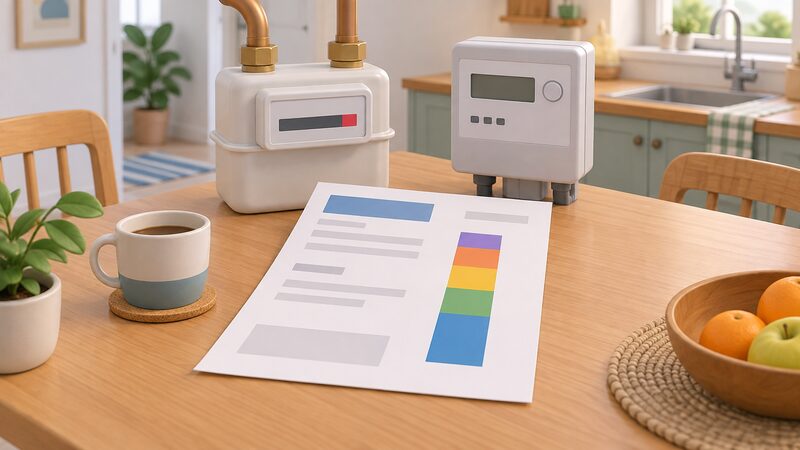
The honest summary is that the cap regulates a price, it does not reduce exposure. A household on a capped variable tariff is fully exposed to the international gas market, with a delay of a quarter and a smoothing effect, and that exposure reaches both fuels because gas-fired generation sets the electricity price. Fixing a tariff transfers the timing risk to the supplier for a term, at a price the supplier chooses; it does not sever the link. Prepayment, standard credit and direct debit change what is paid, not what is bought.
Real independence changes the quantity, not the rate. Because the higher the consumption, the bigger the cash effect of any unit rate increase13, the only durable protection against wholesale volatility is using fewer units: fabric efficiency first, then on-site generation and storage. Solar Energy Scotland's framing is blunt on the national version of the same point: more homegrown energy means greater energy independence36.
Dependencies that remain, whatever a household does:
- The standing charge. It is paid regardless of consumption, it covers network and legacy supplier-failure costs, and generating your own power does not avoid it while the property stays connected20.
- The network. A grid-connected home pays distribution costs that account for 20% of the bill rise since before the crisis2.
- A supplier relationship, and with it a billing system, a direct debit and, for most, a smart meter.
- The gas market, for any home still heating with gas, and indirectly for electricity.
- No protection at all for heating oil and LPG users, who sit outside the cap entirely28.
Government bill support grants issued during the crisis have all ended, which means current bills may have increased significantly compared to a few years ago37. There is no scheme in place holding rates below the cap. For where the money actually goes in a typical home, see reducing an energy bill and energy bills and energy independence; for the wider picture, the pillar guide at /bills-price-cap/.
Sources37 cited
- What role National Grid plays in your energy bill, National Grid, 2026-09-17
- Electricity prices in Great Britain, House of Lords Library, 2026-06
- Two weeks to avoid the 1 October energy price hike, Uswitch, 2026-09-16
- The Ofgem price cap explained, End Fuel Poverty Coalition, 2026-08-26
- Energy price cap, Ofgem, 2026-09-17
- Explaining the October 2026 price cap, Energy UK, 2026-08-26
- Comment on the Ofgem energy price cap, Energy and Climate Intelligence Unit, 2026-08-26
- Price cap: conflict set to add to household bills from July, Energy and Climate Intelligence Unit, 2026
- Net zero: solution to the gas crisis, Energy UK, 2022-10-27
- Decision on updating the default tariff cap methodology, Ofgem, 2022-02-04
- Domestic energy prices briefing, House of Commons Library, 2026-09-20
- Balancing investment in clean heat and energy efficiency in Scottish housing retrofit, ClimateXChange, 2026-01
- Should I get a no standing charge tariff?, Uswitch, 2026-08-26
- Energy price cap review of historical debt-related costs, Ofgem, 2026-03-25
- Energy bills support: an update, National Audit Office, 2024-11-14
- Changes to the energy price cap between 1 October and 31 December 2025, Ofgem, 2025
- Domestic energy prices, House of Commons Library, 2026-08-28
- How your electricity or gas bill is calculated, Ofgem, 2026
- Energy standing charges explained, Uswitch, 2026-08-26
- Standing charges, National Energy Action, 2026-04-28
- Energy price cap methodology: backwardation deadband decision, Ofgem, 2025-11-21
- Economy 7 tariffs and rates, Uswitch, 2026-09-08
- Price caps explained, Ofgem, 2018-12
- Guidance for alternative homes and energy, Ofgem, 2026
- Price cap impact on July energy bills, Uswitch, 2026-05-19
- Heating oil prices briefing, House of Commons Library, 2026-09-20
- Cost of living pressures expose gaps in bulk fuel checks, Chartered Trading Standards Institute, 2026-03-16
- Heating oil and LPG customers to get additional support, End Fuel Poverty Coalition, 2026-04-21
- Fixed rate tariffs and switching, Home Energy Scotland, 2024-02
- Energy tariffs explained, Uswitch, 2026-02-17
- Prepayment levelisation: a guide to the scheme, Retail Energy Code Company, 2026-01-27
- Forced prepayment meter transfer, End Fuel Poverty Coalition, 2026-01-08
- Regional UK energy prices, Confused.com, 2026-06
- What's in an energy bill: other components and VAT, Nesta, 2024-11-22
- Warm Home Discount cost recovery: government response, GOV.UK, 2026-04-02
- Solar Energy Scotland manifesto, Solar Energy UK, 2026-09-17
- Understand your electricity and gas bills, Ofgem, 2025-04-24
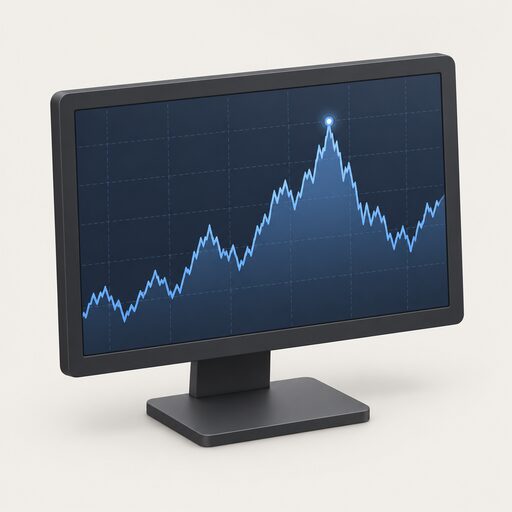 Wholesale Energy MarketsGas and electricity prices are set by several markets, and gas often decides the electricity price even when wind is blowing.
 The Full Energy Bills and the Price Cap GuideWondering why your bill went up even when you used less power?
 Energy Price CapThe price cap sets the most you pay for each unit of gas and electricity, plus the daily standing charge, but not your total bill.
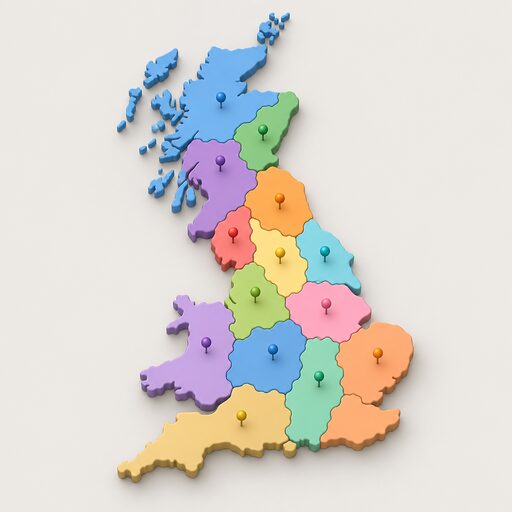 Unit Rates by RegionWhy do electricity and gas prices differ depending on where you live?
 Standing ChargesWhy is there a daily charge on a gas or electricity bill even when nothing is used, and what does it actually pay for?
 Price Cap HistoryThe energy price cap sets the most a supplier can charge you for each unit of gas and electricity, so it shapes what you pay.