

In this guide
The energy price cap does not set one number for every household. Ofgem sets a separate level for each payment method, so a direct debit customer, a prepayment customer and a standard credit customer on the same default tariff face different maximum unit rates and different maximum daily standing charges. For the cap period running from 1 October to 31 December 2025, the direct debit level for a typical customer was £1,755 a year, the prepayment level £1,707, and the standard credit level £1,8901.
Those three figures describe the same underlying energy, priced differently because suppliers' costs of serving each payment type differ. Prepayment sat £48 below direct debit for that period, and standard credit sat £136 above it1. Standard credit, paying on receipt of a bill by cash, cheque or bank transfer, is the most expensive payment method option under the cap, and Ofgem has attributed a £135 price premium on standard credit specifically to the costs of debt1.
The cap limits the unit rate and the daily standing charge. It does not limit a total bill3. A household that uses more energy than the benchmark consumption pays more than the headline annual figure regardless of how it pays, and every payment method pays the standing charge on every day the property has a connection, whether any energy is used or not4.
What the price cap limits, and what it does not
The default tariff cap was introduced on 1 January 20196. As set out in law, it works by setting a maximum that suppliers can charge per unit of energy, including a daily standing charge7. It applies to customers on default and standard variable tariffs, and it covers payment by standard credit (payment on receipt of an electricity and gas bill), direct debit, prepayment meter and Economy 7 meter8.
The single most misread feature of the cap is its scope. It limits how much companies can charge for each unit of energy and for the daily standing charge, but it does not limit the total bill3. Ofgem publishes the cap as a yearly figure for a typical household because that is easier to grasp, but it is only an example of what a household using benchmark volumes would pay9. A page on what the typical household figure actually means sets that out in detail.
What the cap does not cover matters as much for payment method. It applies to default tariffs whichever way the customer pays, but not to fixed, green or time of use tariffs10. A household on a fixed deal is outside the cap until that deal ends, at which point it falls back onto a capped default tariff. Ofgem sets one cap level for all suppliers rather than a different level for each company11, using a bottom-up cost assessment approach that builds the level from wholesale, network, policy, operating and margin allowances12.
For a household thinking about independence, the cap is a ceiling on the price of imported energy, not a guarantee of an affordable bill. Reducing the volume imported changes the unit-rate part of the bill; it does not touch the standing charge, which is payable on every day of connection whatever the payment method4.
Direct debit: the method the cap prices lowest for credit customers
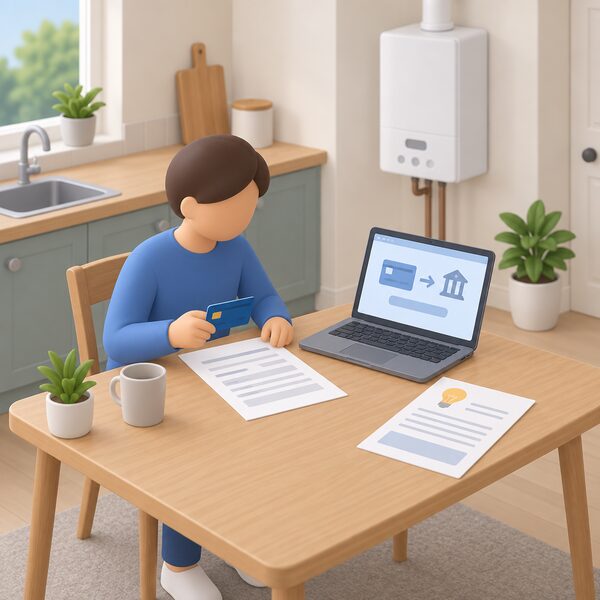
Paying by monthly direct debit means a set amount is deducted from the account by the supplier, which spreads the higher cost of winter across the year13. Under the cap, the direct debit level for a typical customer ran at £1,755 a year for 1 October to 31 December 2025, an increase of £35, or 2%, on the previous period1.
The reason it is priced below standard credit is administrative rather than moral. Suppliers can offer discounts to direct debit customers because the method involves less administration and management for the supplier14. Consumer bodies consistently describe it as usually the cheapest way to pay, generally saving hundreds of pounds a year compared with paying by cash, card or cheque15. Not everyone accepts that logic: one independent response to government argued that while the costs of servicing different payment methods must be covered, it is not appropriate for companies to be permitted to penalise customers by applying lower charges to those who pay by direct debit16.
The allowances behind the level are visible in Ofgem's own cost breakdown. For the direct debit cap covering 1 July to 30 September 2025, the earnings before interest and tax allowance stood at £43 a year, headroom at £18, and levelisation at £817. Those are small components of a figure in the region of £1,700 to £1,800, but they are the parts that vary with the supplier's cost of serving the customer rather than with wholesale gas.
Direct debit has its own failure mode: payments set too high build credit balances, and payments set too low build debt. Those questions are covered in direct debit payments and credit balances.
Prepayment meters: what the cap means for pay-as-you-go
A prepayment meter is used to pay for electricity or gas in advance rather than after it has been used19. Credit is bought with a key or smart card, online or by phone, and the meter runs down against it20. Prepayment tariffs are subject to the price cap in the same way that standard variable credit tariffs are20.
The historic position, in which prepayment was the most expensive way to buy energy, has reversed under the cap. The cost premium associated with paying by prepayment as against direct debit was removed through the Ofgem price cap21. For 1 October to 31 December 2025, the prepayment level rose from £1,672 to £1,707, a £35 or 2% increase, and sat £48 below the direct debit level1. For 1 April to 30 June 2025 the gap had been £4622. On Economy 7 arrangements the equivalent gap for that April to June period was smaller, at £25 below direct debit22.
| Cap period | Direct debit | Prepayment | Standard credit |
|---|---|---|---|
| 1 Oct to 31 Dec 2025 | £1,7551 | £1,7071 | £1,8901 |
| Gap vs direct debit, same period | baseline | £48 lower1 | £136 higher1 |
| Gap vs direct debit, 1 Apr to 30 Jun 2025 | baseline | £46 lower22 | £120 higher22 |

The lower headline level does not make prepayment an easy way to buy energy. Payment in advance transfers the risk of running out to the household, and debt recovered through the meter is taken from each top-up before any energy is delivered. Where repayment is being taken as a percentage of top-up, or as a percentage plus a fixed weekly amount, independent guidance sets out that an affordable fixed weekly amount can be requested instead23. The mechanics are covered in repaying energy debt through a prepayment meter and in prepayment meters.
Standard credit: the most expensive method under the cap
Ofgem states the position plainly in each quarterly summary of changes.
"Standard credit is the most expensive payment method option under the price cap."
For 1 October to 31 December 2025 the standard credit level rose from £1,855 to £1,890, a £35 or 2% increase, leaving those customers paying an additional £136 compared with those paying by direct debit1. The gap has widened over time: it was £106 for cap period 12a in early 2024, £120 for 1 April to 30 June 2025, and £136 by that autumn24. Further back, in April 2021 the differential between standard credit and direct debit stood at £84, and Ofgem's February 2021 press release put the standard credit premium at £8525.
What drives it is debt rather than paperwork alone. Ofgem attributes a £135 price premium on standard credit specifically to the costs of debt2. Around 16% of customers pay by standard credit, and research suggests up to 43% of them do not realise it is the most expensive way to pay for energy2. Independent reporting for the October 2026 period put standard credit unit rates roughly 8% higher than those for direct debit or prepayment customers27.
The effect appears in standing charges as well as unit rates. For the January 2026 period, households in the Midlands paying on receipt of bill were reported to pay over £14 more on their standing charge over the three-month period than direct debit customers28. A fuller comparison sits on standard credit vs direct debit under the price cap.
Standing charges: the daily fee no payment method escapes
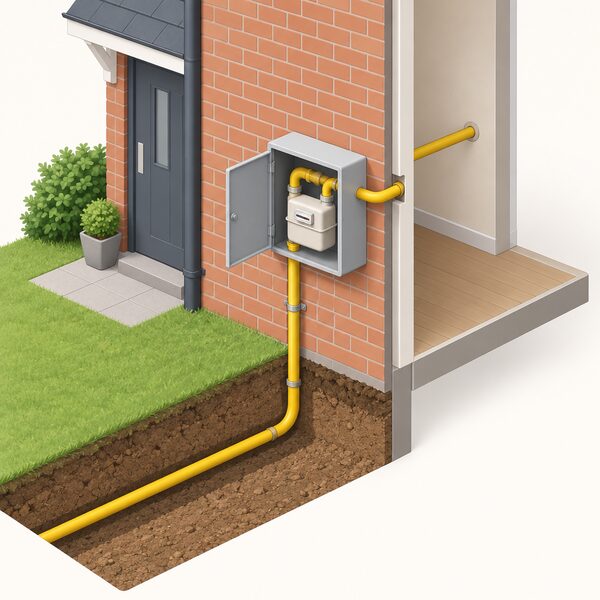
The standing charge is a fixed daily fee paid every day, even if no energy is used on that day29. It is payable for every day the property has an energy connection4, and it is not generally something a customer can opt out of or reduce30. It recovers the costs of providing energy company services, from the wires, pipes and cables that deliver power to the door through to the staff and buildings the business needs to function31. Transport costs, administration charges and government environmental and social schemes all sit inside it32.
Standing charges are covered by the price cap, which limits how much suppliers can charge, although suppliers are not required to include a standing charge at all33. For the cap running from 1 January to 31 March 2026, the daily standing charge was 54.75p for electricity and 35.09p for gas10. For 1 July to 30 September 2026, independent figures put electricity at 57.19p a day and gas at 29.04p a day34, and for 1 October to 31 December 2026 the average electricity standing charge was given as 54.83p a day35.
The direction of travel has been upward, with suppliers transferring more costs from unit rates to fixed daily charges32. Ofgem's October to December 2025 decision raised standing charges by 4% for electricity and 14% for gas, with the expansion of the Warm Home Discount adding a total of 7p a day36. Standing charges make up around 19% of the average household's bill37, and one independent response to government argued there is a good justification for removing them because of the inherent unfairness they create, noting they form a disproportionate part of overall costs for customers with very low consumption, and suggesting a flat rate addition to unit costs as an alternative16. Ofgem has consulted on requiring suppliers to offer a tariff with a standing charge priced £150 below the price cap nil consumption level per annum38. See standing charges and standing charge reform.
For energy independence this is the binding constraint. Generating or saving energy reduces the unit-rate half of the bill; it does not reduce the daily fee. A household that cuts consumption sharply still pays the standing charge in full, which is precisely the disproportion the independent response identified16.
Regional variation: 14 caps, not one
A separate price cap is set for each of the 14 regions and applies throughout the region, with no breakdown published below regional level39. Ofgem lists a customer's location, alongside payment method, fuel and meter type, among the factors that determine the level that applies4. The relevant licence condition names the customer's location and, for electricity, whether the tariff uses a multi-register or single-rate metering arrangement40.
The spread is material. Customers in north Wales and Merseyside pay almost £360 a year in standing charges alone, compared with £267 in London; households in Yorkshire, north east England and southern Scotland all pay over £333 a year, against a Great Britain average of £309 a year as reported in September 202641. On gas standing charges for 1 July to 30 September 2026, London was the most expensive region at 29.52p a day, with Southern at 28.53p42. Ofgem noted that from 1 April 2025 standing charges would reduce for most households in Britain, but that some regional variation remains7.
Part of the explanation is timing rather than geography alone: standing charge rates for electricity distribution are set 15 months in advance, based on the inflation rate at that time33. Price rises have also been attributed to increases in parts of the cost of transporting energy in Great Britain and to costs towards government schemes and essential support43.
Meter type compounds the regional effect. Customers on Economy 7 style tariffs were reported to face standing charges 13% higher than direct debit customers for the October 2026 period27. Northern Ireland is outside the Great Britain price cap arrangements entirely; see energy bills in Northern Ireland. Regional unit rates are set out in electricity and gas unit rates by region.
How the level is set and reset
Ofgem updates the price cap every three months10, a position repeated across official and independent guidance5. That was not always so: when the default tariff cap began it was reviewed every six months, with the level reset in August for the winter period beginning 1 October44. The earlier prepayment safeguard remedy from the Competition and Markets Authority moved every six months in line with a range of cost indices46, and the default tariff cap was designed to be adjusted in the same way, using cost indices and data outside suppliers' control47.
The level is built from the bottom up rather than negotiated12, and one level is set for all suppliers11. The consumption benchmark used to convert that into a headline annual figure has its own history. The benchmark has been based on Typical Domestic Consumption Values from 2017, and Ofgem's decision maintains a single benchmark across all payment types, with 2,700 kWh for single rate electricity and 12,000 kWh for gas from 1 January 2026; adopting the latest values was assessed as increasing the cap level by about £9 a year for a typical customer48. Parliamentary reporting has assumed typical consumption of 2,500 kWh for electricity and 9,500 kWh for gas49. Those differences are why two published "typical" bills can differ without either being wrong; typical domestic consumption values covers the benchmark in full.
Announcement timing follows a fixed rhythm. The next cap period, starting 1 January 2027, is due to be announced at the end of November 202650. Price cap history and announcement dates lists the full sequence.
Where the cap is heading
Recent periods have moved in both directions. There were three consecutive rises up to April 2025, when the cap rose 6.4%51. It fell in July 202552. For October to December 2025 all three payment-method levels rose by £35, or 2%1. Standing charges rose again in the January to March 2026 decision53, and in April 2026 action taken at the Budget saw the cap fall by 7%54. Over a longer view, the current cap has been described as 70% higher than in 202155.
The next fixed points are structural rather than seasonal. Ofgem has consulted on updating how the cap level is set for single-rate electricity customers as the market moves to market-wide half-hourly settlement56, and on requiring a lower standing charge tariff option38. Government has said standing charges are too expensive for some and confirmed it is working with Ofgem on how those costs could be recovered more fairly57. Independent responses have proposed allocating those costs through a flat addition to unit rates, supported by a social tariff or energy prescriptions for low income or vulnerable customers16; see a social tariff for energy.
For a household, the practical consequence of quarterly resets is that the payment-method gap is not a fixed feature. It has ranged from £84 in April 2021 to £136 in late 2025 on the standard credit side25, and from £46 to £48 on the prepayment side within 2025 alone22. What stays constant is the structure: the cap ceilings the price of imported energy, differentiates that ceiling by how the household pays, and leaves the daily standing charge in place whatever the household generates for itself. The wider context sits on the energy bills and the price cap pillar and on energy bills and energy independence.
Sources57 cited
- Summary of changes to energy price cap, 1 October to 31 December 2025, Ofgem, 27 August 2025
- Debt strategy update: supporting a reduction in energy debt, Ofgem, 6 November 2025
- Water and energy poverty toolkit, National Energy Action, 25 June 2026
- Energy price cap, Ofgem, 17 September 2026
- Standard rate tariffs explained, Uswitch, 26 August 2026
- Energy price cap methodology: backwardation deadband decision, Ofgem, 21 November 2025
- Energy price cap will rise 6.4% in April, Ofgem, 25 February 2025
- Energy price cap briefing, House of Commons Library, 26 February 2026
- Water poverty: a common measurement, National Energy Action, 25 June 2026
- Energy price cap explained, Welsh Government, 4 March 2026
- Decision on changes to Annex 4: policy cost allowance methodology, Ofgem, 4 February 2022
- Decision on the process for updating the default tariff cap methodology, Ofgem, 4 February 2022
- Switching electricity or gas supplier, Consumer Council for Northern Ireland, 2026
- How the retail energy market works, Energy UK, 6 April 2023
- Getting the best energy deal, Age UK, 10 September 2026
- Energy bills for domestic consumers: response, Energy Saving Trust, 9 April 2025
- Summary of changes to energy price cap, 1 July to 30 September 2025, Ofgem, 2025
- Domestic EcoLoyalty 1 Year Fixed Tariff May 2026 principal terms, Ecotricity, 2026
- Get help with your prepayment meter, Ofgem, 2026
- Prepayment meters guide, Uswitch, 26 August 2026
- Forced prepayment meter transfer, End Fuel Poverty Coalition, 8 January 2026
- Summary of changes to energy price cap, 1 April to 30 June 2025, Ofgem, 25 February 2025
- Energy debt on prepayment meters, Centre for Sustainable Energy, August 2026
- Default tariff cap letter, 1 April 2024, Ofgem, 23 February 2024
- Response to Ofgem's call for evidence on levelisation of payment method cost differentials, Citizens Advice, April 2021
- Energy price cap to increase in April, Ofgem, 5 February 2021
- Ofgem price cap, End Fuel Poverty Coalition, 26 August 2026
- January 2026 price cap, Act on Energy, 1 January 2026
- Understanding energy bills, StepChange, 20 September 2026
- How to understand your electricity and gas bills, Energy Ombudsman, 24 April 2025
- Standing charges research briefing, House of Commons Library, 17 September 2026
- Energy standing charges, Uswitch, 6 July 2026
- Energy UK explains standing charges, Energy UK, 9 July 2025
- Average gas and electricity bills in the UK, Uswitch, July 2026
- Should I get a no standing charge tariff?, Uswitch, 26 August 2026
- Energy price cap will rise 2% in October, Ofgem, 27 August 2025
- Response to April energy price cap announcement, Uswitch, 25 February 2026
- Requirement to offer lower standing charge tariffs, Ofgem, 24 September 2025
- Regional energy price variation briefing, House of Commons Library, 20 September 2026
- Supplier compliance with price cap requirements for customers on restricted meters, Ofgem, 9 May 2025
- News, End Fuel Poverty Coalition, 8 September 2026
- Regional UK energy prices, Confused.com, 4 June 2026
- Changes to the energy price cap between 1 October and 31 December 2025, Ofgem, 27 August 2025
- Energy customers could face bigger bills than before the price cap, Which?, 7 February 2019
- Higher wholesale costs push default and prepayment price caps up in April, Ofgem, 7 February 2019
- Retail energy markets in 2016, Ofgem, June 2016
- Default tariff cap policy consultation overview, Ofgem, 25 May 2018
- Energy price cap benchmark review decision, Ofgem, 21 November 2025
- Domestic energy prices briefing, House of Commons Library, 28 August 2026
- October energy price cap: what to expect, Uswitch, 24 August 2026
- Households urged to take a meter reading before 1 April, Uswitch, 1 April 2025
- Millions more families to get £150 off energy bills this winter, GOV.UK, 19 June 2025
- Another winter, same crisis: energy bills stay high as profits soar, End Fuel Poverty Coalition, 21 November 2025
- Ofgem transformed to strengthen protections for energy consumers, GOV.UK, April 2026
- Improved bill support: the case for a social discount, Energy UK, 23 August 2026
- Energy price cap: technical approach to market-wide half-hourly settlement, Ofgem, 25 March 2026
- Minister hints at more household energy support to come, End Fuel Poverty Coalition, 28 August 2026
 Ways to Pay an Energy SupplierHow you pay for gas and electricity changes what you are charged, and by how much.
 The Full Energy Bills and the Price Cap GuideWondering why your bill went up even when you used less power?
 Energy Price CapThe price cap sets the most you pay for each unit of gas and electricity, plus the daily standing charge, but not your total bill.
 Prepayment and Pay As You GoHow prepayment and pay as you go energy tariffs work in the UK: meter types, top-ups, emergency credit, debt repayment through the meter, price cap treatment and how households move to a credit meter.
 Smart Prepayment MetersHow prepayment mode works on a smart meter, remote switching between credit and prepay, topping up, emergency and friendly credit, the prepayment price cap, the £500 debt limit for switching, and the free help available when a household cannot top up.
 Prepayment Meter DebtHow debt repayment is set on a prepayment meter, the limits on the share of a top-up that can be taken, and how to have a rate reviewed.