
In this guide
The energy price cap does not cap a bill. It caps the rate a supplier may charge for each unit of gas and electricity, and it caps the daily standing charge. Ofgem states plainly that it "does not limit the cost of your total bill. The more energy you use, the higher your bill will be."1 The annual pound figure attached to every cap announcement is an illustration: what a household would pay over a year if it used exactly the benchmark amount of energy, paid by direct debit, and the rates never changed.
From 1 October 2026 that illustrative figure is £1,723 a year for a typical home2, up from £1,663 a year for the July to September 2026 period3. Both numbers rest on the typical domestic consumption values in force since 1 July 2026: 9,500 kWh of gas and 2,500 kWh of electricity a year4. A household burning 17,000 kWh of gas will not pay £1,723. Nor will a flat using a third of the benchmark. The figure describes a benchmark, not a promise.
This distinction matters more than any single quarter's number. Regulators have made it since the cap's earliest days: the caps "are a cap on a unit of gas and electricity, with standing charges taken into account. They are not a cap on customers' overall energy bills"5, and the limit "isn't on your total bill, which will vary depending on how many units of energy you use in a billing period"6. The cap, as set out in law, sets a maximum that suppliers can charge per unit of energy, including a daily standing charge7.
What the cap actually limits: two numbers on the bill, not the total
There are only two things the default tariff cap constrains: the pence per kilowatt hour charged for gas and for electricity, and the pence per day standing charge on each fuel. Everything else on a bill, the amount of energy consumed, the length of the billing period, any debt repayment folded into a direct debit, sits outside it. Consumer guidance puts it the same way: the cap limits how much companies can charge for each unit of energy and for the daily standing charge, but it does not limit the total bill10. Home Energy Scotland states it in four words: "it doesn't limit your total bill"11.
The practical consequence is that two households on the identical capped tariff, in the same region, paying the same way, can receive bills hundreds of pounds apart. Nothing has gone wrong in that case. The cap has done its job on the rates and the meter has done the rest.
It also means the cap offers no protection against the single largest variable in a household's energy spend, which is how much energy the home needs. Insulation, heating system, occupancy and behaviour all sit outside regulatory protection. A household seeking genuine control over its bill is working on consumption and on generation, not on the cap. The cap sets the price of dependence on a licensed supplier; it does not reduce the quantity of that dependence. This is the reasoning behind reducing an energy bill and energy bills and energy independence.
The cap is set on unit rates and standing charges, not on the total a household pays, and the headline figure describes a typical household's usage rather than a ceiling on any individual bill. All cap values are set before VAT: "All values are exclusive of VAT1 which is applied by suppliers to consumers bills."12
The 'typical household' figure is a worked example
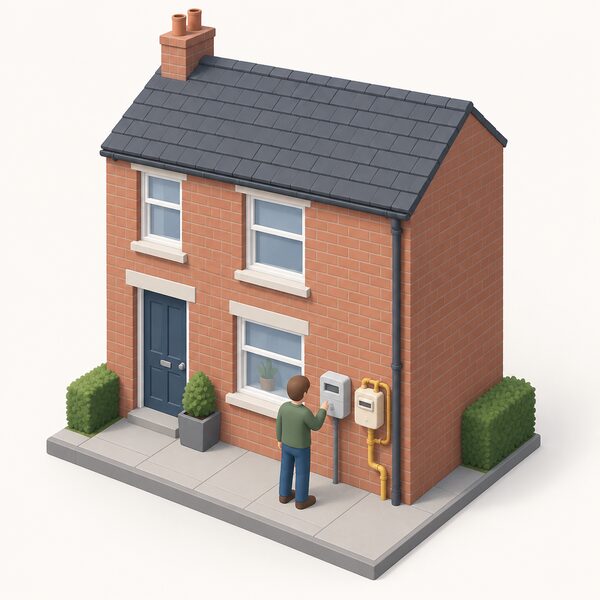
Ofgem presents the cap as a yearly bill for what it calls a typical household because unit rates and standing charges across two fuels are hard to compare at a glance. The presentation is explicitly an illustration13. The headline figure is normally based on an average dual fuel household paying by direct debit that has typical consumption14.
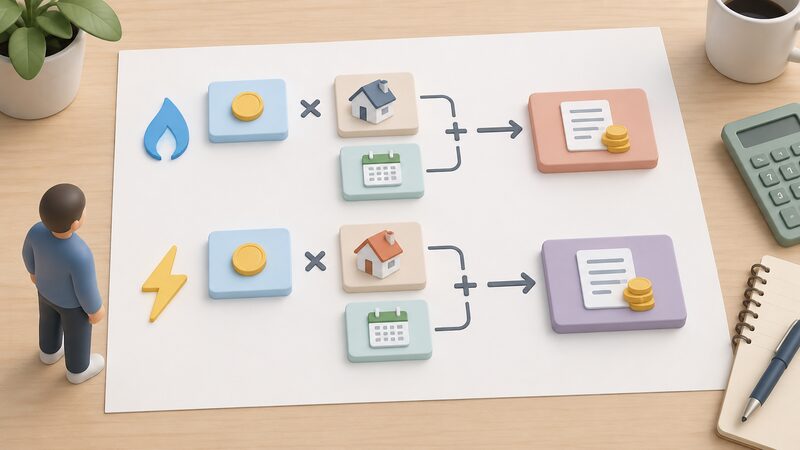
The arithmetic behind it is simple. Take the capped electricity unit rate and multiply it by the benchmark electricity consumption, 3,100 kWh a year on a single rate meter or 4,200 kWh on a multi-register meter. Take the capped gas unit rate and multiply it by the benchmark gas consumption of 12,000 kWh a year. Add the standing charges for the year, then add VAT, which the cap values exclude and suppliers apply to the bill. The result is the headline figure. Nothing in that calculation reflects any particular home.
A worked illustration from Energy UK makes the logic visible: a price cap of £2,000 means a household whose energy usage was in line with the relevant consumption values would pay about that much over a year14. Change the usage, and the total moves proportionally on the unit-rate element while the standing charge element stays fixed.
Typical domestic consumption values: the numbers underneath
Typical domestic consumption values, usually shortened to TDCVs, are industry standard values for the annual gas and electricity usage of a typical domestic consumer15. They are set by Ofgem and used both to help customers compare tariff offers and to calculate the unit rates for gas and electricity in the price cap16. They are derived using an established methodology drawing on Department for Energy Security and Net Zero sub-national consumption statistics, and are based on median rather than mean consumption17. Ofgem's current approach is to review them every two years18.
That review mattered in 2026. Ofgem updated the values from 1 July 2026 to reflect falling annual consumption across Great Britain. Electricity values were reduced by 7 to 14 per cent and gas values by 15 to 20 per cent, with the median values used for the headline cap falling by 7 per cent for electricity and 17 per cent for gas16. Before that revision, the benchmark consumption used in the price cap was based on values dating from 201717.
Three bands exist, not one. Ofgem's values for a low user have been described as 7,500 kWh gas and 1,800 kWh electricity, and for a high user 17,000 kWh gas and 4,100 kWh electricity19. The medium band is what appears in the headline. A household can read its own annual kilowatt hours from its bill or smart meter and see immediately which band it sits in. More detail sits on typical domestic consumption values.
| Element of the headline figure | Value | Period |
|---|---|---|
| Benchmark gas consumption | 9,500 kWh a year | in force since 1 July 20264 |
| Benchmark electricity consumption | 2,500 kWh a year | in force since 1 July 20264 |
| Low user benchmark | 7,500 kWh gas, 1,800 kWh electricity | Ofgem values19 |
| High user benchmark | 17,000 kWh gas, 4,100 kWh electricity | Ofgem values19 |
| Payment method assumed | direct debit, paperless billing | 4 |
How the cap is set and when it changes
The default tariff cap was introduced on 1 January 2019 following the Domestic Gas and Electricity (Tariff Cap) Act 20189. It was originally adjusted twice a year20. In summer 2022 Ofgem moved from setting the cap every six months to every quarter, in response to high and volatile wholesale prices, and it has been set quarterly since8. Every three months Ofgem reviews and sets a level for how much a supplier can charge for each unit of energy and for the daily standing charge21.
The wholesale element is calculated from a twelve month forward view of gas and electricity prices8. That forward-looking averaging is why bills move slowly relative to the market: a spike or a collapse in wholesale gas feeds into the cap gradually, and only from the quarter after it is observed. The mechanism is explored further on wholesale prices and energy bills.
One cap level applies to all suppliers. Ofgem has stated that it must set one cap level for all suppliers, with no different provisions for different licence holders22. A supplier cannot argue for a higher ceiling on the grounds of its own cost base.
Each level is announced roughly a month before it applies. The cap for the quarter beginning 1 January 2027 was expected to be announced at the end of November 202612. Past levels and announcement dates are collected on price cap history.
Recent levels: what the headline figure has done
The headline number has moved every quarter. Reading the sequence requires care, because the benchmark changed midway through 2026.
| Period | Headline annual figure, typical dual fuel direct debit household |
|---|---|
| 1 April to 30 June 2025 | £1,84923 |
| 1 July to 30 September 2025 | £1,72023 |
| 1 October to 31 December 2025 | £1,75520 |
| 1 April to 30 June 2026 | £1,64124 |
| 1 July to 30 September 2026 | £1,6633 |
| From 1 October 2026 | £1,7232 |
For the October to December 2025 period Ofgem set the price for a typical household using electricity and gas and paying by direct debit across England, Scotland and Wales at £1,755 a year, with bills rising by £2.93 a month or £35.14 a year for a typical household21. The daily gas standing charge for that period, on a standard variable direct debit tariff averaged across England, Scotland and Wales and including VAT, was 34.03 pence21.
The April 2025 rise showed how the headline can mislead when read alone: the cap rose by £111 for an average household per year, around £9.25 a month over the three-month period of the cap, and stood 9.4 per cent, or £159, above the level twelve months earlier of £1,6907. That figure is a per-year illustration applied to a three-month cap period, another reason the annual number is a comparison device rather than a forecast of any household's spending.
What sits inside the capped rate: wholesale, networks, policy costs and VAT
The capped unit rate is not a raw energy price. Ofgem sets it from a defined stack of allowances: wholesale costs, the cost a supplier pays to buy energy, network costs, operating, debt and industry costs, an earnings before interest and tax allowance, policy costs, and VAT, with further variation by the type of energy used, the type of meter installed and how the bill is paid25. Independent analysis groups the same material into six broad categories: wholesale costs, network costs, policy costs, operating costs, profit to suppliers, and VAT26.
Network charges are the cost of moving the energy. Around £100 of the average annual household bill goes to the local distributor to build, maintain and invest in the distribution network, and £20 goes towards operating, maintaining and investing in the electricity transmission network27.
Policy costs fund government programmes. In the October to December 2024 period, policy costs made up 16 per cent of the £884 electricity bill and 6 per cent of the £833 gas bill for a typical household28. A separate assessment put levies at 11 per cent of a typical household's total energy bill29. Around half of a household electricity bill reflects the cost of electricity itself, with the rest made up of taxes, levies and network charges30. This imbalance between the electricity and gas stacks is a live policy question and is covered on policy costs and levies on energy bills.
VAT sits on top. Ofgem's published cap level tables are exclusive of VAT, which suppliers then apply to consumers' bills31. Removal of VAT on electricity has been assessed as worth £45 off a typical home's annual bill based on the electricity price cap as it stood in July 202632. Other adjustments feed through in small amounts: electricity balancing costs were reported as adding around £1.23 a month to the average household bill in the August 2025 announcement20.
Who is covered, and who is not
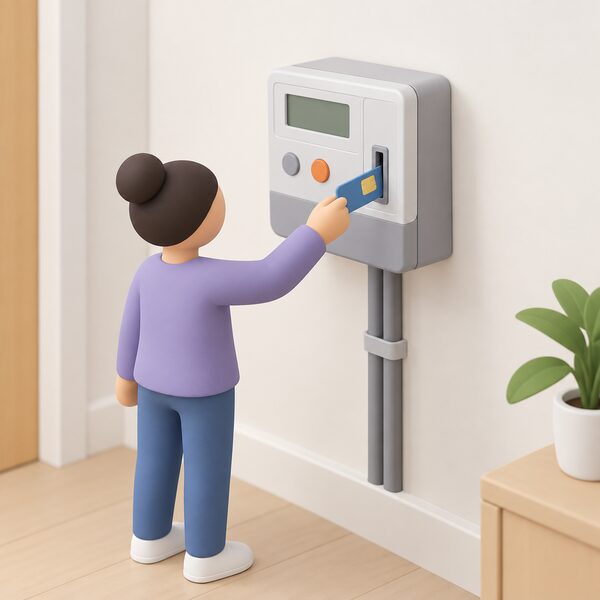
The cap protects households on standard variable and default tariffs9. Coverage does not depend on payment method: a household is covered if it is on a default tariff and pays for its electricity and gas by standard credit, direct debit, prepayment meter or on an Economy 7 meter21. No application is required, a point addressed on do I need to apply.
Several groups fall outside:
- Households on a fixed tariff they have chosen. Ofgem lists fixed tariffs, business energy contracts, heat networks and heating oil as outside the cap1. A fixed-term tariff's rates do not move when the cap moves.
- Business energy contracts of any size.
- Heat network customers, who buy heat rather than metered gas or electricity.
- Homes heated by oil or bulk fuels.
The cap was described as protecting 23 million households on standard variable and default tariffs22. More recently, around 60 per cent of households have been reported as remaining on capped variable deals rather than moving to fixed13. The balance shifts with every quarter's switching activity. Fixed and standard variable tariffs sets out the trade-off, and fixed tariff vs price cap compares them directly.
Regional variation across Great Britain
There is no single set of capped rates. Ofgem set out from the beginning that the cap level will vary across Great Britain, because the costs of transporting the energy from the generation source to the customer, the network charges, vary by region35. Published headline figures are averages across all regions in Great Britain, and the exact amounts depend on where a household lives and how it pays36.
The scale of that variation is visible in Ofgem's own regional tables. For gas on an other payment method basis at 12,000 kWh a year, for 1 April to 30 June 2024, the annual cap level ranged from £790.79 in Northern Scotland to £806.51 in the Southern region, with £797.13 in Yorkshire, £798.66 in the Northern region and £791.10 in Southern Scotland. The corresponding cap at nil consumption, effectively the standing charge component over a year, ranged from £106.98 in Southern to £110.09 in Southern Scotland37. Two figures for the North West in that publication disagree, £791.18 against £839.38 for the annual cap and £109.93 against £122.40 at nil consumption, and this has not been resolved37.
Electricity benchmarks in the same publication were 3,100 kWh a year for single-rate meters and 4,200 kWh a year for multi-register meters37, values since superseded by the 2026 review. Regional detail sits on electricity and gas unit rates by region.
Northern Ireland operates a separate market. The cap levels discussed here apply to Great Britain, and energy bills in Northern Ireland covers the different arrangements there.
Working out what the cap means for one household
The calculation that produces a personal figure uses the same three inputs as the headline, with the household's own consumption substituted for the benchmark.
- Read the annual gas and electricity consumption in kilowatt hours from a bill or smart meter, rather than estimating from the number of bedrooms.
- Take the capped unit rate for the region and payment method from the current bill, in pence per kilowatt hour, and multiply by that consumption for each fuel.
- Add the daily standing charge for each fuel multiplied by the number of days in the period. Reported cap standing charges have stood at 60.97p a day for electricity and 31.65p a day for gas38.
- Add VAT at the rate applying to the period.
Standing charges are payable regardless of consumption, which is why a low-usage home pays a far higher effective rate per unit than the headline implies. Standing charges and standing charge reform set out what they fund and the reform debate.
Where a bill is higher than expected, consumption is not always the cause. The Energy Ombudsman notes that "Many consumer assume that a catch up bill is the result of higher than average usage, but this is rarely the case"39, pointing instead to estimated readings and billing corrections. Meter readings and estimated bills, back billing rules and why is my bill higher than the cap figure deal with those situations.

What the cap does, and does not, do for energy independence
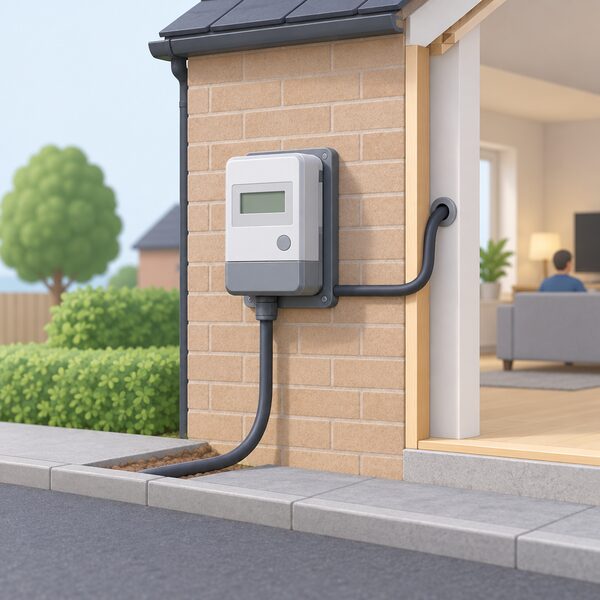
The price cap is a price control on a service a household still buys from someone else. It sets the maximum rate a licensed supplier may charge on a default tariff, applied uniformly across all suppliers22, and it is reviewed and reset by the regulator every quarter21. What it does not do is reduce the quantity of grid gas and grid electricity a home needs, alter the network and policy costs bundled into the rate, or extend any protection at all to oil, bulk fuel or heat network customers1.
For a household pursuing independence, the cap is best read as the current price of the default connection, refreshed four times a year on a twelve month forward view of wholesale markets8. Reducing exposure to it means reducing metered consumption, because the standing charge remains payable whatever the meter records. The headline £1,723 figure2 describes a benchmark home at benchmark usage; the lever a household actually controls is the consumption the headline assumes.
Sources39 cited
- Energy price cap, Ofgem, 2026-09-17
- Beyond the headlines: understanding complaints about wood burning, HETAS, 2025-11-07
- Octopus Energy price changes, Uswitch, 2026-07-01
- End Fuel Poverty Coalition news feed, End Fuel Poverty Coalition, 2026
- Higher wholesale costs push default and pre-payment price caps up in April, Ofgem, 2019-02-07
- Energy price caps information leaflet, Ofgem, 2018-12
- Energy price cap will rise 6.4% in April, Ofgem, 2025-02-25
- Energy price cap methodology: backwardation deadband decision, Ofgem, 2025-11-21
- Energy price cap: review of historical debt-related costs, Ofgem, 2026-03-25
- Winter warmth support packs, National Energy Action, 2026-06-25
- Getting the best deal on energy, Home Energy Scotland, 2026-09-20
- October energy price cap: what to expect, Uswitch, 2026-08-24
- Price cap impact on July energy bills, Uswitch, 2026-05-19
- Energy UK explains typical domestic consumption values, Energy UK, 2023-08-25
- TDCV 2023 call for input, Ofgem, 2023-02
- Energy UK explains typical domestic consumption values, Energy UK, 2026-07-01
- Energy price cap benchmark review decision, Ofgem, 2025-11-21
- Review of typical domestic consumption values decision, Ofgem, 2026-05-27
- The energy price cap in July: should you fix a tariff?, Which?, 2025-05-23
- Energy price cap will rise 2% in October, Ofgem, 2025-08-27
- Changes to the energy price cap between 1 October and 31 December 2025, Ofgem, 2025-08-27
- Contract for Difference allowance methodology decision, Ofgem, 2022-06-23
- Summary of changes to the energy price cap, 1 April to 30 June 2025, Ofgem, 2025-02-25
- Written statement: fuel poverty, Welsh Government, 2026-02-26
- How your electricity or gas bill is calculated, Ofgem, 2026
- What's in an energy bill?, Nesta, 2024-11-22
- What role does National Grid play in your energy bill, National Grid, 2026-09-17
- Household energy bills and green levies, Nesta, 2024
- Cheaper electricity, fairer bills, Nesta, 2024-12-04
- Fixing the electricity to gas price gap, EHPA, 2026-07-24
- Energy price cap levels, 1 October to 31 December 2025, Ofgem, 2025-08
- Uswitch responds to the removal of VAT on electricity bills, Uswitch, 2026-07-20
- Heating oil prices research briefing, House of Commons Library, 2026-09-20
- Cost of living pressures and soaring prices expose gaps in bulk fuel checks, Chartered Trading Standards Institute, 2026-03-16
- Default tariff cap policy consultation overview, Ofgem, 2018-05-25
- Energy price cap drops to £2,074, Which?, 2023-05-25
- Default tariff cap level, 1 April 2024 to 30 June 2024, Ofgem, 2024-02
- Guide to standing charge energy tariffs, Energyhelpline, 2026-09-20
- Billing explanations: hints and tips, Energy Ombudsman, 2026-09-20
 Typical Consumption ValuesOfgem's typical usage figures are what the price cap and most bill comparisons are based on.
 Energy Price CapThe price cap sets the most you pay for each unit of gas and electricity, plus the daily standing charge, but not your total bill.
 The Full Energy Bills and the Price Cap GuideWondering why your bill went up even when you used less power?
 Price Cap HistoryThe energy price cap sets the most a supplier can charge you for each unit of gas and electricity, so it shapes what you pay.
 Domestic Energy Prices Over TimeTracks the published domestic gas and electricity unit rates, standing charges and cap levels over time, from the £1,277 cap of early 2022 through the crisis peak to the 2026 quarters.
 Standing ChargesWhy is there a daily charge on a gas or electricity bill even when nothing is used, and what does it actually pay for?