

In this guide
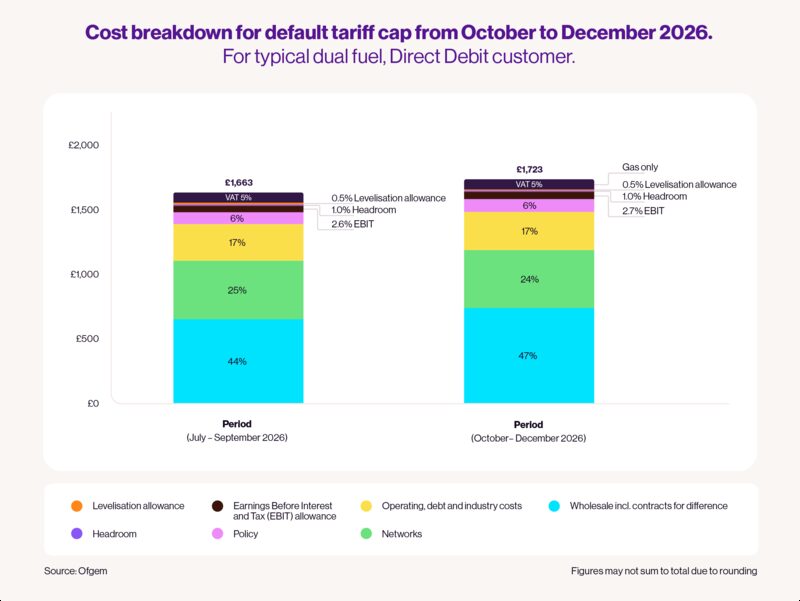
A domestic gas and electricity bill is not a single price. It is six broad cost blocks stacked on top of each other: wholesale costs, network costs, policy costs, operating costs, supplier profit and VAT1. Ofgem describes the same structure when it sets the price cap, listing wholesale costs (what a supplier pays to buy energy), network costs (building, fixing and repairing the pipes and wires that move energy), policy costs (government social and environmental schemes), operating, debt and industry costs, EBIT (the supplier's margin) and VAT at 5%2.
Wholesale energy is the largest single block, put at around 40% of the overall cost3. Network costs come next, described in parliamentary analysis as almost 30% of the cap's total4. Policy levies account for roughly 16% of a typical electricity bill but only around 5.5% of a gas bill5. Operating costs have been estimated at 13% of customers' bills6, and 5% VAT is applied on top of nearly everything2.
Those shares translate into money through the price cap. For October to December 2025 Ofgem set a typical direct debit dual-fuel bill at £1,755 a year, about £102 a month7. For 1 January to 31 March 2026 the equivalent figure was around £1,758, built on an electricity unit rate of 27.69p per kWh and a 54.75p daily standing charge, and Ofgem confirmed a 7% fall for April to June 20268. None of those numbers is a bill anyone actually receives: they describe a household using benchmark amounts of gas and electricity in an average region.
Wholesale costs: the biggest factor in your bill
Wholesale cost is the price a supplier pays to buy gas and electricity on the open market before it reaches a home2. Ofgem's own review of the default tariff cap states plainly that "Wholesale costs account for the largest portion of a customer's bill"10, and it is the component that moves fastest: it is the biggest factor affecting energy bills and the usual reason a cap level rises or falls11.
The exact share depends on who is counting and when. Independent analysis of the price cap puts wholesale at 35% of a typical electricity bill and 44% of a gas bill from January 202612. A comparison service puts wholesale gas and electricity at about 40% of the overall cost3. A supplier's own explainer gives a wider band of 40 to 60% of an energy bill13. These figures are not contradictions so much as different snapshots: the wholesale share expands when gas prices spike and contracts when they fall, while network and policy costs stay relatively fixed.
That volatility is what turned a manageable bill into a crisis. Rapid increases in wholesale prices from mid-2021 onwards drove a 54% increase in the price cap in April 202214. Analysis at the time found that over 90% of the rises in energy bills were due to the impacts of gas wholesale costs15. Looking back from 2026, the House of Lords Library attributes 54% of the increase since pre-crisis levels to higher wholesale prices, against 20% for network charges and 6% for green levies16.
For a household, wholesale cost is the part of the bill it has least influence over and the part that most clearly represents dependence on an international commodity market. Reducing consumption reduces the quantity bought, but the price per unit is set far upstream. That is the core argument behind reducing an energy bill through fabric and generation rather than tariff-shopping alone, and it is covered in more detail under wholesale prices and energy bills.
Network costs: almost 30% of the total
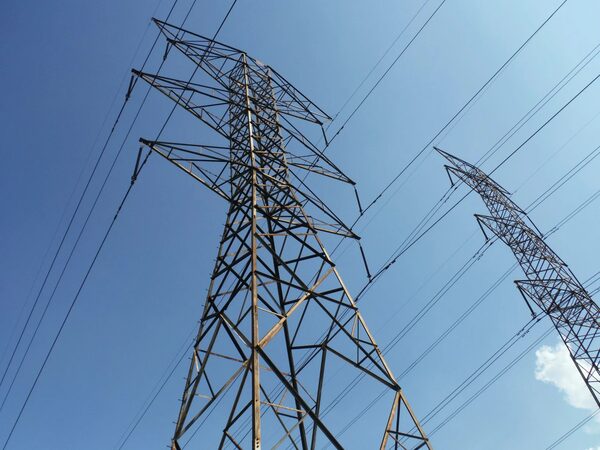
Network costs pay for the wires, pipes and control systems that physically move energy: building, fixing and repairing them2. They break into three charges: transmission, distribution and balancing services17. Transmission moves electricity at high voltage across the country, distribution takes it the last stretch to the street, and balancing keeps supply and demand matched second by second.
The headline share, almost 30% of the price cap total, comes from parliamentary analysis4. Component-level estimates are lower because they separate electricity from gas: network charges have been put at 23% of an electricity bill and 23% of a gas bill from January 202617, at around 20% of an average electricity bill18, and at 23.37% of UK domestic electricity bills for 202119. The networks' own trade body describes electricity network running, maintenance and upgrade as around 13% of the average dual fuel bill under the July 2026 cap20. Distribution networks alone have been costed at £115 a year, or 13% of bills21. The spread between "almost 30%" and "13%" is largely about whether gas and electricity networks are counted together and whether balancing and transmission are folded in.
| Estimate | Share | Basis |
|---|---|---|
| Almost 30%4 | Price cap total | Parliamentary analysis, 2026 |
| 23% electricity, 23% gas17 | Per fuel | Independent analysis, from January 2026 |
| Around 20%18 | Average electricity bill | Independent analysis, 2023 |
| Around 13%20 | Average dual fuel bill | Electricity networks only, July 2026 cap |
| £115 a year, 13% of bills21 | Distribution only | Independent analysis, May 2025 |
Network costs vary by region, because local infrastructure costs, geography, population density and the cost of maintaining legacy systems all differ22. A household cannot escape them by switching supplier: the charge follows the connection, not the contract. Even a home generating much of its own electricity still pays the daily element of the network charge for as long as it stays connected, which is the practical limit on how far self-generation cuts a bill.
Policy costs and levies: what they add
Policy costs fund government social and environmental schemes, recovered through bills rather than taxation2. They raise around £5.9 billion a year and account for 11% of a typical household's total energy bill, split very unevenly: 16% of a typical electricity bill against 5.5% of a typical gas bill5. In cash terms, policy costs including both per-unit levies and levies inside standing charges add £142 a year to the electricity bill of a typical dual fuel household23.
That imbalance is the single most consequential feature of the bill for anyone electrifying their heating. 82% of the revenue raised from domestic levies comes from electricity bills and only 18% from gas bills24. Analysis for Scotland's climate plan puts social and environmental policy levies at an estimated 16% of electricity bills25. Placing the larger share on electricity makes the cleaner fuel carry the cost of decarbonisation, which is the substance of the rebalancing debate set out under policy costs and levies on energy bills.
The total is not static. The government cut policy costs in April 2026 by ending a levy-funded energy efficiency scheme and shifting funding for the largest renewable generation support scheme to general taxation4. Set against that, unrecovered energy debt is itself becoming a bill component: if domestic debt reaches £7 billion, an estimated further £10 to £15 per year would need to be added to bills26.
The Green Gas Levy
The Green Gas Levy is set by government and collected through the gas standing charge27. It is small at present: it raises around £9 million a year from households and adds about £0.38 a year to a typical domestic gas bill24. Ofgem's own modelling is that gas customers could see annual bills rise by approximately £4.70 at the peak of the levy in 2028, assuming a transition to a volumetric levy in future28.
Operating costs, supplier margin and bad debt
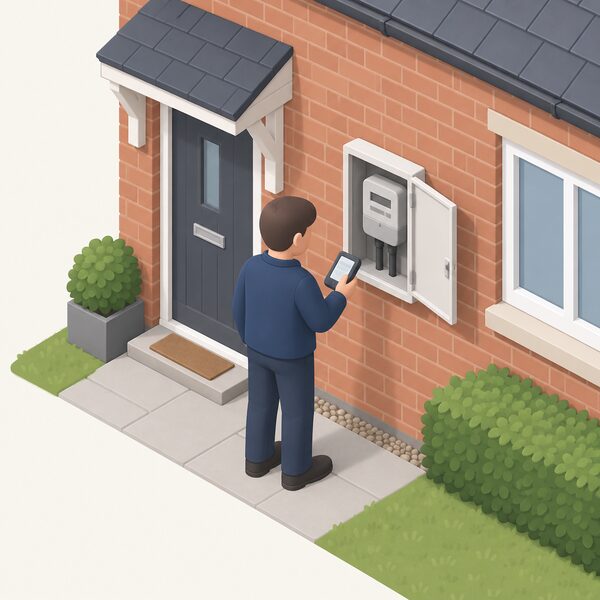
Operating costs cover what it takes to run a supply business: billing, metering, call centres, meter reading and the recovery of debt from customers who cannot pay. One estimate put suppliers' operating costs at 13%, or £242, of customers' energy bills6. Ofgem's cap includes a separate allowance for operating, debt and industry costs, and a further line called EBIT, the supplier's earnings before interest and tax, which is the regulated margin2.
How much of a bill is profit is contested. One analysis cited by fuel poverty campaigners puts profits at 24% of an energy bill, around £500 per family on an average bill29. That figure counts profit across the whole chain, including generation and networks, not the retail supplier's regulated margin alone, and it sits well above the EBIT allowance inside the cap. Broader framing is similar in direction: around half of a household electricity bill reflects the cost of electricity itself, with the rest made up of taxes, levies and other charges.
The cap also contains a headroom allowance and a levelisation allowance, the latter existing to make sure prepayment and direct debit customers pay the same standing charge9. Ofgem has said it "will be closely monitoring supplier compliance and will continue to take firm action against suppliers who fall short of their requirements"30.
Unit rates and standing charges: the two numbers on your bill
Whatever the underlying components, a household sees them as two numbers: a unit rate and a standing charge31. The unit rate is what is paid for each kilowatt hour used. The standing charge is a fixed daily amount, shown on a bill as a daily unit rate, with separate figures for gas and electricity32.
The standing charge covers the fixed costs of supplying a property: network connection, meter readings, maintenance and government initiatives31. It is charged whether or not any energy is used, which is why a household that has cut consumption sharply can find the standing charge dominating its bill. That is the subject of standing charges on energy bills and why is the standing charge so high?.
Tariffs with no standing charge exist, but they shift the same costs into the unit price. They typically charge higher unit rates for gas and electricity, which can result in higher bills33, and some charge a much higher unit rate for the first two units of gas and electricity used each day before dropping to a more normal rate for everything after34. Restricted meters add complication: a white meter bill carries two different unit rates and two different fees alongside any standing charges, and Economy 10 standing charges are often higher even though off-peak unit rates can be up to half the peak price. Those arrangements are covered under Economy 7, Economy 10 and restricted meter billing.
VAT at 5% and the taxes on top
Domestic gas and electricity carry VAT at 5%, compared with 20% for most business users35. It is applied to the charge after the other components are totalled, so it scales with everything beneath it: a rise in wholesale or network costs raises the VAT paid as well. Ofgem's cap methodology lists VAT at 5% on gas for the 1 October 2026 to 31 March 2027 period as an explicit component9. Other taxes on energy include fuel duty, which does not fall on domestic gas and electricity supply24. More detail sits under how much VAT is charged on energy bills?.
VAT rules differ for measures that reduce a bill rather than for the energy itself. Certain energy-saving products installed in a home attract either 5% or 0% VAT where the household is eligible36. In Northern Ireland, where the cost of the products excluding VAT is 60% or less of the total installation cost excluding VAT, 5% VAT applies to everything36.
The price cap: what it limits, and what it does not
The price cap is a limit on the unit rate and the daily standing charge. It is not a limit on the total bill. Ofgem is explicit:
"It does not limit the cost of your total bill. The more energy you use, the higher your bill will be."
The cap came into force at the beginning of 2019 and was introduced across all payment types in January 20194. It applies where a customer has not signed up for a fixed-term contract, covering standard variable and default tariffs regardless of payment method, including prepayment4. Fixed tariffs, business energy contracts, heat networks and heating oil sit outside it, as do some green and time-of-use tariffs9. See fixed tariff vs staying on the price cap and tracker and time-of-use tariffs compared with the price cap.
Ofgem presents the cap as an annual figure for a typical household as an illustration only, and a real bill will differ. The benchmarks behind it are typical domestic consumption values: 2,500 kWh of electricity and 9,500 kWh of gas are assumed for cap figures14, while medium-consumption values of 2,700 kWh for electricity, 11,500 kWh for gas and 3,900 kWh for multi-register meters are also published30. Their purpose is to give an idea of how much energy a home could use in a year so that bill figures can be compared9. This is explained further under typical domestic consumption values and what the price cap 'typical household' figure actually means.
The cap also has limited reach as a protection. At the October 2023 level, annual bills for typical consumption under the cap were still almost £800 or 69% above their summer 2021 levels. The Q4 2022 cap stood at £3,37114. A household's real protection against those swings is how little energy it needs, not the cap itself.
Why your bill differs from your neighbour's
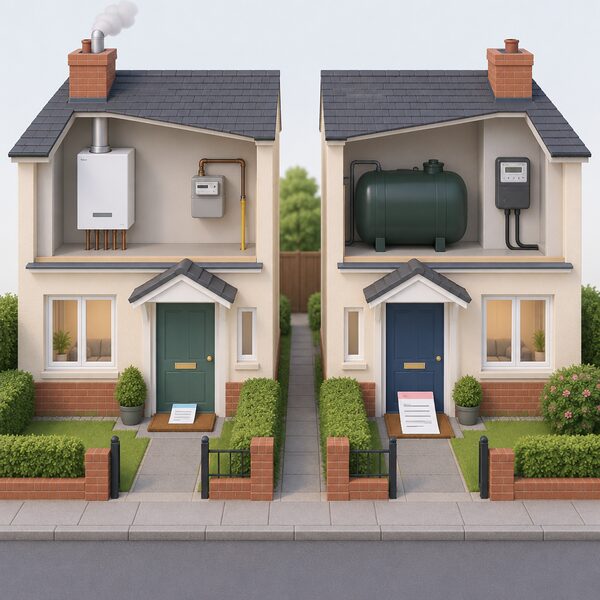
Two homes on the same street can pay different amounts for the same usage. Ofgem lists the factors as where you live, payment method, fuel type and meter type9, and adds that bills vary with how a home is heated, for example on heating oil or a heat network35.
| Factor | Effect |
|---|---|
| Region | A separate cap is set for each of the 14 supply regions of Great Britain and applies throughout that region, with no breakdown below regional level4 |
| Payment method | Oct to Dec 2025 cap totals: direct debit £1,755, standard credit £1,890, prepayment £1,70730 |
| Meter type | Restricted and multi-register meters carry separate rates and separate benchmark consumption30 |
| Fuel | Policy costs take 16% of a typical electricity bill against 5.5% of a gas bill5 |
Regional differences arise from local infrastructure costs, varying network distribution costs driven by geography and population density, and the cost of maintaining legacy infrastructure22. Ofgem's regional cap tables show the scale: in the Northern electricity region for 1 July to 30 September 2026, the benchmark maximum was a £223.48 standing charge and an £824.03 annual bill at 2,500 kWh on a single rate, and a £220.70 standing charge with a £986.44 annual bill at 3,400 kWh on a multi-rate meter37. Regional detail is set out under electricity and gas unit rates by region and payment differences under price cap rates by payment method.
Usage explains most of the rest. On a fixed tariff the unit cost and daily fee are locked, so a rising direct debit usually means more energy is being used than the supplier expected, not a price change38.
Northern Ireland is a separate market
Ofgem's price cap does not apply to households in Northern Ireland39. Bills there are regulated separately40. Reported average Northern Ireland prices for November 2025 were 30.8p per kWh on the standard electricity rate, 35p on-peak and 16.7p off-peak under Economy 7, and 6.5p per kWh for coal and solid fuel. Savings figures for Northern Ireland households are calculated from local supplier tariffs precisely because the cap does not apply. See energy bills in Northern Ireland.
How the cap is set and reviewed each quarter
Ofgem sets the cap level every 3 months9. Each level is calculated from the same component stack: wholesale costs, network costs, policy costs, operating costs, EBIT, headroom, the levelisation allowance and VAT9. The regulator revises the cap each quarter, setting maximum unit prices and daily standing charges for customers in each supply region of Great Britain, with separate caps for gas and electricity4.
The rhythm matters for households. Each level is decided about one month before it comes into effect, so there is a short window of notice before rates change. Quarterly review is recent practice: in August 2022 Ofgem announced it would update the cap every quarter rather than every six months, the six-monthly cycle having been the original design when the cap began. Historic levels and announcement dates are collected under price cap history.
Recent movements show the mechanism working in both directions: a 2% rise from October 2025 taking the direct debit total from £1,720 to £1,75530, a 0.2% rise from 1 January 202611, and a confirmed 7% fall for 1 April to June 2026, with the level then expected to stay roughly the same until the end of the year8.
What this means for household energy independence
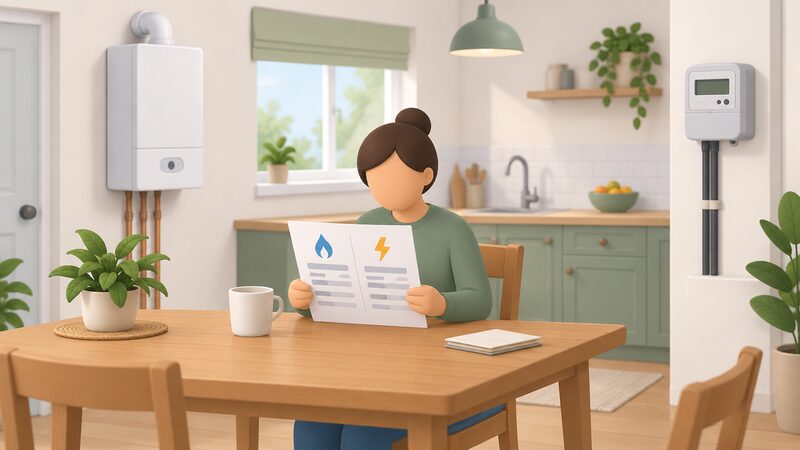
Reading the bill as components shows exactly where independence is possible and where it is not. Reducing consumption cuts the wholesale element, the per-unit policy levies and the VAT charged on all of them. Generating electricity on site cuts the same per-unit charges for the units displaced. What it does not cut is the standing charge, which covers the network connection, metering and maintenance regardless of use31, nor the regional network costs attached to that connection22.
The dependencies that remain are concrete: an international gas market that drove 54% of the bill increase since pre-crisis levels16, a regulated network whose charges arrive with the postcode, a government that decides which schemes are recovered from bills and which from taxation4, and a supplier whose operating costs and margin form part of every unit price6. A household that halves its usage halves the largest blocks of its bill but not the fixed daily floor beneath them. This is explored further in energy bills and energy independence and across the price cap guide.
Sources40 cited
- What's in an energy bill, Nesta, 2024-11-22
- Check if you are owed money on your energy bill, Ofgem, 2026
- Regional energy prices, Uswitch, 2026-08-26
- Domestic energy prices briefing, House of Commons Library, 2026-09-20
- Cheaper electricity, fairer bills, Nesta, 2024-12-04
- Tariff watch: the hidden costs in your energy bill, Warm This Winter, 2023-10-06
- Energy price cap will rise by 2% from October, Ofgem, 2025-08-27
- Energy price cap explained, Welsh Government, 2026-03-04
- Energy price cap, Ofgem, 2026-09-17
- Review of additional wholesale costs in the default tariff cap, Ofgem, 2023-10-03
- What changes are coming for energy bills in 2026, Which?, 2025-12-30
- Wholesale costs in an energy bill, Nesta, 2026
- What makes up your bill, EDF Energy, 2026
- Domestic energy prices research briefing, House of Commons Library, 2026-08-28
- Gas set to have added £2,000 to bills, Energy and Climate Intelligence Unit, 2022-07-14
- Electricity prices in Great Britain, House of Lords Library, 2026-06
- Network costs in an energy bill, Nesta, 2024-11-22
- Cutting the bills with UK clean power, Ember, 2023-10-18
- Electrification of heat, BEAMA, 2021
- Energy networks explained, Energy Networks Association, 2026
- Why expensive gas, not net zero, is keeping UK electricity prices high, Carbon Brief, 2025-05-20
- Energy bills for domestic consumers: response, Energy Saving Trust, 2025-04-09
- Delivering clean heat: a policy plan, Nesta, 2024-07-10
- Household energy bills and green levies, Nesta, 2026-09-20
- Response to Scotland's draft Climate Change Plan 2026 to 2040, Energy Saving Trust, 2026-01
- Energy debt: everyone pays, Energy UK, 2026-02-26
- Flexi 2023 charges, ScottishPower, 2026-09-17
- Decision on including a Green Gas Levy allowance in the default tariff cap, Ofgem, 2022-02
- New report exposes energy firm profit bonanza, End Fuel Poverty Coalition, 2025-11-05
- Summary of changes to the energy price cap, 1 October to 31 December 2025, Ofgem, 2025-08-27
- Energy standing charges, Uswitch, 2026-08-26
- Standing charges, E.ON Next, 2026-09-17
- Should I get a no standing charge tariff?, Uswitch, 2026-08-26
- Standing charges, National Energy Action, 2026-04-28
- Understand your electricity and gas bills, Ofgem, 2026
- Tax on shopping: energy-saving products, GOV.UK, 2026-09-17
- Energy price cap levels, 1 July to 30 September 2026, Ofgem, 2026
- Your gas or electricity supplier has put up its prices, Citizens Advice, 2026-09-17
- Switching your energy supplier, Energy Saving Trust, 2026-06-26
- Billing me softly, Resolution Foundation, 2026-08-10
 UK Electricity Generation MixBreaks down the shares of gas, wind, nuclear, solar, biomass, hydro and imports in UK electricity generation, how those shares move by hour and season, where the published figures come from, and what the mix means for a household's energy independence.
 Reducing Your BillRanks household electricity and gas uses by share of the bill and sets out what each measure changes, from heating settings and insulation to appliance use and tariff choice.
 Domestic Energy Prices Over TimeTracks the published domestic gas and electricity unit rates, standing charges and cap levels over time, from the £1,277 cap of early 2022 through the crisis peak to the 2026 quarters.
 Reading an Energy BillA line-by-line walk through a domestic gas and electricity bill: unit rate, standing charge, kWh consumption, meter readings, tariff name and balance, plus the 12-month back billing limit and the guaranteed standards payments that apply when a supplier or network operator gets it wrong.
 The Full Energy Bills and the Price Cap GuideWondering why your bill went up even when you used less power?
 Switch Energy SupplierThe practical sequence of a domestic energy switch: the details and readings needed, the five working day transfer, cooling-off periods, exit fees and the final bill.