In this guide
UK Energy Supply: Where Britain's Gas and Electricity Come From and What It Means for Homes
The UK gets its energy from a mixture of its own production and imports, and imports are the larger part. The Treasury has described the country as "a net energy importer with a high dependence on gas and oil"1. One consumer guide puts the share of UK energy that comes from abroad at around 60%, naming Norway, Qatar, Sweden and the Netherlands among the suppliers2. Around 80% of the energy the UK uses still comes from fossil fuels3.
Electricity is a different picture from energy as a whole. In 2024, 51% of UK electricity generation came from renewable sources and 14% from nuclear4. Carbon Brief's analysis of the same year found that 58% of electricity came from clean sources, or 64% excluding imports, and both were records5. Emissions from coal generation were zero in 20256.
For a household, the two pictures meet on the bill. Gas and oil account for 78% of household energy costs in the UK, and 47% of that gas and oil relies on imports7. A home can be supplied by an increasingly British-generated grid and still be exposed to international fuel markets through its boiler.
Where the UK's energy actually comes from: imports, domestic sources and the mix
The starting point is that the UK consumes more energy than it produces. The 2022 Spring Statement put this in one phrase: the UK is a net energy importer with a high dependence on gas and oil1. Smart Energy GB states that around 80% of UK energy comes from fossil fuels3. The Energy and Climate Intelligence Unit notes that much of the energy consumed in British homes does not originate in Britain, and that its price is often dictated by international markets10.
Import dependence has grown. In 2012, imports made up 43 per cent of UK energy supply11. The more recent consumer figure is around 60%, and the same guide says dependence on imported energy has returned to levels not seen since the 1970s2. These figures come from different publishers and use different methods, so they indicate the direction of travel and are not a precise series.
Gas links the different parts of the system. It contributed 28.96% of the UK's total energy consumption in 2024 and is the leading energy source across every sector other than transport12. It heats most homes and also generates a large share of electricity, so a change in the gas price reaches a household by two routes. How that happens is covered in how the wholesale gas and electricity markets work and how global events move UK energy prices.
Importing energy does not mean supply is insecure. In a statement of 12 March 2026 on rising energy costs, the Welsh Government said: "The UK continues to have robust energy supplies."13 The risk the evidence describes is mainly about price. Physical shortage is the smaller concern, and the separate questions of margins and emergency arrangements are dealt with in electricity margins and supply shortfalls and gas supply emergencies.
The official record of how energy is used across industry, transport, homes and services is the government's annual Energy Consumption in the UK statistics14.
Around 60% of UK energy is imported, including gas from Norway and Qatar
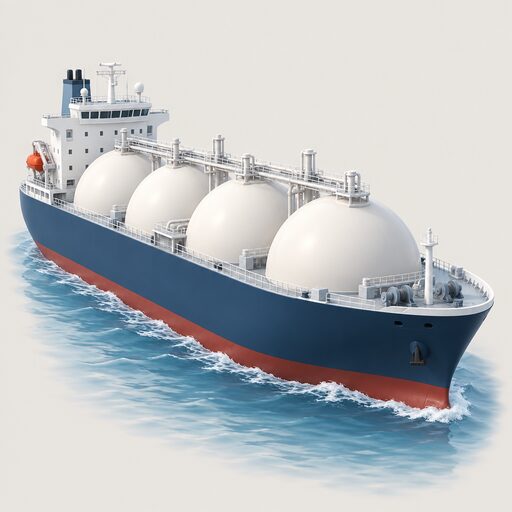
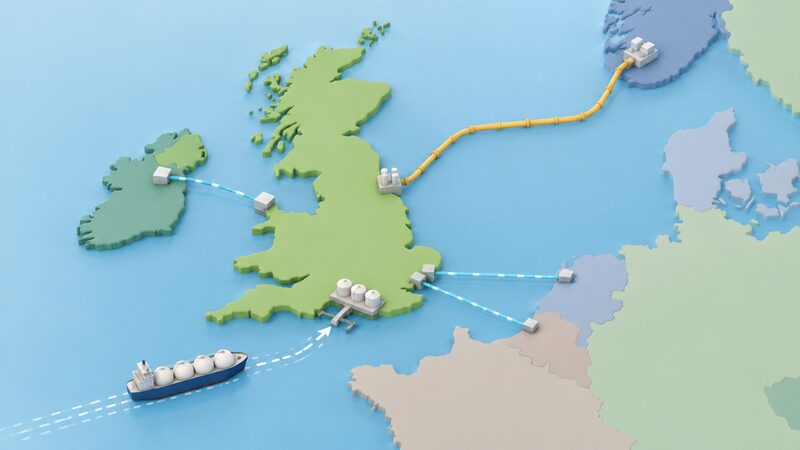
Norway is the dominant external supplier of both gas and oil. Approximately 60% of UK natural gas imports come from Norway and 30% from Qatar, and around half of UK crude oil imports also come from Norway, with just over 30% from OPEC2. Norwegian gas arrives by pipeline, and Carbon Brief describes UK gas as roughly half domestically produced, with the rest coming via pipeline from Norway, once liquefied natural gas is set aside15. Qatari gas arrives by ship in a liquid state16.
The published figures for how much of the UK's gas is imported do not agree. They were written at different dates and some are forecasts.
| Figure | What it measures | Date | Source |
|---|---|---|---|
| 47 per cent | Share of UK gas supply arriving by pipelines connected to Europe or as LNG | 2012 | Carbon Brief11 |
| Around 50% | Imported gas as a share of UK natural gas supply | Read April 2026 | Smart Energy GB3 |
| Roughly half | Share of remaining gas produced domestically, the rest from Norway by pipeline | March 2026 | Carbon Brief15 |
| 67% | Expected share of gas imported by 2025 (a projection in the Scottish energy strategy) | Projection for 2025 | Scottish Government17 |
The first three rows cluster around a half. The Scottish Government figure was a forward projection of decline in North Sea output, and no later official figure is available to confirm or replace it, so the documents simply disagree on this point17.
Descriptions of the main suppliers have changed over time. In 2021 the Energy and Climate Intelligence Unit named Norway, Belgium and Qatar as the UK's main gas suppliers, with Belgium acting as a pipeline route from the continent18. One consumer guide describes imports as coming "predominantly from Norway but also from Russia"16. Another lists the North Sea, Norway, the Middle East and North Africa19. The constant across all of them is Norway first, with LNG from the Gulf second.
Electricity is imported too. Total annual electricity imports rose by 31% to 43.7TWh in 2024, according to the government's statutory security of supply report20. That is why clean generation in 2024 is given as 58%, or 64% excluding imports: imported power is part of what the grid delivers, but it is not generated here5.
The physical routes are covered in detail in where Britain's gas comes from, LNG imports and UK terminals, gas pipelines and interconnectors, UK gas storage and electricity interconnectors.
The UK electricity mix: gas, wind, nuclear and solar in one grid
Every home connected to the network draws from the same pool of generation, whoever the supplier is. Which? gives the following breakdown for the year from April 2024 to March 2025, measured as electricity added to the National Grid21.
| Source | Share, April 2024 to March 2025 |
|---|---|
| Renewables | 42.1% |
| Natural gas | 33.3% |
| Nuclear | 16.2% |
| Coal | 5.9% |
| Other sources | 2.5% |
Nesta's breakdown of how UK electricity demand is met is cut differently: around 38% renewable sources, 15% nuclear, 7% biomass and 30% fossil gas22. Here biomass is listed separately from other renewables. That difference in categories is one reason published renewable shares vary.
The mix has changed a great deal over time. In 2010, around 75% of the UK's electricity was produced from coal and gas power stations. By 2023, around 60% came from zero-carbon sources including nuclear, wind and solar23. In 2012, gas generated 39.3% of UK electricity and renewables (wind, hydro and bioenergy) only 11.3%24. By 2019, renewables supplied 23% and nuclear 27%, together half of generation18. Nesta's 2022 heat pump analysis still assumed a grid with 40% of electricity generated from gas25. In early 2023, more UK electricity came from wind farms than from gas26.
Older summaries are still in circulation and can mislead. One guide to heat decarbonisation gives renewables at around 35% and nuclear at around 20% of generation, figures that match the grid of some years ago better than the 2024 data27.
In practice, gas generation still fills the gap when wind and solar output is low, so the gas price continues to influence the electricity price. How the system is held in balance from minute to minute is explained in balancing services and frequency response and grid inertia and system stability, and how firm capacity is paid for in the capacity market. The full breakdown by technology is in the UK electricity generation mix, and the story of coal's exit is in the end of coal power.
Renewables now supply around half of UK electricity
The highest current figure comes from the House of Commons Library, which puts renewables at 51% of UK electricity generation in 20244. Other published figures are lower.
| Renewable share | Basis | Source |
|---|---|---|
| 51% | UK electricity generation, 2024 | House of Commons Library4 |
| Over 47% | UK electricity generation in total | Uswitch guide, August 202616 |
| 43% | UK electricity supply | Uswitch guide, January 202619 |
| 42.1% | Electricity added to the National Grid, April 2024 to March 2025 | Which?21 |
| About 42% | UK power grid, estimated | Development Bank of Wales, October 202428 |
| Around 38% | UK electricity demand met, with biomass counted separately at 7% | Nesta, November 202422 |
The spread has three causes. The periods differ, since a calendar year, a financial year and an undated estimate will not match. The denominators differ: generation within the UK is smaller than total supply, which also includes imports, and the 58% and 64% clean-power figures for 2024 show how much that matters5. The categories differ as well, because biomass is sometimes counted inside renewables and sometimes beside them22. Figures at both ends of the range can therefore be correct.
Wind is the largest contributor. The Development Bank of Wales describes wind as the biggest contributor to the renewable share28, and Uswitch's statistics attribute 29.5% of UK energy production to wind power in 2024, within a renewable share of 42.3%29. Adding nuclear takes the low-carbon total higher. More than half of UK electricity was already produced by renewables and nuclear together in 202225. In May 2024, 55% of electricity came from zero-carbon sources26.
For a household, this means the electricity it uses is already about half renewable, and far more renewable than the gas supply. Any shift of heating or transport from gas or oil to electricity therefore moves consumption onto a supply that is increasingly generated in the UK. The consequences for the network are covered in rising electricity demand.
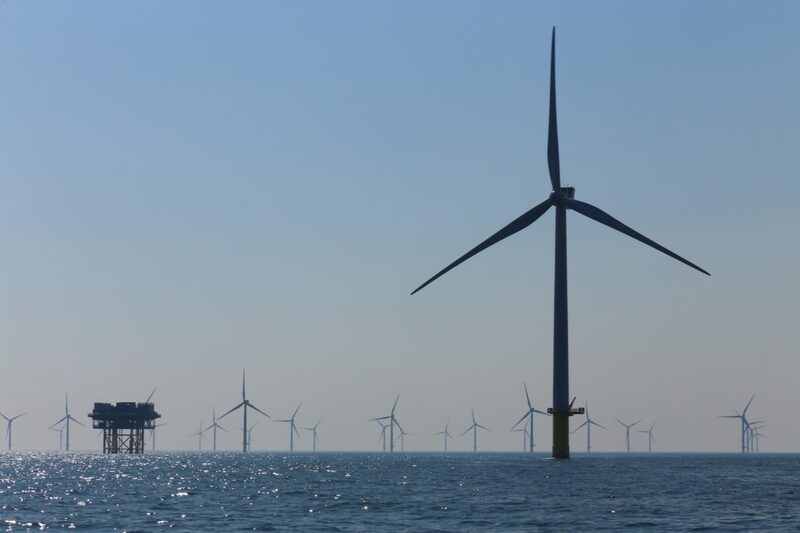
Offshore wind: the backbone of the future system, from 8.4GW in the latest auction towards 100GW
The Climate Change Committee describes the UK as having the second largest national offshore wind capacity in the world, and points to its expansion alongside the phase out of coal30. In the Committee's Seventh Carbon Budget, the Balanced Pathway has offshore wind growing six-fold, from 15 GW of capacity in 2023 to 88 GW by 2040. Onshore wind doubles to 32 GW over the same period31.
The targets have moved several times.
| Milestone | Offshore wind capacity | Origin |
|---|---|---|
| 2023 | 15 GW installed | Climate Change Committee31 |
| 2030 | 40GW | Prime Minister's pledge, cited by the Committee in December 202032 |
| 2030 | Up to 50GW | British Energy Security Strategy, April 202233 |
| 2030 | 50 GW | Target recorded by the Parliamentary Office of Science and Technology, January 202534 |
| 2040 | 88 GW | Balanced Pathway, Seventh Carbon Budget31 |
| 2050 | 100GW or more | Climate Change Committee, December 202032 |
Delivery runs through government auctions. The Department for Energy Security and Net Zero reports that the renewables auction in early 2026 secured 8.4GW of offshore wind overall35. That figure is contracted capacity still to be built and is not yet operating. The funding mechanism is explained in Contracts for Difference. The 2025 Spending Review also allocated £300 million of Great British Energy support for offshore wind supply chains over the review period36.
Capacity and output are different things. Welsh Government statistics evaluate the capacity factor for offshore wind in Wales at 33%, meaning a turbine fleet delivers on average about a third of its nameplate rating over a year37. This is why the system needs storage, interconnection and flexible demand alongside new wind farms. Those topics are covered in grid-scale battery storage, long-duration electricity storage, hydropower and pumped storage and negative electricity prices.
New wind farms also have to be connected to the network, which is the subject of the grid connection queue and the electricity transmission network. Output, regional patterns and the Scottish contribution are covered in wind power on the UK grid and energy supply in Scotland.
Nuclear's steady share: 41TWh and around 13 to 14% of generation
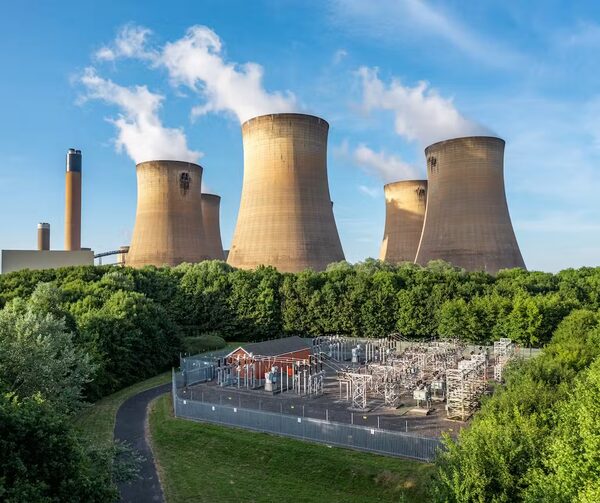
Nuclear stations generated 41 TWh in 2024. The sources give that as a share of between 13% and 14.25%, depending on the publisher.
| Period | Nuclear share or output | Source |
|---|---|---|
| 2004 | "a quarter of our electricity" | House of Commons debate38 |
| 2019 | 27% of electricity generated | Energy and Climate Intelligence Unit18 |
| 2023 | 14.2% | Parliamentary Office of Science and Technology34 |
| 2023 | 13.8% | Uswitch energy statistics12 |
| 2024 | 14% | House of Commons Library4 |
| 2024 | 14.25% | Uswitch energy statistics12 |
| 2024 | 41TWh, 13% | Carbon Brief5 |
| April 2024 to March 2025 | 16.2% of electricity added to the grid | Which?21 |
| March to May 2026 | 16.6% of generation by Major Power Producers, up 0.2% on a year earlier | Government Energy Trends39 |
The 16.6% figure is not comparable with the 13 to 14% figures. The Energy Trends number covers only Major Power Producers over a three-month period, which excludes much small-scale renewable generation and so raises nuclear's share39. The calendar-year shares of total generation are the more representative guide to nuclear's place in the mix.
Output fell in 2025. The Climate Change Committee's 2026 progress report records that nuclear generation dropped from 41 TWh in 2024 to 36 TWh in 2025, a 12% reduction "due to operational challenges at several reactors, particularly at Hartlepool"6. Nuclear output is steady from hour to hour, but it can be unreliable from year to year because the fleet is ageing.
The long decline was foreseen. In a Commons debate on 13 July 2004, MPs were told that over the following 20 years nuclear would fall from 22 per cent of generation to just 2 per cent without life extensions or new build38. The actual 2024 share of around 14% reflects life extensions that were subsequently granted. For households, nuclear's role is to supply low-carbon electricity that does not vary with the weather. It reduces the amount of gas burned for power but is not something a home can influence.
Biomethane: the renewable gas already flowing into UK homes
Biomethane is produced when organic material such as food waste, manure, sewage or crops is broken down. The gas network SGN states that it can be used for heating and cooking like natural gas40. It is injected into the existing gas network, so it reaches homes through the same pipes and meters and burns in the same appliances. That is the practical answer to whether it works in a normal gas boiler: nothing at the household end changes, and no household receives it separately from the blend in the pipe.
The Institution of Gas Engineers and Managers reported in May 2025 that there is "already enough biomethane flowing through our gas network with capacity to heat up to one million homes", and that 50TWh of biomethane would represent 14% of the UK's current gas demand41. Those two figures show both the scale of the fuel and its limits. One million homes is a large number, but set against the roughly 24.5 million homes supplied by mains gas27, biomethane is a partial substitute for natural gas and cannot replace it.
Feedstocks set the ceiling. The Climate Change Committee noted in 2015 that UK feedstocks largely come from agriculture, followed by food waste, with a smaller but growing share from sewage sludge42. All of these are produced domestically, so every unit of biomethane displaces gas that would otherwise be imported or extracted. SGN adds that deployment is particularly advantageous in rural areas, where fewer properties are connected to the main gas network40.
The reason for decarbonising gas is that natural gas accounts for 30% of current UK emissions, according to an Ofgem case study on hydrogen-heated homes43. Biomethane and hydrogen are the two candidate replacement gases, covered in biomethane and green gas and hydrogen in the gas grid. The pipes themselves are run by the companies described in gas distribution networks.
LPG and the off-grid homes: the closest alternative to mains gas
How many homes are off the gas grid
The counts vary by source and by geography.
| Figure | Coverage | Source |
|---|---|---|
| 4.8 million households, 16.0% of domestic properties | Great Britain, 2024 estimate | House of Commons Library8 |
| Four million households (15%) | UK | House of Commons Library44 |
| Some four million properties; 84% of properties connected | UK | Liquid Gas UK45 |
| Some two million properties; 84% of properties connected | UK | Liquid Gas UK46 |
| 85%, or about 24.5 million homes, on mains gas | UK | Energy Systems Catapult27 |
The trade body gives both two million and four million against the same 84% connection rate, and the two figures are not reconciled. The official estimates of four to 4.8 million are the firmer ones. These households heat with heating oil, LPG, solid fuels, mains electricity and microgeneration44. Around 1.5 million UK homes use oil, including many in Northern Ireland, and around two hundred thousand use LPG47. Liquid Gas UK gives the LPG figure as 193,000 homes45.
What LPG is and how supply works
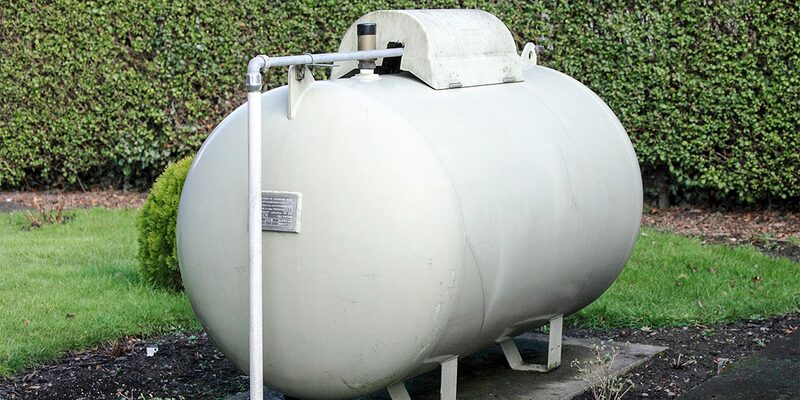
LPG stands for Liquefied Petroleum Gas, a term covering both propane and butane. It is a by-product of natural gas processing and crude oil refining. It is a gas at normal temperature and pressure and turns to liquid under modest pressure or cooling48. The main difference from mains gas is that it is delivered by road and stored in a tank at the property47. It fuels the familiar gas appliances: central heating boilers, gas fires, ranges and cookers46.
The trade body states that tanks can be buried, that telemetry can alert the supplier when fuel is low, and that a tank can stay on site for up to 30 years against 15 to 20 years for an oil tank46.
Cost and carbon
| Point | What the sources say |
|---|---|
| Running cost | "LPG is the most expensive of the three fuel types" (gas, oil, LPG), Energy Saving Trust50. OFTEC calls it one of the most expensive heating fuels51 |
| Price | Average 57p per litre in July 2025, per Sutherland Tables. A litre converts to 7.1kWh47 |
| Installation | Liquid Gas UK states that installation is significantly cheaper than electric, oil and air source heat pump systems46 |
| CO2 against oil | 12% less, per Liquid Gas UK46. "Slightly lower", per OFTEC51 |
| CO2 against coal | 35% less on one Liquid Gas UK page46, 33% less on another49 |
| Contracts | The tank is usually owned by the gas supplier, an annual rental charge applies and homeowners are usually tied into long contracts51 |
Which? notes that LPG remains a fossil fuel that produces carbon dioxide when burnt47. The evidence does not support LPG being cheaper to run than oil.
In terms of independence, LPG replaces dependence on a pipe with dependence on a delivery lorry, a tank the household does not own and a supplier contract. When prices spiked, off-grid homes in Great Britain received £200 through the Domestic Alternative Fuel Payment from February 202352. Supply chains are covered in heating oil and LPG supply. For homes weighing a mains connection, see getting a new gas connection.
What the average household actually uses: around 2,500 to 3,955kWh of electricity a year
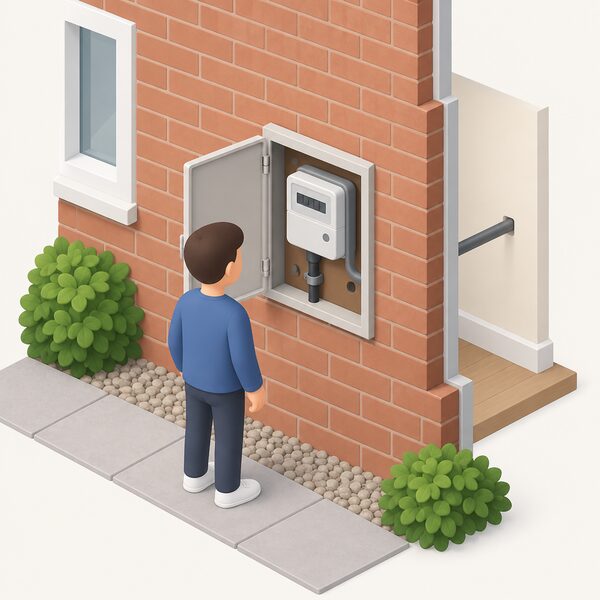
Two figures are in circulation and they are far apart. Ofgem's 2024 update to its household archetypes gives average annual electricity consumption of 3,955 kWh across all Great Britain households9. A guide from the energy supplier Fuse Energy states that the average UK home uses around 2,500 kWh of electricity per year, equivalent to roughly 6.8 kWh per day53.
Neither document explains the gap. Ofgem's figure is an average over nearly 27 million households of every type. The supplier's is a single headline figure with no method shown. Where a figure matters for a decision, the Ofgem one is the official statistic. The 6.8 kWh daily figure is tied to the lower annual number, so a household consuming at Ofgem's average level would use more per day than that.
Local variation is large. The official source for consumption statistics in Great Britain is the Department for Energy Security and Net Zero, and its figures sit behind the local domestic electricity consumption indicator published by the Office for National Statistics54. A household's own number depends on its heating fuel, its occupancy and whether it charges a vehicle. These are the same factors that determine whether its existing connection is adequate, a subject covered in getting a new or upgraded electricity connection and whether a house needs a three phase supply.
What this means for household energy independence
The household's position is set out in one statistic: gas and oil account for 78% of household energy costs, and 47% of that gas and oil relies on imports7. Most heating in the UK is supplied by gas55. The largest share of a typical home's energy spending therefore depends on fuels whose prices, as the Energy and Climate Intelligence Unit puts it, are often dictated by international markets10.
Government policy has framed the response in terms of independence. The British Energy Security Strategy of April 2022 set out how Great Britain would "accelerate homegrown power for greater energy independence".
"This strategy sets out how Great Britain will accelerate homegrown power for greater energy independence."
The Climate Change Committee's assessment of the Heat and Buildings Strategy reaches the same conclusion from the household side. It finds that reducing energy needs and shifting demand from gas to electricity would help protect consumers from future price spikes and increase energy security. The reason is that electricity "in future will be predominantly supplied from UK-based renewable generation"57.
A supplier's fuel mix does not change where a household's electricity physically comes from. Uswitch reports that British Gas had 35% renewables in its overall fuel mix for April 2024 to March 2025. Good Energy states that all its electricity tariffs are powered by 100% renewable energy generated in the UK by independent producers58. These are contractual and accounting positions, and every home on the network draws from the same pooled grid.
Several dependences remain even for a home that generates its own power. It still relies on the grid connection, on a supplier for billing and export payments, and on the network operator for restoration after faults. What a home can and cannot control is set out in energy security and household independence. The part households can play in balancing the system is covered in household demand flexibility.
The road to net zero and how the supply mix will change
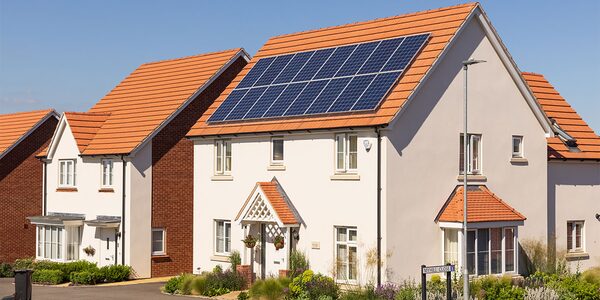
The UK's legal goal is net zero emissions by 205059. For electricity the target date is earlier: the 2021 Net Zero Strategy set an ambition for a fully decarbonised power sector by 203560. The energy sector was responsible for about 35 per cent of UK emissions a decade ago, which is why it was first in line61.
Progress so far has been mostly on the electricity side. Around 50% of electricity now comes from zero-carbon sources19, and emissions from coal generation were zero in 20256. The next stage, in the Climate Change Committee's pathway, is the large expansion of wind described above, with offshore capacity reaching 88 GW and onshore 32 GW by 204031. In Great Britain the Strategic Spatial Energy Plan will set out a long-term view of what energy sources are needed and their optimal locations on a zonal basis from 2030 to 205062.
On cost, the Climate Change Committee concluded in March 2026 that across all the scenarios it examined, achieving net zero was "a more cost-effective path for the UK economy than continued reliance on fossil fuels"63. That is a finding about the whole economy and does not predict any individual household's bill.
For homes, the direction of change is that gas, which dominates heating now, is planned to have a shrinking role, while electricity carries more of the load for heat and transport. Electricity supply will be increasingly generated in the UK. Gas supply will continue to rely on Norway, LNG cargoes and a declining North Sea. Households that remain on gas, oil or LPG stay exposed to those markets.
The rest of the system: networks, storage, markets and the four nations
Supply involves wires, pipes and the organisations that run them, as well as fuel. Energy UK, the trade association for suppliers and generators, says its members deliver nearly 80% of the UK's power generation and over 95% of the energy supply for 28 million UK homes64. The networks between the generators and those homes are separate regulated businesses.
- System operation: NESO, the National Energy System Operator, with its seasonal assessments explained in the NESO winter and summer outlooks. The distinction from the network owner is set out in NESO vs National Grid.
- Electricity networks: the transmission network and the distribution networks, and how their costs reach bills in TNUoS, BSUoS and network charges. To identify a local operator, see who is my distribution network operator.
- Gas networks: National Gas Transmission and the regional gas distribution networks, with storage covered in Rough, Britain's largest gas storage site.
- The nations: arrangements differ in Scotland, Wales and Northern Ireland. Northern Ireland has its own system operator, SONI, and its own network company, NIE Networks.
Several of the figures on this page cover Great Britain only, including the 4.8 million off-gas-grid households, the 3,955 kWh consumption average and the Alternative Fuel Payment. Northern Ireland, with its heavy reliance on heating oil, is counted separately8.
Sources64 cited
- Spring Statement 2022, HM Treasury, March 2022
- Which energy suppliers are British?, Uswitch, 26 June 2026
- Supporting energy security, Smart Energy GB, 8 April 2026
- Commons Library debate pack CDP-2025-0128, House of Commons Library, 2025
- Analysis: UK's electricity was cleanest ever in 2024, Carbon Brief, 2024
- Progress in reducing emissions: 2026 report to Parliament, Climate Change Committee, 2026
- Electric vehicles and heat pumps reduced UK fossil fuel consumption, Ember, 21 October 2024
- Households off the gas grid, research briefing CBP-9838, House of Commons Library, 2024
- Ofgem energy consumer archetypes update 2024, final report, Ofgem, February 2024
- Household energy: buying British, Energy and Climate Intelligence Unit, 15 April 2024
- Checking five claims in the Sun's vision of Britain's energy sector, Carbon Brief
- UK energy statistics, Uswitch, 17 December 2025
- Written statement: rising energy costs, response to conflict in the Middle East, Welsh Government, 12 March 2026
- Energy consumption in the UK 2025, Department for Energy Security and Net Zero, 25 September 2025
- Factcheck: nine false or misleading myths about North Sea oil and gas, Carbon Brief, 25 March 2026
- Where does my energy come from?, Uswitch, 3 August 2026
- Scottish Energy Strategy: the future of energy in Scotland, Scottish Government
- What's in my energy bill?, Energy and Climate Intelligence Unit, 1 September 2021
- Heating fuel guide, Uswitch, 27 January 2026
- Statutory security of supply report 2025, Department for Energy Security and Net Zero, 17 December 2025
- Are electric heaters eco-friendly?, Which?, 2024
- What's in an energy bill: wholesale costs, Nesta, 22 November 2024
- The best heating for your home, Which?
- The challenge of shifting peak electricity demand, Nesta
- How heat pumps can help tackle the energy crisis, Nesta, 25 October 2022
- Common misconceptions about electric cars, Zapmap
- Decarbonisation of heat guide, Energy Systems Catapult, 27 June 2025
- Home energy efficiency: key terms explained, Development Bank of Wales, 17 October 2024
- UK renewable energy statistics, Uswitch, 2024
- Progress in reducing emissions: 2025 report to Parliament, Climate Change Committee, 25 June 2025
- The Seventh Carbon Budget, Climate Change Committee
- Building back better: raising the UK's climate ambitions for 2035, Climate Change Committee, 9 December 2020
- Major acceleration of homegrown power in Britain's plan for greater energy independence, UK Government, April 2022
- POSTnote 736, Parliamentary Office of Science and Technology, 6 January 2025
- DESNZ annual report and accounts 2025 to 2026: performance report, Department for Energy Security and Net Zero, 2026
- Spending Review 2025, HM Treasury, 30 June 2025
- Energy generation in Wales 2023, Welsh Government, March 2025
- Microgeneration debate, House of Commons, UK Parliament (Hansard), 13 July 2004
- Energy trends and prices statistical release, 30 July 2026, Department for Energy Security and Net Zero, 30 July 2026
- Biomethane, SGN, 2026
- The role of biomethane in reaching net zero, Institution of Gas Engineers and Managers, May 2025
- The green gas coming to a pipe near you, Climate Change Committee, 8 June 2015
- Case study: UK hydrogen-heated homes of the future, Ofgem, 29 July 2021
- Research briefing SN05806: households off the gas grid, House of Commons Library, 17 September 2026
- LPG in the home, Liquid Gas UK, 20 September 2026
- New to LPG, Liquid Gas UK, 20 September 2026
- LPG central heating, Which?, 22 September 2025
- FAQ: what is LPG?, Liquid Gas UK, 20 September 2026
- About LPG: what is LPG?, Liquid Gas UK, 20 September 2026
- Boilers advice, Energy Saving Trust, 20 May 2026
- What heating options are available off the grid?, OFTEC, 20 September 2026
- Households off the gas grid to receive energy bill support, UK Government, 6 February 2023
- Price per kWh in the UK, Fuse Energy, 8 July 2026
- Domestic electricity consumption indicator, Office for National Statistics, 18 December 2025
- Research briefing CBP-9340, House of Commons Library, January 2022
- British Energy Security Strategy, UK Government, 7 April 2022
- Independent assessment: the UK's Heat and Buildings Strategy, Climate Change Committee, 16 March 2022
- Green energy suppliers and tariffs, Uswitch, 4 September 2026
- POSTnote 655, Parliamentary Office of Science and Technology
- Government's Net Zero Strategy is a major step forward, CCC says, Climate Change Committee, 26 October 2021
- Low-carbon policies could cut household energy costs after 2030, Carbon Brief, 10 December 2014
- Tackling fuel poverty in Scotland: periodic report 2021 to 2024, Scottish Government, 1 April 2025
- Cost of net zero by 2050 less than a single fossil fuel price shock, Climate Change Committee, 11 March 2026
- Energy UK explains: the Clean Heat Market Mechanism, Energy UK, 23 January 2024