

In this guide
Great Britain has eight gas storage facilities, with a maximum storage capacity of 3.2 billion cubic metres and a maximum deliverability of 117 million cubic metres per day. In winter 2024/25, gas storage provided 8% of total demand on the national transmission system1. The familiar shorthand is that Britain can store about fourteen days' supply, the equivalent of roughly four per cent of the country's annual consumption, and that it holds less gas storage relative to its consumption than any other major European economy2.
Those numbers need scale beside them. UK gas demand in 2024 was 687 terawatt hours, of which 37% was domestic, 26% went to electricity generation and 19% to industry. That was 37% below demand in 2010 and the lowest level since the early 1990s3. Against that demand, Britain's working store is a thin buffer rather than a strategic reserve, and the system leans instead on very large import capacity: around 368 million cubic metres per day, or 134 billion cubic metres per year1.
For a household, the practical meaning is narrow but real. Storage does not decide the price on a bill, and the Government has stated plainly that gas storage capacity has little bearing on the price of gas4. What it does is help the network deliver enough gas on the coldest days, when demand from almost 24 million homes using gas peaks at once. Beyond that, the buffers a household can actually control sit elsewhere: insulation, a hot water cylinder, a battery, or not being on gas at all.
About fourteen days of supply, and what that figure hides
The "fourteen days" figure is a volume comparison: total working gas divided by average daily use2. It is useful for showing how Britain differs from its neighbours, and misleading if read as a countdown clock. Three things complicate it.
First, demand is not flat. Domestic heating dominates the winter peak, and estimates of heating's share of UK gas use range from around 37.5% for home heating specifically5 to around half of UK gas use for heating in all its forms6. A store sized against average demand covers far fewer days of genuine cold.
Second, deliverability constrains the store more than volume does. The 117 million cubic metres per day maximum is the rate at which all eight sites together can push gas back into the system at full tilt1. A large seasonal store full of gas that can only be withdrawn slowly is no use in a two-day freeze.
Third, storage was never intended to be the main line of defence. Britain's security of supply rests on production and imports: the UK Continental Shelf and the Norwegian Continental Shelf make up 43% and 35% of gross annual gas supply respectively on a five-year average, with liquefied natural gas shipments supplying 21%1. Storage is the last few per cent, and it behaved that way in winter 2024/25 at 8% of transmission demand1. More on the upstream picture is set out in where Britain's gas comes from and LNG imports and UK terminals.
Capacity: roughly 4% of annual consumption
Four per cent of annual consumption is the ratio that sets Britain apart2. Continental storage was sized to hold months of gas because continental gas travelled thousands of kilometres by pipeline from a small number of producers, and interruption anywhere on that route mattered. Britain sat on its own fields and could open the taps in January.
That logic has weakened as UK production has fallen without storage growing to compensate. Estimates of how much gas Britain now imports vary with the year and the method used, and the available figures differ:
| Measure | Figure | Period |
|---|---|---|
| Gas produced domestically, of gas used in the UK | roughly half7 | 2026 |
| Imported gas as a share of natural gas supply | around 50%8 | 2026 |
| UK share of total gas demand met by domestic production | around 50%9 | 2025 |
| Expected imports from outside the UK | 67%10 | 2025 projection |
The Scottish Government projection of 67% imports by 2025 sits well above the roughly half reported elsewhere10. Both are in circulation; the difference turns on whether gas is measured gross or net of exports and re-exports, and on the year chosen. What is not in dispute is the direction: an economy importing at that scale with four per cent storage is depending on the continuity of shipping lanes, interconnectors and pipelines rather than on stock in the ground.
Demand has fallen alongside production, which softens the ratio. Gas demand of 687 TWh in 2024 was 37% below 20103, although domestic natural gas consumption rose 4.1 per cent to 21.8 mtoe in 202411, a cold-year rebound rather than a trend break.
The eight sites, and the shape of what is left
Great Britain's eight gas storage facilities are commercially owned assets of very different kinds, and they cannot be treated as interchangeable1. The dominant historical asset was Rough, a depleted field in the southern North Sea, which was reported in 2018 as the UK's main gas storage site and set to close12. Its treatment since, including partial reopening and the terms on which it has operated, is covered separately on Rough, Britain's largest gas storage site.
The loss of Rough's full seasonal capability is the single reason Britain's ratio sits where it does. What remains is weighted towards medium-range and fast-cycle sites: smaller in volume, faster to withdraw, and better suited to managing a cold snap than a cold quarter. That shifts the character of the whole system. Britain is now equipped to ride out days, and relies on markets to supply months.
The gas network those stores feed is not only domestic. It serves 67,000 industrial sites and nearly half a million commercial sites across the country, alongside households13. When storage deliverability is stretched, the pressure is felt across all of them, and the sequence by which supply is protected is described in gas supply emergencies.

Storage types: above-ground tanks and underground stores
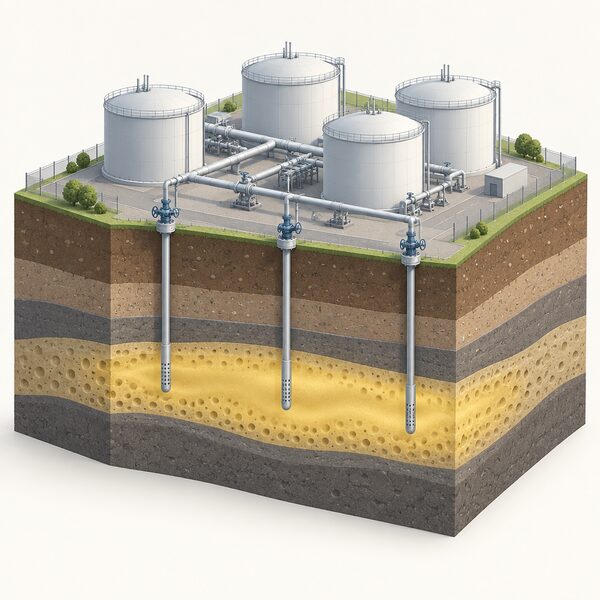
Gas is stored in above-ground tanks and underground, in depleted oil and gas fields, water aquifers and salt caverns2. Each type trades volume against speed.
- Depleted oil and gas fields. The largest volumes, using reservoirs that already held hydrocarbons. Injection and withdrawal are slow, so these are seasonal stores: filled across summer, drawn across winter.
- Water aquifers. Porous rock formations converted to storage duty. Similar in behaviour to depleted fields, and costly to establish because a gas cushion must first be created.
- Salt caverns. Voids solution-mined from salt beds. Much smaller, but able to inject and withdraw repeatedly within a season, which is what a system managing short cold spells needs.
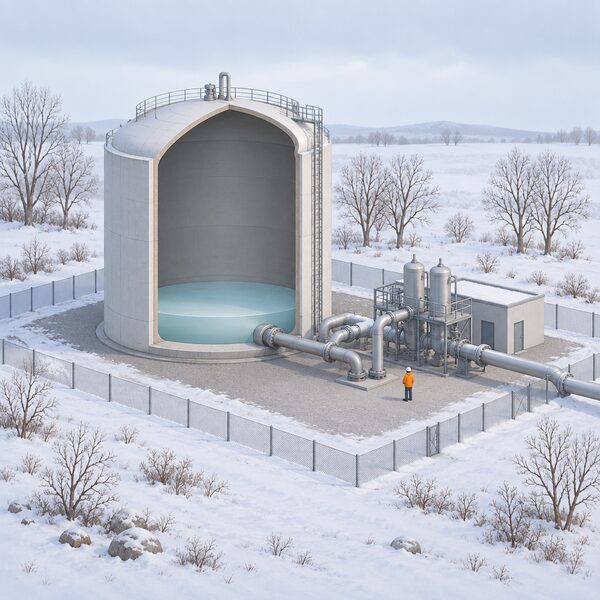
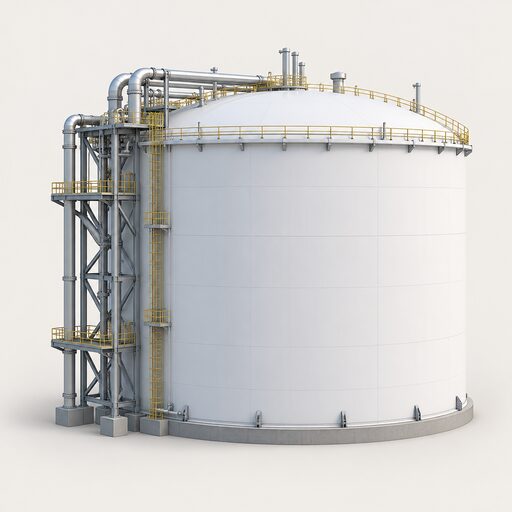
- Above-ground tanks. Principally liquefied natural gas held at import terminals, where gas arrives already chilled to a liquid and is regasified into the network.
Household-scale storage runs on quite different rules and different gases. The two forms of liquefied petroleum gas generally available in the UK are commercial butane and commercial propane14. Bulk tanks and their pipework connecting the system to a combustion appliance should be designed, constructed and installed in accordance with the UKLPG Code of Practice 1: Bulk LPG Storage at Fixed Installations, with below-ground tanks following Part 4 on buried and mounded vessels. Simplified guidance covers propane installations, above or below ground, of not more than 2 tonnes (4,500 litres) overall capacity, and tanks in excess of 4 tonnes are uncommon in domestic applications14. Off-grid supply is dealt with in heating oil and LPG supply.
Thermal storage is the other household-scale case worth naming: hot water storage tanks range from a few hundred to tens of thousands of litres in size15. A cylinder is not gas storage, but it is the mechanism by which a home can move heat demand off the peak.
Storage levels: 10 per cent full against 49 per cent a year earlier
Storage levels are read wrongly more often than almost any other energy statistic. In late March 2013, UK storage facilities were reported as "only 10 per cent full", compared with 49 per cent at the same point the previous year2. Headlines treated this as Britain nearly running out. It was not that.
Stores are meant to be low at the end of winter. That is their function: fill in summer when gas is cheaper, empty across the heating season. A March reading measures how hard the winter just past drew on the stock, not how much cover remains for a winter to come. The 2013 figure reflected a long, cold spring; the 2012 figure a mild one.
"storage facilities are 'only 10 per cent full', compared to 49 per cent this time last year"
What a low end-of-winter level does signal is the cost of the refill. Operators must buy summer gas to inject, and if European stores are also empty, every buyer competes in the same market at the same time. That is the channel through which storage levels reach a household bill, and it is indirect. Europe held record levels of gas in storage in winter 2023/2416; by February 2025 Europe was coming out of winter with far lower levels of gas storage compared to recent years17, and EU storage at the end of winter 2024/25 was around 34% full18. Those swings moved wholesale prices across the continent, Britain included, because Britain buys in the same market whatever its own stock position. How that transmission works is set out in how global events move UK energy prices.
Why Britain stores less than any other major European economy
Britain has less gas storage relative to its consumption than any other major European economy2. Three forces produced that outcome, and none of them was a single decision.
The first is geology and history. North Sea production gave Britain a swing supply on its own doorstep for three decades. Countries without that advantage, buying through long pipelines, bought insurance in the form of storage instead.
The second is the market structure. Storage in Britain earns money from the spread between summer and winter gas prices. When that spread narrows, filling a store stops paying, and building a new one stops being financeable. The volume is therefore set by commercial arithmetic rather than by a security target.
The third is the scale of the alternative. With import capacity of around 368 mcm/d, or 134 bcm/y1, and a supply mix of 43% UK Continental Shelf, 35% Norwegian Continental Shelf and 21% liquefied natural gas on a five-year average1, Britain has chosen import optionality over stock. That works where terminals, ships and pipelines are available. It exposes the system where they are not.
Diversity of counterparties has genuinely improved the risk. Five countries accounted for the vast majority of imports to 2017: Norway, the Netherlands, Belgium, Qatar and Algeria12. Russian exposure has been small throughout: much less than 1% of UK supplies in 201812, with other assessments putting reliance at 3 to 4% of UK consumption19, 4% of total use20 and 4% of our gas21 around 2022. That is a different vulnerability profile from Germany's before 2022, and it explains why British debate concerned price rather than physical cut-off.
One further counterpoint sits in the record: UK gas prices for businesses have been reported as lower than those in comparable European countries22. Low storage has not automatically meant high gas cost.
Who pays for storage
Storage in Britain is commercially owned and operated, and its filling is a trading decision. That is the structural fact behind everything above. The Government's stated position in September 2021 was that it was "confident that the UK's security of energy supply is secure now and over the winter", and that gas storage capacity has little bearing on the price of gas4.
Two things follow for a household. Storage capacity will not expand because a winter looked uncomfortable; it expands when the summer-to-winter spread, or a support mechanism, makes it pay. And the buffer that exists is sized for system operation, not for consumer price protection. The price a household pays is set in wholesale markets described in how the wholesale gas and electricity markets work, and those markets respond to European storage levels as readily as to British ones18.
Pumped storage and batteries: the electricity-side counterpart
The storage story on the electricity side runs in the opposite direction to gas: growing fast, from a small base, at gigawatt scale.
Pumped storage can generate electricity in quantities of gigawatts and deliver it very quickly23. The United Kingdom has around 2.8 GW of existing pumped hydropower storage, with the majority contributed by Ffestiniog and Dinorwig24, and the two operational pumped hydropower sites in Wales hold approximately 11 GWh of storage capacity25. Energy, not power, is the limiting quantity: total GB electricity storage was under 30 GWh as recently as 202226, against gas storage of 3.2bcm1. The two are not comparable in kind, but the contrast in duration is the point. Gas stores weeks of energy slowly; electricity stores hours of it instantly.
| Technology | Capacity | Period |
|---|---|---|
| UK pumped hydropower storage | 2.8 GW24 | 2022 |
| Pumped hydro storage capacity in Wales, two sites | approximately 11 GWh25 | 2023 |
| GB electricity storage, all types | less than 30 GWh26 | 2022 |
| UK grid-scale battery power capacity | 7.5 GW27 | end 2025 |
| New battery capacity energised in one year | 2.3 GW27 | 2025 |
| Utility-scale battery storage, projected | 33 GW28 | 2035 projection |
Grid-scale battery storage reached 7.5 GW of power capacity by the end of 2025, with a record 2.3 GW energised in 2025 alone27, and Solar Energy UK projects 33 GW of utility-scale battery storage by 203528. That build-out is examined in grid-scale battery storage, with the pumped hydro fleet covered in hydropower and pumped storage and the longer-duration question in long-duration electricity storage.
What limited gas storage means for a household

Storage sits entirely outside a household's control. It is owned by companies, filled on a trading judgement, and drawn on by a system operator. No domestic measure changes it, and no household is told when it is low.
What a household can influence is its own exposure to the gas system that storage supports. Around 85% of UK homes use gas for heating29, and almost 24 million homes use gas30. Gas is also the single greatest source of UK electricity at 36%31, so even an all-electric home carries indirect gas exposure through the generation mix.
Household-level buffers remain small. Home battery storage ownership among GB energy consumers was 2% in an Ofgem consumer survey conducted between 19 August and 17 September 202132. A hot water cylinder, ranging from a few hundred to tens of thousands of litres in the general thermal storage category15, does more for demand shifting than for independence.
The honest framing is this. Four per cent of annual consumption in storage2 means Britain's gas security is a security of flow, not of stock: pipelines from Norway, liquefied natural gas cargoes, and interconnectors, all priced in an international market. A household that reduces gas demand reduces its share of that dependence permanently, which no volume of national storage can do. A household that keeps a gas boiler retains a dependence on imports, a supplier and a wholesale price, and gains from storage only the eight per cent of winter transmission demand it happened to cover in 2024/251. The wider picture is set out on the UK energy supply pillar and in energy security and household independence.
Sources32 cited
- Statutory Security of Supply Report 2025, GOV.UK, 17 December 2025
- Is the UK's limited gas storage capacity a problem?, Carbon Brief, 25 March 2013
- Gas demand and supply research briefing, House of Commons Library, 2025
- Your top 5 questions on energy prices answered, GOV.UK, 24 September 2021
- How heat pumps can help tackle the energy crisis, Nesta, 2021
- Analysis: UK carbon emissions fell 9% in 2014, Carbon Brief, 4 March 2015
- Factcheck: Nine false or misleading myths about North Sea oil and gas, Carbon Brief, 25 March 2026
- Supporting energy security, Smart Energy GB, 8 April 2026
- Renewable energy in the UK, ECIU, 14 February 2025
- Scottish Energy Strategy: the future of energy in Scotland, Scottish Government
- Energy Consumption in the UK 2025, GOV.UK, 2025
- Factcheck: Less than 1% of UK gas supplies come from Russia, Carbon Brief, 16 March 2018
- Why gas networks remain central to the UK's energy security, IGEM, January 2026
- Building standards: liquefied petroleum gas storage, Scottish Government, 1 March 2017
- Thermal energy storage, Solar Heat Europe, 28 January 2025
- Energy bills: how households could feel the cold this winter, UKERC, 2 November 2023
- Energy UK explains: April 2025 price cap rise, Energy UK, 20 February 2025
- Summary of changes to the energy price cap, 1 July to 30 September 2025, Ofgem, 2025
- Ukraine conflict and impacts on UK energy, ECIU, 28 February 2022
- The energy price crisis: issues for energy use, CREDS, 2022
- Energy security starts at home: top 10 facts, E3G, 22 March 2022
- UK climate action has reduced emissions without increases in household energy bills, Climate Change Committee, 16 March 2017
- How does storage help us balance the grid?, NESO, 17 September 2026
- Energy generation in Wales 2021, Welsh Government, October 2022
- Energy generation in Wales 2023, Welsh Government, February 2025
- Future Energy Scenarios documentation, NESO, July 2022
- Clean Flexibility Roadmap, July 2026 update, GOV.UK, July 2026
- Economic Impact of Solar and Battery Storage, Solar Energy UK, April 2025
- Government increases Boiler Upgrade Scheme budget by £50m, ECIU, 3 October 2024
- Taxpayers facing £18 billion bill for failure to insulate UK homes, ECIU, 20 September 2022
- Net zero: solution to the gas crisis, Energy UK, 27 October 2022
- Consumer Survey 2021: decarbonisation and home energy use, Ofgem, 2021
 Hydropower and Pumped StorageExplains the UK's conventional hydro fleet, concentrated in Scotland and Wales, and the pumped storage schemes that store energy at scale.
 LNG Imports and TerminalsHow much of Britain's gas arrives by ship, where does it come from, and why does a damaged plant in Qatar or a storm of bidding in Asia change what a household pays?
 Grid-Scale Battery StorageConnected and pipeline battery capacity in Great Britain, what these assets are paid to do, how long they can run, and how grid batteries differ in purpose and scale from a home battery.
 Where Britain's Gas Comes FromWhere does the gas in British homes actually come from, and how much of it is ours?
 The Full Where Our Energy Comes From GuideWhere does the gas in your boiler and the electricity in your sockets actually come from?
 The Full Statistics GuideHow many homes in the UK have solar panels, heat pumps or batteries?