

In this guide
The UK electricity capacity margin is the gap between the de-rated capacity available to the grid and the demand expected at peak. It is not a single published number but a family of assessments, and the one that matters most is the statutory security of supply report, which sets out whether the margin is adequate for the winters ahead. The Capacity Market exists to secure Great Britain's electricity supply at least cost to consumers, and it is the mechanism through which that margin is bought1.
The margin has narrowed over the past decade. Where it once sat around 14 per cent, the de-rated figure now sits just over 4 per cent in the assessments that matter for system stress. That is a measure of tightness, not a forecast of blackouts. When the gap narrows further, the system operator issues escalating notices to the market, moving from an electricity margin notice through capacity market notices and, at the extreme, to emergency measures. Households are not the audience for those notices.
What follows explains how the margin is calculated, why it fell, what the notice sequence looks like, and what a thin margin does and does not mean for a home. It also sets out the costs that flow from a tight system, because those appear on bills rather than in headlines.
What the capacity margin is and why it matters
The capacity margin is the difference between the electricity the system can reliably call on and the electricity it expects to need. The word "reliably" carries the weight. A wind farm rated at 100 MW does not count as 100 MW of firm capacity, because the system operator cannot guarantee it will be generating at the moment of peak demand. Each plant is therefore counted at a de-rated value, reflecting its expected availability at times of stress. The margin is built from those de-rated figures, not from nameplate totals.
The Capacity Market is the instrument that buys this firm capacity. Its stated purpose is to ensure security of Great Britain's electricity supply at least cost to consumers1. It does this by holding auctions years ahead of delivery, paying successful participants to be available when called. That is why the margin is not simply a weather forecast: it is a contractual position, backed by payments.
Why it matters is straightforward. A margin that is comfortable means the system can absorb a plant outage, a still, cold evening, or an interconnector failure without reaching for emergency tools. A margin that is thin means those events eat into the buffer quickly. The statutory security of supply report is the government's annual assessment of whether the buffer is adequate, and it is the document to read if the question is whether the lights stay on1.
The margin also interacts with the wider generation mix. Solar power supplied 4.9% of UK electricity in 2023, and domestic solar comprised 30% of UK solar capacity at the start of 2026, with 84% of total UK solar installations2. That distributed capacity is real, but much of it is not visible to the distribution network operators: in 2022, the Energy Networks Association reported that around 20% of small-scale electricity generation capacity was invisible to them5. A margin calculated at transmission level does not see all of that.
The margin's decline: from 14 per cent to just over 4 per cent

The headline story of the past decade is a margin that has roughly halved and then halved again. Where the de-rated margin once sat around 14 per cent, it now sits just over 4 per cent in the assessments used for system stress. That is the figure to hold on to, and it is the one that drives the notice sequence described below.
The decline is not a single event but the product of several changes arriving together. Coal closed, removing a large block of firm, dispatchable capacity. Renewables grew, adding energy but at lower de-rated values. Demand patterns shifted, and the system became more dependent on interconnectors and on gas plant running when needed. Each of those changes is defensible on its own; together they compress the buffer.
The evidence of a tighter system shows up in the curtailment figures. The proportion of potential annual wind generation that was curtailed rose from 8% to 13% in 2024/253. Curtailment is what happens when the grid cannot move or use the power being generated, and it is a symptom of constraint rather than of shortage. It tells you the network, not the generation fleet, is the binding limit at those moments.
Storage is the other side of the ledger. Great Britain had less than 30 GWh of electricity storage as of July 20226. That is a small buffer relative to the scale of the system, and it is why the margin depends so heavily on plant availability and interconnector flows rather than on stored energy.
The margin's decline is therefore best understood as a change in the composition of the buffer, not simply its shrinkage. The system has more energy and less firm capacity, and it manages the difference through markets, notices and, increasingly, constraint payments.
Why the margin narrowed
Four forces narrowed the margin, and they are worth separating because they call for different responses.
The first is the retirement of coal. The end of coal power removed a block of capacity that could be called on regardless of weather. What replaced it was a mix with lower de-rated values, so the same installed megawatts deliver less firm capacity.
The second is the growth of variable renewables. Wind and solar are cheap energy but they are counted at reduced values in the margin. The curtailment figure, up from 8% to 13% of potential annual wind generation in 2024/25, shows that the constraint is often about moving power rather than making it3.
The third is grid congestion. Constraint payments currently cost over £1 billion and are set to rise to £2 billion in the mid-2020s2. These are payments made to generators to reduce output when the network cannot carry it, and they are a direct cost of a grid that has not kept pace with where generation is built.
The fourth is the pace of build. Simple capacity limits within the construction industry mean it is not feasible to carry out this volume of building upgrades to all dwellings all at once7. The same constraint applies to network and generation build: the queue and the workforce set the speed, not the ambition. Great British Energy has £4.0 billion of additional loans and equity capacity announced this Parliament, which is a funding commitment rather than a completed build8.
Shortfall notices: what they are and when they are issued
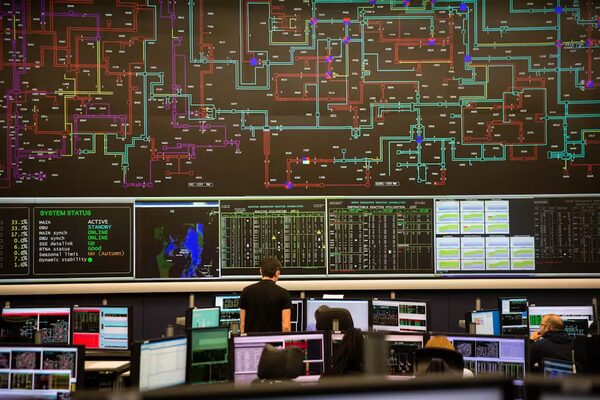
Shortfall notices are the system operator's escalating signals to the market when the gap between available capacity and forecast demand narrows. They are not household instructions. They are addressed to generators, suppliers and large users, and they ask participants to make capacity available or to reduce demand.
The sequence runs from an electricity margin notice, issued when the margin is expected to be tight but manageable, through capacity market notices, which formally call on capacity market participants, to the point at which emergency measures are considered. Each step is designed to be taken early enough that the next one is not needed. The notices are a market mechanism, and their purpose is to move the system back to comfort before any controlled disconnection is contemplated.
There is no single published trigger figure for a shortfall notice. The decision depends on the forecast margin, the weather, plant availability and interconnector flows on the day. That is why the notices are issued on the basis of the system operator's assessment rather than a fixed percentage.
Northern Ireland sits outside this arrangement. It operates in a separate all-island market with its own system operator and its own security arrangements, so a notice issued for Great Britain does not apply there. Scotland, Wales and England are all within the Great Britain system and are covered by the same notices, though the network constraints that drive them differ by region.
"The purpose of the CM is to ensure security of GB's electricity supply at least cost to consumers"
What a thin margin means for household supply
A thin margin raises the statistical probability of a supply shortfall. It does not mean blackouts are likely, and the distinction matters because the two are routinely conflated.
The system operator holds a sequence of tools before any disconnection reaches a home. Notices to the market come first. Demand reduction follows, including through demand flexibility arrangements that pay households and businesses to shift consumption away from peak times. Interconnector imports are used where available. Controlled emergency measures sit at the very end of the sequence, and domestic disconnection is the last resort within that.
The evidence from recent winters is that the sequence has held. The margin has been tight, notices have been issued, and household supply has not been interrupted as a result. That is not a guarantee, but it is the record.
What a household should understand is which parts of its own resilience depend on the grid. A home with a gas boiler and a mains-powered heating system has no heat without electricity, because the pump and controls need power. A home with solar and a battery can ride through some interruptions, depending on the size of the battery and the load. A home with neither is entirely dependent on the grid for both heat and power.
The margin is therefore a measure of system tightness that a household cannot influence directly, but which shapes the case for the resilience measures a household can control. That is the honest reading of a thin margin: it is a reason to understand your own dependencies, not a reason to expect the lights to go out.
How grid constraints and local network works fit in
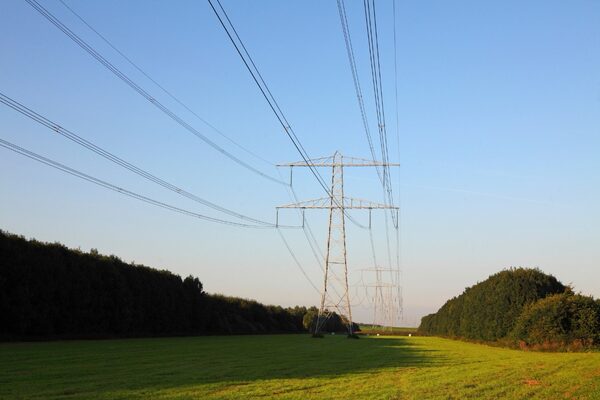
The capacity margin is a national figure, but the constraints that produce it are often local. Constraint payments, currently over £1 billion and projected to reach £2 billion in the mid-2020s, are made when the transmission network cannot carry power from where it is generated to where it is needed2. That is a network problem expressed as a cost.
At the distribution level, the picture is complicated by visibility. Around 20% of small-scale electricity generation capacity was invisible to distribution network operators in 2022, according to the Energy Networks Association5. A network that cannot see generation cannot plan around it, and that affects how much capacity can be relied on locally.
The connection queue is the other local constraint. New generation, storage and large loads wait for a connection, and the queue sets the pace at which the margin can be improved by new build. A project that has planning consent but no connection date contributes nothing to the margin in the meantime.
For a household, the local network determines what is possible. A home considering solar, a battery or an electric vehicle charger is dealing with its distribution network operator, not with the national system operator. The margin is the backdrop; the connection is the practical question. The pages on electricity distribution networks and the grid connection queue set out how those arrangements work.
What it means for household energy independence
The capacity margin is the clearest measure of how much a household depends on the grid. A comfortable margin means the grid is a reliable default. A thin margin means the grid is still reliable but the buffer behind it is smaller, and the case for household resilience is stronger on the evidence.
The scale of household dependence is visible in the spending figures. In England, 36.4% of households, or 8.91 million, spent more than 10% of their income on domestic energy after housing costs in 2023, up from 20.5% in 2021, when the figure was 4.93 million7. Average required energy costs as a percentage of household income were 14.9% for low income households in England in 2025 (provisional), against 6.8% across the wider population4. Those are the households with the least room to absorb a price shock or an interruption.
What a household can control is its own generation and storage. Domestic solar comprised 30% of UK solar capacity at the start of 2026, and 84% of total UK solar installations5. That is a substantial base of household-level generation, and it is the part of the system a home can own outright.
What remains outside household control is the margin itself, the wholesale price, the network charges and the notice sequence. A home with solar and a battery reduces its exposure to all four, but it does not remove it. The honest position is that household independence is partial: it covers the energy a home can make and store, and it leaves the rest of the dependence intact. The energy security and household independence page sets out where that line falls.
Costs that flow from a tight margin: VAT and network charges

A tight margin is not free. The costs of securing firm capacity, managing constraints and supporting schemes all flow through to bills, and they appear as components of the price cap rather than as separate charges.
The price cap itself is set to protect people from a loyalty penalty, and it caps the maximum price for a unit of energy and the daily standing charge for customers in each energy supply region of Great Britain9. The cap level varies by region and by payment method, which is why two identical homes can pay different amounts.
| Region | Standing charge (nil kWh) | Annual bill, single-rate (3,100 kWh) | Annual bill, multi-register (4,200 kWh) |
|---|---|---|---|
| Southern Western | £187.83 | £979.78 | £1,213.43 |
| East Midlands | £170.63 | £925.08 | £1,149.39 |
| North West | £205.20 | £1,049.77 | £1,292.52 |
| Eastern | £196.61 | £1,023.11 | £1,267.03 |
| Southern | £183.50 | £1,008.32 | £1,252.38 |
| Yorkshire | £203.87 | £928.82 | £1,147.40 |
Those are the levels for 1 October to 31 December 2025, under the Standard Credit arrangement except where noted10. The cap has moved since. For 1 July to 30 September 2026, the benchmark maximum charges show Northern at £223.48 standing charge and £824.03 annual bill at 2,500 kWh single-rate, and £220.70 standing charge and £986.44 annual bill at 3,400 kWh multi-rate11. North West shows £192.96 standing charge and £849.67 at 2,500 kWh single-rate, and £192.77 standing charge and £1,026.24 at 3,400 kWh multi-rate11. Midlands shows £207.57 standing charge and £810.72 at 2,500 kWh single-rate, and £206.15 standing charge and £977.09 at 3,400 kWh multi-rate11. Southern shows £172.77 standing charge and £801.74 at 2,500 kWh single-rate, and £172.65 standing charge and £973.28 at 3,400 kWh multi-rate11. Southern Western shows £201.24 standing charge and £829.48 at 2,500 kWh single-rate, and £202.58 standing charge and £1,000.86 at 3,400 kWh multi-rate11.
The reasons for cap movements include increases to parts of the costs of transporting energy in Great Britain and costs towards government schemes and essential support12. The Network Charging Compensation Scheme allowance funds compensation on electricity network charges to energy intensive industries using Great Britain's electricity grid, and it is included in the energy price cap13. A temporary allowance of £28 per dual fuel customer for additional debt costs incurred by suppliers was introduced between 2025 and 202614.
The Energy Price Guarantee regional rates for April to June 2023 give a sense of the earlier position: 34.19 p/kWh ex VAT for the GB average on standard credit, and 30.52 p/kWh ex VAT for the GB average on a pre-payment meter15. The cap has since fallen from £2,500 under the Government's Energy Price Guarantee, from January 202316. Electricity prices are 38% higher than they were in mid-20219.
The cap is not a fixed number and it is not a single national figure. It is a set of regional maxima, and the network and policy costs within it are where the consequences of a tight margin and a constrained grid are paid for.
Sources16 cited
- Statutory security of supply report 2025, GOV.UK, 2025
- POST note on electricity system costs, UK Parliament, 2025
- Progress in reducing emissions 2026 report to Parliament, Climate Change Committee, 2026
- DESNZ annual report and accounts 2025 to 2026, GOV.UK, 2026
- POST note on small-scale electricity generation, UK Parliament, 2022
- NESO storage document, NESO, 2022
- Energy spending and households, UK Parliament, 2023
- Spending Review 2025, HM Treasury, 2025
- Energy price cap regional levels, House of Commons Library, 2026
- Energy price cap levels 1 October to 31 December 2025, Ofgem, 2025
- Energy price cap levels 1 July to 30 September 2026, Ofgem, 2026
- Changes to the energy price cap between 1 October and 31 December 2025, Ofgem, 2025
- Energy price cap will rise 6.4% in April, Ofgem, 2025
- Energy price cap review of historical debt related costs, Ofgem, 2026
- Energy Price Guarantee regional rates April to June 2023, GOV.UK, 2023
- Energy regulator sets out proposals to help customers at risk of debt, Ofgem, 2023
 Gas Supply EmergenciesIf gas runs short, will my home lose supply?
 Balancing Services and FrequencyKeeping the lights on means matching what the country uses with what is being generated, second by second.
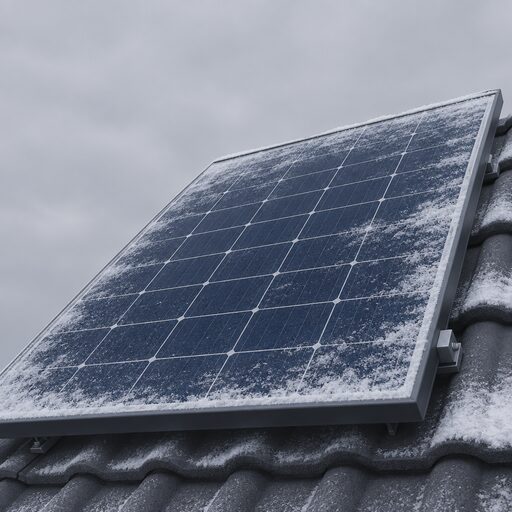 The Winter GapSolar panels make most of their power in summer, but homes need the most electricity on dark winter mornings and evenings.
 Backup Power and IndependenceA power cut leaves most homes completely dark, so how much backup do you actually need to keep the lights on?
 Backup Power and EPSWill your lights stay on when the power goes out?
 The NESO Winter OutlookWill the lights stay on this winter?