
In this guide
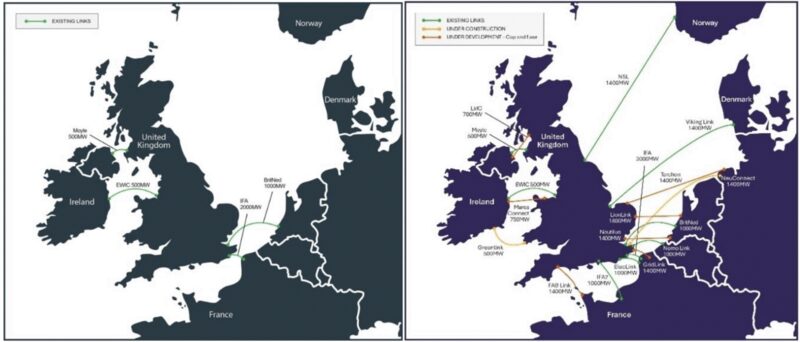
Great Britain has 10.3GW of operational electricity interconnector capacity across ten interconnectors, subsea high-voltage cables that allow power to be traded with neighbouring markets in both directions1. Adding the 1.4GW NeuConnect link to Germany brings the total to 11.7GW, and over 6GW of further projects hold Great Britain regulatory approval1. Those cables are now a material part of how the lights stay on: total annual electricity imports reached 43.7TWh in 2024, a rise of 31%, with net imports of 33.4TWh, up 40% on 20231.
Flows are not one-way. Interconnectors carry power in whichever direction the price difference points at that half-hour, so Britain exports when its wind fleet is running hard and the continent is short, and imports when British plant is expensive or scarce. Net imports of electricity fell by 11% between 2024 and 2025, from 33 TWh to 30 TWh, as more domestic low-carbon generation came online3. Britain nonetheless remains a net importer of electricity, and a net energy importer overall, with net import dependency across all energy reaching 44% in 20244.
For a household, interconnectors sit at the far end of a long chain. They help set the wholesale price, and wholesale energy and supplier costs together make the biggest component of the domestic electricity price5. But a home cannot buy from an interconnector, cannot see one on its bill as a separate line, and gains nothing from one during a local power cut. Interconnection is national supply security, not household independence.
What an interconnector is and why Britain built them
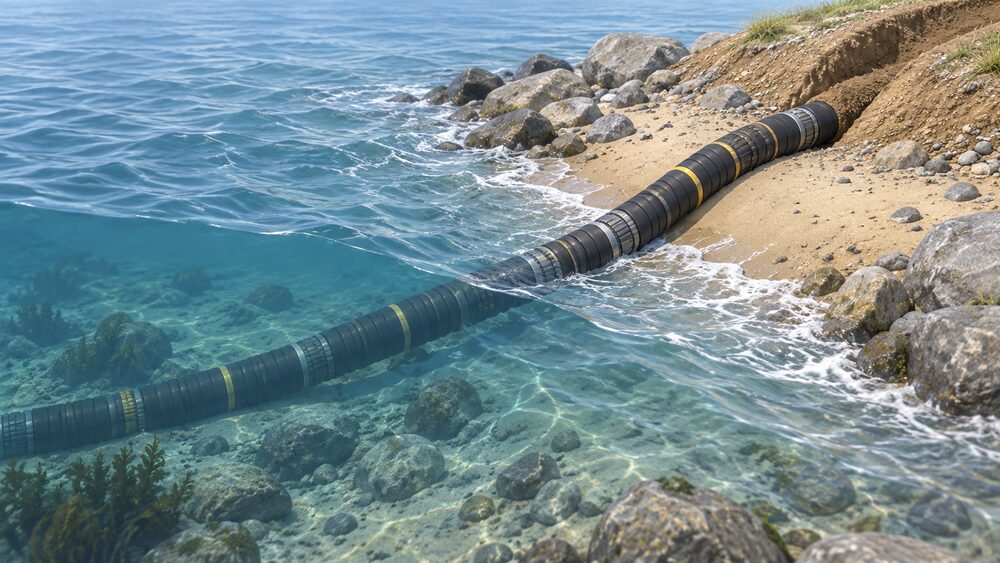
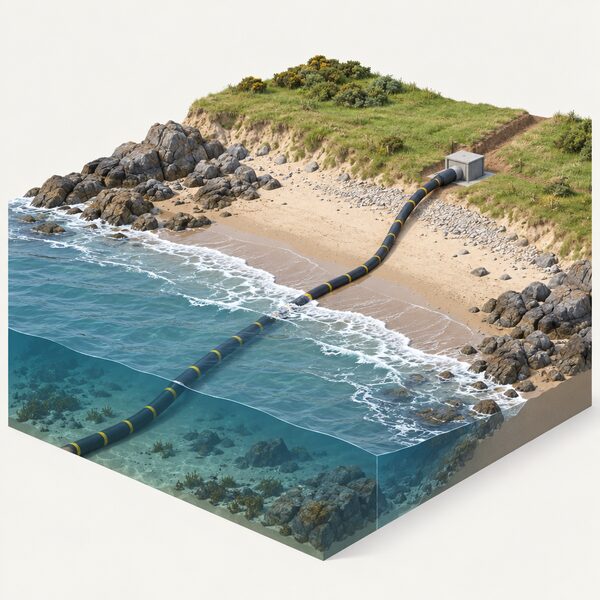
An electricity interconnector is a high-voltage cable, in Britain's case almost always laid under the sea, joining the transmission system here to a transmission system in another country. It is not generation and it is not storage. It is a trading route. The electrical grid is the system that handles the distribution of electricity around the UK6, and an interconnector extends that system's reach beyond the coastline so that surplus in one market can meet shortage in another.
The case for building them rests on three things. The first is price: two markets rarely value power identically at the same moment, and a cable lets the cheaper one serve the dearer one. The second is diversity of supply. A system that can call on plant in several countries is less exposed to the failure of any single power station or gas supply route at home. The third is renewables. Wind and solar output varies across weather systems that are large but not continental in scale, so a windy North Sea and a calm Iberia, or a sunny midday and a dark British evening, can be traded against each other.
The scale of the shift is easy to underestimate. Great Britain had around 6 GW of interconnector capacity in 20217. It now has 10.3GW operational1. Over the same period the domestic generating fleet has also changed shape, with solar alone adding 2.8GW in 2025 to bring national capacity to 21.7GW8. Interconnection has grown alongside renewables rather than instead of them, because a more variable domestic fleet makes access to other markets more valuable, not less.
Interconnectors also sit in a broader trading picture. Gas moves the same way: interconnector pipeline imports from Belgium and the Netherlands, which play a key role in balancing supply and demand on cold winter days, contribute around 1% of UK gross annual gas supply on a five-year average1. The electricity links matter more in volume terms, but the principle is the same. More detail on the gas side sits on gas pipelines and interconnectors.
Current capacity: 10.3GW across ten links
The headline figure from the Government's most recent statutory assessment of security of supply is unambiguous: Great Britain currently has 10.3GW of operational electricity interconnector capacity across ten interconnectors1. The Clean Flexibility Roadmap update gives the same current interconnection capacity of 10.3GW2, so the official and the policy documents agree.
| Measure | Figure | Source date |
|---|---|---|
| Operational interconnector capacity, GB | 10.3GW across ten links1 | December 2025 |
| Interconnection capacity, GB | 10.3GW2 | September 2026 |
| Interconnector capacity, GB, 2021 | 6 GW7 | modelled baseline |
| Total annual electricity imports, 2024 | 43.7TWh, up 31%1 | December 2025 |
| Net electricity imports, 2024 | 33.4TWh, up 40% on 20231 | December 2025 |
Ten links is a meaningful number in itself. It means no single cable carries a dominant share, so the loss of one, whether for planned maintenance, a cable fault or a market decision at the far end, removes a fraction rather than the whole. That redundancy is part of why interconnection can be counted towards security of supply at all.
To put 10.3GW in perspective against domestic plant: the UK has around 2.8 GW of pumped hydropower storage, the majority contributed by Ffestiniog and Dinorwig9, and solar capacity reached 21.7GW in 20258. Interconnectors are therefore a large block of the system's flexible capability, comparable in scale to substantial parts of the domestic fleet, but with one critical difference: their output depends on a neighbouring market being willing and able to send power, which is a commercial and physical condition rather than a guarantee. Related capacity questions are covered on hydropower and pumped storage and the UK electricity generation mix.
Future capacity: 11.7GW, and what comes after
The next confirmed step is NeuConnect, a 1.4GW link to Germany, bringing the total to 11.7GW1. Beyond that, over 6GW of further projects have Great Britain regulatory approval2. Regulatory approval is an important milestone, since a project cannot proceed without it, but it is not the same as a financed, built and energised cable. Approved capacity should be read as a pipeline, not as a delivery date.
Longer-term system modelling takes a more conservative view than the approval pipeline might suggest. Scenario work puts interconnector capacity at 13 GW in 2030, 13 GW in 2035 and 13 GW in 2050, against total installed capacity of 190 GW in 2035 and 276 GW in 20507. Two things follow. First, interconnection is modelled as plateauing while domestic capacity grows, so on those figures the share of the system made up of cross-border links falls sharply over time. Second, the growth of the system is expected to come overwhelmingly from generation and storage built in Britain, which is the direction that matters for national self-sufficiency.
| Year | Interconnector capacity, GB | Total installed capacity, GB |
|---|---|---|
| 2021 | 6 GW7 | not stated |
| 2030 | 13 GW7 | not stated |
| 2035 | 13 GW7 | 190 GW7 |
| 2050 | 13 GW7 | 276 GW7 |
These numbers also need reading alongside the pressure on domestic networks. Analysis of electrification has suggested the UK would require an additional peak capacity of 69GW and 12% more electricity than today by 2030 if ten million new electric vehicles charged simultaneously10, an extreme case rather than a forecast, but one that illustrates how quickly a 13 GW interconnection figure becomes a small share of a much larger system. Rising load is treated in more depth on rising electricity demand.
How imports and exports move across a day
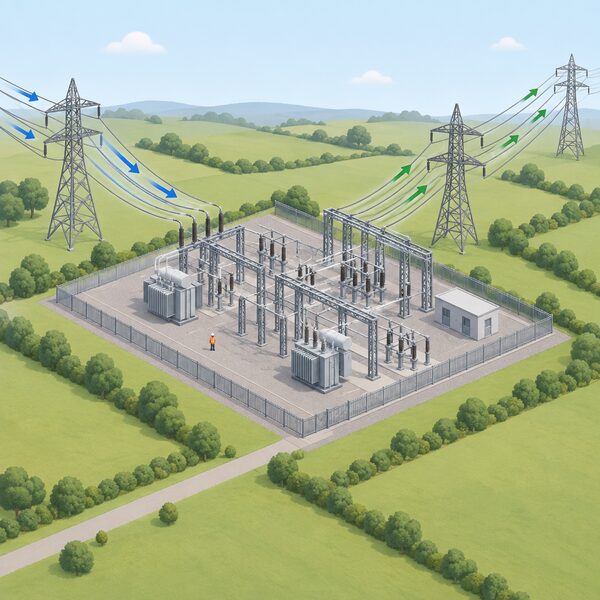
Interconnector flows respond to price, and price responds to weather, demand and plant availability. On a windy night with low demand, British wholesale prices fall, sometimes below zero, and the economic direction of flow is outward. On a still December evening between four and seven, when domestic demand peaks and wind output is low, prices rise and the links pull power in. The same cable therefore reverses direction several times in a week and occasionally within a day.
That pattern explains why annual totals move so much. Total annual imports rose 31% to 43.7TWh in 2024, and net imports increased by 40% from 2023 to reach 33.4TWh1. The following year the direction changed: net imports fell 11% from 33 TWh in 2024 to 30 TWh in 20253, which Carbon Brief's account of the Climate Change Committee's analysis also records as an 11% decrease in net imports8. Neither movement reflects a change in cable capacity. Both reflect the relative cost and availability of power on either side.
A household sees none of this directly, but it sees the consequence. The wholesale price that interconnector trade shapes is the largest single element of what electricity costs, since wholesale energy and supplier costs together make the biggest component of UK domestic electricity price5. When continental prices are high, imports become expensive and that feeds through; when British surplus is large, exports earn revenue that reduces the cost of running the domestic system.
It is worth separating this from household-level export. The Smart Export Guarantee recorded 443.1 GWh of low carbon electricity exported during 2024 to 2025, enough to power over 160,000 typical UK homes for a year11. That is generation pushed from rooftops into local distribution networks, a different mechanism at a different voltage from cross-border trade, and the two should not be conflated. Household export is covered further under household demand flexibility, and wholesale price formation under how the wholesale markets work.
What interconnectors do, and do not do, for household energy security
An interconnector contributes to security of supply in one specific way: it adds a source of power that can be called on when domestic generation is tight. On the coldest, stillest winter evenings, that contribution is counted in the margin between available capacity and expected peak demand. When margins are the question, interconnection is part of the answer, alongside the capacity market, storage and flexibility. Those mechanisms are set out on electricity margins and supply shortfalls and the capacity market.
The limits are equally firm, and there are four worth stating plainly.
- A cable is not a power station. It delivers only if the market at the other end has surplus to sell. A cold snap covering north-west Europe tightens margins everywhere at once, which is exactly when imports are least assured.
- It does nothing for local outages. Power cuts at a household are almost always distribution faults, storms or equipment failures on the local network. UK Power Networks is an electricity distribution company that looks after the cables and wires that bring electricity into people's homes, and does not supply or generate electricity12. Interconnector capacity is irrelevant to a fallen line in a street.
- It is a national asset, not a household one. The chain from cable to consumer runs through the wholesale market, a licensed supplier and a distribution network. A household cannot contract with an interconnector.
- It adds a dependence. Importing power means relying on generation, transmission and political arrangements in another country. That dependence may be diversified and well managed, but it is real, and it is the opposite of self-sufficiency.
At the property level the relevant equipment is entirely separate. A consumer unit's main switch is the master control for all electricity entering the unit and allows the electrical system to be safely isolated during emergencies or maintenance work, while circuit breakers break a circuit when tripped by short-circuit issues or power overloads and residual current devices immediately switch off the electricity if they detect a fault14. These protect the home from its own faults, not from national shortfalls. What households can genuinely control is set out on energy security and household independence.
Interconnectors and the wider grid
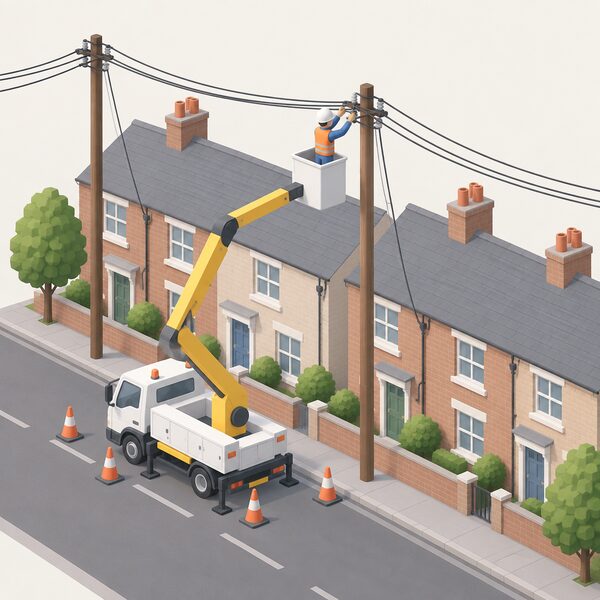
An interconnector lands at a transmission substation and its power then travels the same route as any other generation: transmission, distribution, then the meter. The distribution layer is separate from supply. Part of what a household pays its supplier is given to the network operator for running and maintaining the electricity cables in the area15, and that operator owns and maintains electricity cables and lines, maintains and upgrades power equipment, and moves and connects new electricity cables15. A single operator's area can be large: UK Power Networks covers London, the South East and East of England15. The split between these roles is explained on UK Power Networks vs National Grid and electricity distribution networks.
Interconnectors are also only one of several ways non-traditional capacity now reaches the system. There is over 27,000 MW of Distributed Generation in the UK connected at distribution level16, generation and demand-side response projects above 50kW holding connection agreements are listed in distribution network operators' Embedded Capacity Registers17, and network operators work with trusted third parties like energy suppliers, charge point operators or technology platforms who have a direct relationship with homes and businesses to deliver flexibility12. A 10.3GW interconnection fleet and a 27,000 MW distributed fleet are doing different jobs at different points in the system, and both reduce reliance on large central plant.
Networks themselves have been getting more reliable: UK electricity networks have cut the duration of interruptions by 10% since 201518. That is a distribution achievement rather than an interconnector one, but for a household it is the more directly felt of the two.
Arrangements differ across the nations. The connection process for generation described by the Energy Networks Association covers Great Britain16, and Ofgem is Great Britain's independent energy regulator19. Northern Ireland runs a separate system with its own legislation: where a distributor disconnects or refuses to connect, it shall give reasons for the disconnection or refusal by further notice in writing, and any unresolved dispute may be referred by any party to the Department20. Northern Ireland's interconnection and market arrangements are covered on energy supply in Northern Ireland and the Moyle and East-West interconnectors.
Ownership, regulation and who decides
Energy infrastructure and regulation is the responsibility of the UK Government21, and Ofgem is the UK energy regulator19 and Great Britain's independent energy regulator22. Interconnectors do not proceed without a regulatory decision: the fact that over 6GW of further projects have GB regulatory approval2 is the mechanism by which the pipeline is controlled. Approval covers the revenue regime under which the asset earns money, the terms on which capacity is sold, and the conditions of operation.
Ownership is mixed. Links are typically developed by a company or consortium, often involving the transmission system operator on one or both sides, and financed against the regulated regime. For a household, none of this creates a contractual relationship. Disputes a household might have are with its supplier or network operator, and the Energy Ombudsman is approved by Ofgem to handle service disputes in the energy sector19.
This is also where devolution matters. Scotland has substantial generation and its own strategy, but energy infrastructure and regulation remains reserved to the UK Government21, so decisions about interconnector approvals are not made in Edinburgh or Cardiff. Wales, Scotland and Northern Ireland each experience the results of those decisions through the same wholesale market and, in Northern Ireland's case, through a separate all-island market. See energy supply in Scotland and energy supply in Wales.
What imports cost, and how that reaches bills
Import volumes carry a cost. The UK spent £3.5bn importing electricity from Europe via interconnectors, on one independent assessment published in April 202423. That is a wholesale cost borne by the market rather than a line item on a bill, but it flows into the price that suppliers pay and households ultimately fund.
Household prices are set out by Ofgem's benchmark maximum charges. For the period 1 July to 30 September 2026, the Eastern region figures are a £187.52 standing charge and an £815.65 annual bill at 2,500 kWh on a single rate, and a £188.24 standing charge with a £987.76 annual bill at 3,400 kWh on a multi-rate meter24. The Midlands equivalents are £207.57 and £810.72 single-rate, £206.15 and £977.09 multi-rate, and the Northern figures are £223.48 and £824.03 single-rate, £220.70 and £986.44 multi-rate24. The regional spread reflects network costs, not interconnector trade.
| Region (1 July to 30 September 2026) | Standing charge, single rate | Annual bill at 2,500 kWh | Annual bill at 3,400 kWh, multi-rate |
|---|---|---|---|
| Eastern | £187.52 | £815.65 | £987.76 |
| Midlands | £207.57 | £810.72 | £977.09 |
| Northern | £223.48 | £824.03 | £986.44 |
All figures from Ofgem's benchmark maximum charges for that period24.
Against that, UK electricity unit prices under the cap are 38% higher than in mid-202125. UK domestic electricity prices are around the median of those in Western Europe5, though lower prices elsewhere have meant the UK has been third or fourth highest out of the EU and UK in the past two years25. Domestic bills have not increased at the same rate as prices, an effect attributed to energy efficiency policies designed to reduce overall consumption5. Ofgem has separately proposed that a standing charge reduction be split between fuels as a reduction of £65 to £90 for electricity consumers26. None of these movements can be attributed to interconnection alone, and the page on how global events move UK energy prices sets out the wider drivers.

Where interconnectors sit on the path to energy independence

The long view is stark. The UK was a net energy exporter in 2000, and energy production has fallen by two thirds since then while demand has dropped by only a third, moving Britain from a net exporter to a significant net importer23. Net import dependency reached 44% in 20244. Government has described the UK as a net energy importer with a high dependence on gas and oil27, and the country is a net importer of natural gas, meaning it imports more than it exports, which leaves it vulnerable to global price volatility28. Electricity interconnection is one strand of that dependence, and a comparatively transparent and well-regulated one, but it is dependence nonetheless.
Whether it stays that way is contested by scenario. Independent modelling of 2030 gives two outcomes: in a "falling short" case the UK remains a net importer of electricity, relying on neighbours for around 4 TWh of power a year in 2030; in a "delivering commitments" case the UK could produce a surplus, turning the country from a historical importer into an exporter of 49 TWh29. The gap between those two futures, 4 TWh imported or 49 TWh exported, is decided by how much clean generation gets built and connected at home, not by how many cables are laid.
There is context for why the starting point is what it is. EU members produce on average almost 50% more electricity than the UK on a per capita basis30, and in September to November 2025 nuclear supplied 12.3% of electricity generation by Major Power Producers31. A thinner domestic fleet leans harder on imports at the margin.
For a household, the practical reading is that interconnectors improve the odds that national supply holds on a tight winter evening, and they help discipline the wholesale price, but they add nothing a home controls. Independence at the property level comes from reducing demand, generating and storing on site, and shifting consumption away from the peak hours when the system is most stressed and imports most expensive. The national story and the household story run in parallel: both are covered across /national-supply/.
Sources31 cited
- Statutory Security of Supply Report 2025, GOV.UK, 17 December 2025
- Clean Flexibility Roadmap, July 2026 update, GOV.UK, 17 September 2026
- Progress in Reducing Emissions: 2026 Report to Parliament, Climate Change Committee, 2026
- Factcheck: nine false or misleading myths about North Sea oil and gas, Carbon Brief, 25 March 2026
- Consumer bills project, UK Energy Research Centre, 20 September 2026
- Balancing the grid, Uswitch, 9 February 2026
- Future Energy Scenarios data, NESO, July 2022
- CCC: faster electrification of UK will put money back into people's pockets, Carbon Brief, 2026
- Energy Generation in Wales 2021, Welsh Government, October 2022
- 7 things to know about the race to net zero emissions, Energy Networks Association, 2026
- Smart Export Guarantee Annual Report Year 5, Ofgem, 3 December 2025
- Flexibility services, UK Power Networks, 20 September 2026
- Make a plan to be winter ready, UK Power Networks, 17 September 2026
- Consumer units and fuse boxes, NICEIC, September 2025
- What's the difference between you and my electricity supplier?, UK Power Networks, 17 September 2026
- G98 connection guidance for single premises, Energy Networks Association, 17 September 2026
- UK Solar Roadmap, DESNZ, June 2025
- Ensuring our energy networks are resilient in bad weather, Energy Networks Association, 27 November 2021
- Energy Ombudsman FAQs, Energy Ombudsman, 19 September 2026
- Electricity (Northern Ireland) Order, Article 27, legislation.gov.uk, 2012
- Protection for energy customers ahead of RTS switch off, Scottish Government, 15 March 2025
- Call for Input: review of the gas disconnections framework, Ofgem, 13 January 2025
- UK going backwards: government's energy security strategy scores 3/10, Energy and Climate Intelligence Unit, 5 April 2024
- Energy price cap levels, 1 July to 30 September 2026, Ofgem, May 2026
- Domestic energy prices research briefing, House of Commons Library, 20 September 2026
- Requirement to offer lower standing charge tariffs, Ofgem, 24 September 2025
- Spring Statement 2022, HM Treasury, March 2022
- Gas prices research briefing, House of Commons Library, January 2022
- Cutting the bills: UK clean power, Ember, 18 October 2023
- Electricity prices in Great Britain, House of Lords Library, June 2026
- Energy Trends and prices statistical release, GOV.UK, 29 January 2026
 Gas Pipelines and LinksWhere does the gas in your home actually come from, and what happens when it gets really cold and the wind stops blowing?
 Wind Power on the UK GridOffshore wind now supplies a big share of Britain's electricity, and it keeps growing.
 The Full Where Our Energy Comes From GuideWhere does the gas in your boiler and the electricity in your sockets actually come from?
 UK Electricity Generation MixBreaks down the shares of gas, wind, nuclear, solar, biomass, hydro and imports in UK electricity generation, how those shares move by hour and season, where the published figures come from, and what the mix means for a household's energy independence.
 UK Energy Prices vs EuropeWhy does the UK pay so much for electricity when our gas is cheaper than most of Europe?
 LNG Imports and TerminalsHow much of Britain's gas arrives by ship, where does it come from, and why does a damaged plant in Qatar or a storm of bidding in Asia change what a household pays?