
In this guide
Wind is the largest single source of electricity on the British grid. Wind power supplied 29.4% of UK electricity in 2023, ahead of every other individual technology, within a low carbon total of 55.3% that year1. Wind and solar combined reached 34.28% of generation in 2024, up from 32.91% in 20232, and renewables as a whole accounted for 51% of UK electricity generation in 20243.
Almost all of that growth has come from turbines, not panels. The UK had around 17GW of installed offshore wind capacity as of January 20264, after capacity grew by 0.7GW during 2025 to a reported total of 16.6GW5. Onshore and offshore wind capacity together is described as enough to meet 20% of UK electricity demand6, and offshore wind generation alone reached a record 49.5TWh in 20237.
The constraint is no longer turbines. It is wires and timing. In the 2024/25 financial year, 9.4TWh of wind generation was curtailed in Great Britain, meaning windfarms were paid to turn down, an increase of 77% on the previous year; the share of potential annual wind generation curtailed rose from 8% to 13%8. For a household, wind's effect arrives through the wholesale price rather than through anything in the home: wind alone was reported to have knocked around a third off the UK wholesale power price in 20259.
Capacity and output: the current numbers
Offshore capacity figures differ between documents because they are read at different dates and on different bases. The most recent independent figure puts installed offshore wind at around 17GW in January 2026, leaving a gap of 27 to 34GW to government targets4; a separate account of the 2025 calendar year gives a total of 16.6GW after an addition of 0.7GW5. Earlier readings show the trajectory: 4 to 8GW in the late 2010s, 10.5GW in UK waters around 2020, and 14.7GW reported by a supplier in December 2024 with large projects due for commissioning in 202611.
| Measure | Figure | Period |
|---|---|---|
| Wind share of UK electricity | 29.4%1 | 2023 |
| Solar share of UK electricity | 4.9%1 | 2023 |
| Wind and solar share of generation | 32.91%2 | 2023 |
| Wind and solar share of generation | 34.28%2 | 2024 |
| Renewable share of generation | 51%3 | 2024 |
| Offshore wind generation | 49.5TWh7 | 2023 |
| Offshore wind capacity | around 17GW4 | January 2026 |
| Wind curtailment | 9.4TWh, 8% to 13% of potential output8 | 2024/25 |
The growth is recent and steep. Windfarms generated 5.5 per cent of total UK electricity in 201212; wind accounted for 17% of total power generated in 201813; and wind provided a quarter of UK power in 202214. One account of the decade to 2021 put the rise at 2% to 18% of supply15. Wind and solar together generated more than 100TWh in 2025, meeting a third of total demand16.
Instantaneous output is a different quantity from annual share, and the two are often confused. Recorded snapshots include a 10GW contribution from wind to the grid in early 2018 and 8.8GW, 26.8% of supply at that moment, in March 2019. Those are maker readings of a single moment, not averages.
What drives wind output
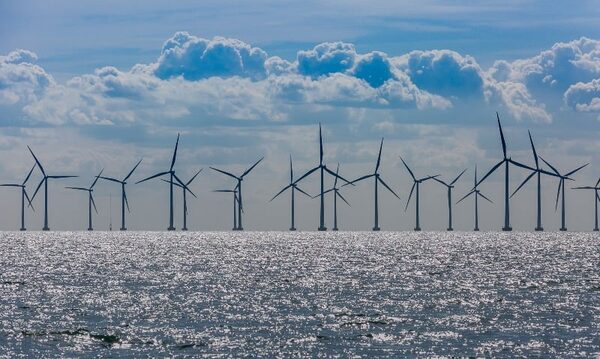
The resource is the starting point: an estimated 40% of Europe's wind blows over the UK17, which is why wind became one of the largest sources of electricity generation in Great Britain rather than a marginal contributor18. Onshore wind farms alone have been credited with annual output equivalent to powering 9.9 million homes for a full year18.
Three things then determine what the grid actually receives.
- Installed capacity. Each gigawatt added raises the ceiling. Offshore additions in 2025 came to 0.7GW5, and the most recent renewables auction secured 8.4GW of offshore wind overall19.
- The weather. Output follows wind speed, so the annual average of 29.4%1 conceals long high-wind spells above it and still anticyclones well below it. Nothing about a wind fleet makes a calm week generate.
- Whether the network can take the power. Curtailment at 13% of potential annual output in 2024/258 is the measure of generation built but not delivered, largely because transmission capacity between where the wind blows and where demand sits is insufficient.
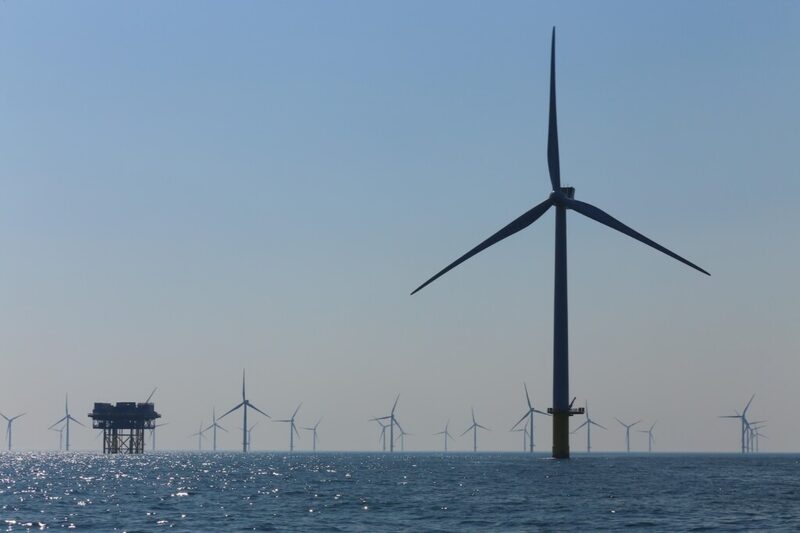
Offshore wind is treated as the structural core of the system: the Climate Change Committee states plainly that it "forms the backbone of the future system"20, and modelling of a future UK electricity system holds that "In the UK, supply will be dominated by wind power"21. Cost is part of the reason: offshore wind has been assessed as 60% cheaper than fossil fuels22, and one supplier account projects offshore wind providing a third of UK electricity needs by 203023.
Solar sits alongside rather than in place of wind, at 4.9% of UK electricity in 20231 and around 6% of total supply on a more recent network reading24. The two are complementary in season, which is why generation shares are often quoted for the pair together. The wider mix is covered on the UK electricity generation mix.
Curtailment and constraint payments: paid to stop
Curtailment is the sharpest current limit on wind's contribution. The Climate Change Committee records 9.4TWh of wind curtailment in Great Britain in the 2024/25 financial year, an increase of 77% on the previous year, with the proportion of potential annual wind generation curtailed rising from 8% to 13%8. An independent account of the same phenomenon describes it in plain terms:
"in 2025, some 9.4 terawatt hours (TWh) of wind generation was "curtailed", when windfarms are paid to turn off, up 77%"
The same 9.4TWh figure is attached to two different periods: the 2024/25 financial year and the calendar year 2025, alongside the same 77% increase8. The quantity and the rate of increase are consistent; the period label is not, so both readings are given here.
The cost of turning generation down is recovered through balancing charges rather than shown on a bill as a line of its own. The mechanics of that recovery are set out under transmission and balancing charges, and the operator's toolkit under balancing services and frequency response. Curtailment is closely related to the appearance of negative electricity prices in high-wind, low-demand hours.
How wind's share varies across the four nations
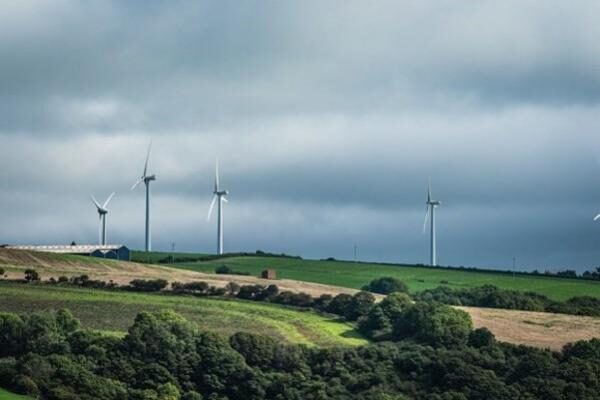
Wind is not spread evenly, and neither is the benefit. In Wales, 70% of all renewable electricity generation came from onshore and offshore wind in 2021, making wind the dominant Welsh renewable technology25. Scotland has run consistently ahead of the UK average on renewable share: an official statement gave 29.3% renewable generation for the UK as a whole against 25.6% for the rest of the UK excluding Scotland, the gap being Scotland's own contribution26. Northern Ireland operates within a separate all-island market, so UK-wide generation shares do not describe the power a Northern Irish household actually receives.
| Nation | What the figures show |
|---|---|
| England | Carries most demand; wind output reaching it depends on north to south transmission capacity, the main driver of curtailment8 |
| Scotland | Renewable share above the UK average, with 29.3% UK-wide against 25.6% excluding Scotland26 |
| Wales | 70% of Welsh renewable electricity generation from onshore and offshore wind in 202125 |
| Northern Ireland | Separate market arrangements; GB generation shares do not apply directly |
Detail by nation is set out on energy supply in Scotland, energy supply in Wales and energy supply in Northern Ireland. The practical point for households is that a high local wind share does not mean a lower local bill: tariffs are set nationally, and the share of clean generation on the wires near a home has no direct effect on the unit rate paid.
Targets, ambitions and the rules that shape them
Government ambition is for up to 50GW of offshore wind by 2030, including up to 5GW of floating offshore wind10. Earlier and parallel statements give 40GW by 2030 growing to 100GW or more by 205027, and a target of delivering up to 50GW by 2030 alongside work on supply chain bottlenecks including ports, vessel capacity, manufacturing capability and floating wind. Against around 17GW installed in January 2026, the gap to target has been put at 27 to 34GW4. The most recent auction secured 8.4GW of offshore wind overall19.
Beyond wind specifically, government plans have low or zero-carbon power, largely wind, solar and nuclear, accounting for 95% of Great Britain's electricity generation in 203028. System operator scenarios published in 2022 had wind and solar at 43% of GB energy supply at that time, with wind and solar making up over half of domestic GB electricity generation in all scenarios by 202729.
Market rules matter as much as build rates. Gas sets the electricity price up to 40% of the time under current arrangements30, which is why a large wind share does not translate proportionally into a low price. The Climate Change Committee has estimated system costs of £10/MWh, and only in 2030 if 35 to 40% of UK power comes from wind and solar31. Older policy work assumed renewable generation, principally wind, would need to meet around 30% of electricity demand to hit the 15% renewable energy target for 202032.
Support for household-scale wind is historic rather than current. The Feed-in Tariff, now closed to new applicants, paid banded generation rates for wind by installed capacity, with smaller machines earning more per unit than larger ones33. Those bands are a record of what the scheme once paid, not an option open to a household today. Current support for large-scale wind runs through contracts for difference, which is where the capacity now being added to UK waters is contracted.
What wind means for a household's energy independence
Wind is the main reason Britain's electricity has become less dependent on imported fuel. Renewables have cut the UK's dependence on foreign fuels for electricity generation from 65% in 2014 to under 50% today34. That is a national gain in security, achieved on a national asset base.
It is not household independence. A home connected to the grid stays dependent on the grid, on a supplier's tariff, on network charges, and on the gas price that still sets the electricity price up to 40% of the time30. Wind's price effect is real but diluted: around a third off the wholesale power price in 20259, of which only part of a bill is wholesale at all. Green tariffs do not change the physics either; over a third of Britain's electricity is generated by wind, solar or hydro regardless of which tariff a household holds35.
Self-generation from wind is a narrow option for most properties. Small-scale domestic wind was estimated to have the potential to supply approximately 0.9 per cent of UK electricity supply, a figure from a field trial of small turbines36. Output depends on an exposed site with unobstructed airflow, which excludes most urban and suburban homes. The realistic household strategy for benefiting from wind is timing rather than ownership: shifting consumption into windy, low-price hours, which is the subject of household demand flexibility and connects to rising electricity demand from heat pumps and electric vehicles.
Where the figures disagree, and why
Published wind shares for the UK range widely, and the reason is almost always the denominator or the date rather than a factual dispute. Shares quoted against electricity generation are far higher than shares quoted against total energy, which includes transport fuel and heat. Figures have been given as 29.4% of total electricity output at the end of 2023 and 29.5% of UK energy production for 2024, and separately as around 18% of all energy produced in the UK; these are not comparable measures. Quarterly readings also sit above annual ones in windy quarters, with 33.8% attributed to wind for the first quarter of 2024.
Renewable totals show the same spread: 51% of generation in 2024 on an official reading3, against 46.51% for 20232 and around 42% of the power grid from renewables on a network operator's estimate. Anything load-bearing here rests on the official and independent figures with a stated year, and the year is given each time. The broader picture of where Britain's power comes from is set out on UK energy supply.
Sources36 cited
- POST briefing on UK electricity and low carbon generation, UK Parliament, 2023
- UK energy statistics, Uswitch, 2025-12-17
- Electricity generation briefing, House of Commons Library, 2025
- Q&A on the UK's record offshore wind auction, Carbon Brief, 2026-01-15
- CCC on faster electrification of the UK, Carbon Brief, 2026
- Wind power and the distribution network, Electricity North West, 2026-09-19
- Green energy statistics, Uswitch, 2023
- Progress in Reducing Emissions 2026 Report to Parliament, Climate Change Committee, 2026
- Comment on the Ofgem price cap, ECIU, 2025
- Offshore wind ambition documentation, NESO
- How do wind turbines work, Good Energy, 2024-12-09
- Seven unexpected graphs about the UK's energy sector, Carbon Brief, 2012
- Proposals on payments for households with solar, GOV.UK, 2018
- Cutting the bills with UK clean power, Ember
- Existing and future technologies for retrofitting the UK housing stock, CREDS, 2021-06-08
- Factcheck on North Sea oil and gas myths, Carbon Brief, 2026-03-25
- Wind turbines explained, Uswitch, 2026-01-06
- What are wind farms all about, Smart Energy GB, 2026-03-16
- DESNZ annual report and accounts performance report, DESNZ, 2026
- End the fossil fuel age for a secure future, Climate Change Committee, 2025-02-26
- Efficiency and flexibility: a UK perspective on heat pumps in the electricity system, Heat Pumping Technologies, 2024
- The link between energy bills and fossil fuels, End Fuel Poverty Coalition, 2025-09-09
- Decarbonising heat, Nu-Heat
- Solar power and the distribution network, Electricity North West, 2026-09-19
- Energy generation in Wales 2021, Welsh Government, 2022-12
- Annual Energy Statement 2019, Scottish Government, 2019-05-15
- Raising the UK's climate ambitions for 2035, Climate Change Committee, 2020-12-09
- Solar at the centre of new energy security measures, Solar Energy UK
- GB supply scenarios document, NESO, 2022-07
- Energy industry profits and bills, End Fuel Poverty Coalition, 2025-10-29
- Factcheck on the carbon floor price and household bills, Carbon Brief
- Demand side response consultation, Ofgem, 2010-07
- Feed-in Tariff table for non-PV technologies, Ofgem, 2012
- Factcheck on why expensive gas keeps electricity prices high, Carbon Brief, 2025-05
- Green electricity tariffs, Centre for Sustainable Energy, 2026-07
- Location, Location, Location: small-scale wind field trial, Energy Saving Trust, 2009-07
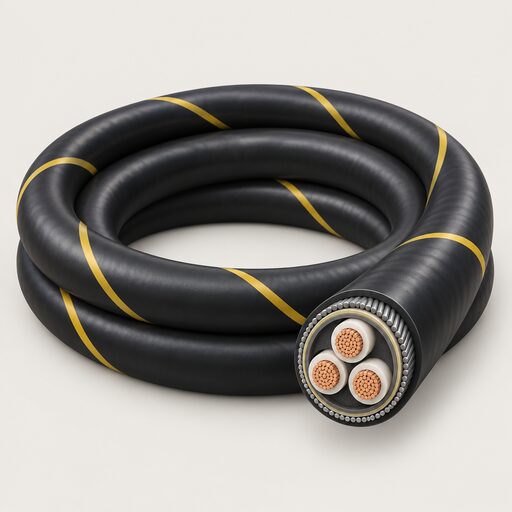 Electricity InterconnectorsWhere does Britain's electricity come from when the wind drops, and how much do we buy from abroad?
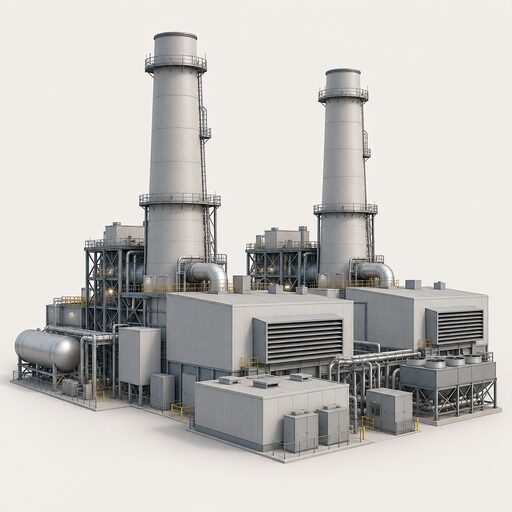 UK Electricity Generation MixBreaks down the shares of gas, wind, nuclear, solar, biomass, hydro and imports in UK electricity generation, how those shares move by hour and season, where the published figures come from, and what the mix means for a household's energy independence.
 Wind Turbine InstallationWill a wind turbine actually pay for itself in a normal British garden, and how much wind does your spot really need?
 Wind Turbine Output and SizingHow much electricity a home wind turbine makes depends far more on your wind than on its size.
 Domestic Wind TurbinesCan a wind turbine really power a home, and is your site windy enough?
 Off-Grid Wind PowerHow much power can a small wind turbine actually make for a house, boat or caravan that is not on the grid?