
In this guide
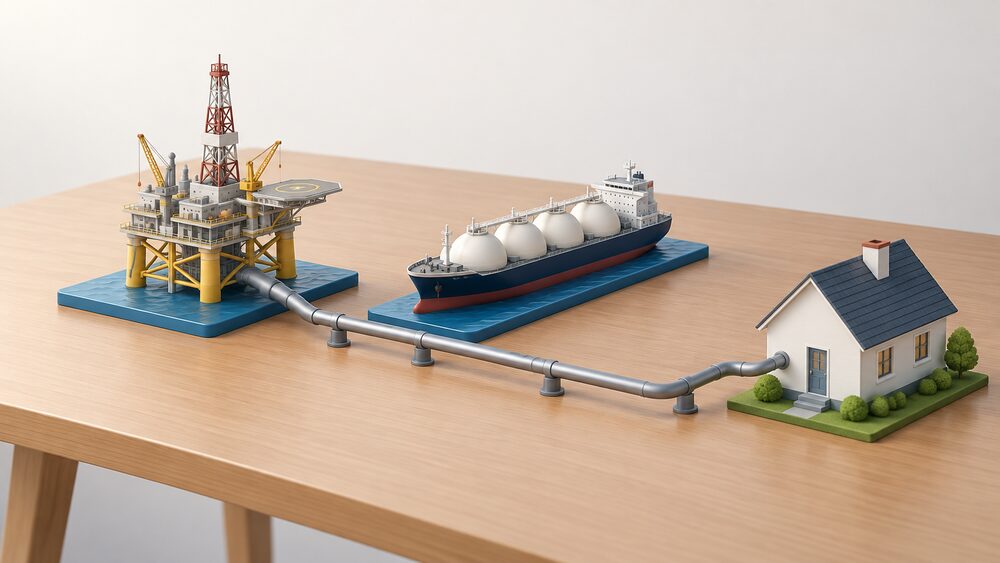
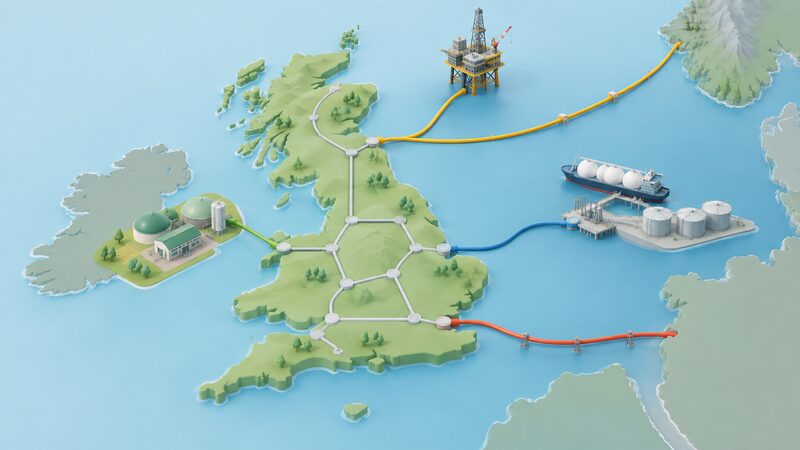
Britain's gas arrives from four places: fields on the UK Continental Shelf, pipelines from Norway, tankers carrying liquefied natural gas, and two interconnector pipelines from Belgium and the Netherlands. On a five-year average, the UK Continental Shelf provides 43 per cent of gross annual gas supply, the Norwegian Continental Shelf 35 per cent, LNG shipments 21 per cent and continental interconnectors about 1 per cent1. In demand terms, 37 per cent of the gas the UK used in 2024 was domestically produced2. Both framings point to the same conclusion: roughly half the gas burned in Britain is home-produced, and roughly half is imported3.
That balance is not static. The UK was a net exporter until 2004; since then the majority of supply has come from imports4. In 2000 the country sourced its gas almost entirely from the North Sea5. Domestic offshore gas production is now projected to keep falling at 12 per cent a year1, and one independent projection has North Sea gas production down 75 per cent by 2035, at which point almost 85 per cent of UK gas demand would be met by net imports6.
Gas matters to households well beyond the boiler. It made up 35 per cent of total UK energy demand in 20241, with total demand of 687 TWh, of which 26 per cent went to electricity generation and 19 per cent to industry2. Gas is the single greatest source of UK electricity at 36 per cent7, so the price of imported gas reaches even all-electric homes.
Domestic production: the North Sea's shrinking share
UK Continental Shelf gas remains the single largest contributor, at 43 per cent of gross annual supply on a five-year average1. Measured against demand rather than gross supply, domestic production covered 37 per cent in 20242, and an earlier assessment for 2018 put it at 33 per cent of demand8. The spread between these numbers reflects different denominators and different years rather than a factual dispute: gross supply counts everything entering the system, including volumes that are re-exported or stored.
The direction of travel is not in doubt. Production of crude oil and natural gas liquids fell to 30.4 million tonnes in 2024, and official projections show offshore gas production continuing to decline at 12 per cent a year1. The Energy and Climate Intelligence Unit has modelled North Sea gas production falling 75 per cent by 20356. That is a depletion story, not a policy one: fields that have been producing since the 1960s and 1970s hold less each year.
For households this matters in one specific way. Domestic gas is sold at the international price, so producing more at home does not, of itself, lower a bill. What domestic production does change is exposure to the physical risks of long supply chains: cargo diversions, pipeline outages and shipping disruption. A field 200 kilometres offshore is less vulnerable to those than a tanker crossing the Gulf. The Institution of Gas Engineers and Managers has argued that home-grown gas, natural gas, biomethane and hydrogen together, retains a strategic role in UK energy security through the transition9.
Norway: the UK's largest import source
Norway is the UK's largest single external supplier of gas, at 35 per cent of gross annual supply on a five-year average1. Import capacity from Norway stands at roughly 135 million cubic metres a day1. Independent estimates put Norway at approximately 60 per cent of UK natural gas imports10, with other assessments placing Norwegian pipeline gas at around a third of UK consumption11 and 39 per cent of demand in 20188. The variation comes from whether the figure is expressed as a share of imports or a share of total supply.
Norwegian gas arrives by pipeline, which gives it two characteristics that LNG lacks. It is contracted on long-term terms and it is physically fixed: the gas cannot easily be diverted to a higher-paying market mid-voyage. Government statements have described the UK as benefiting from diverse and secure sources of gas from the North Sea and reliable import partners like Norway1. Norway is also the source of around half of UK crude oil imports, and around 60 per cent of the UK's energy in total comes from abroad, including Norway, Qatar, Sweden and the Netherlands10.
The dependence is real but narrow. It is a dependence on one neighbouring state with which the UK shares a continental shelf, rather than on a distant supplier reached through contested waters. The residual risk is concentration: a single large pipeline system carrying a third of national gas supply is a single point of failure, which is part of why LNG capacity and storage exist alongside it. Further detail on the physical routes sits with gas pipelines and interconnectors.
LNG tankers: Qatar, the United States and Algeria
Liquefied natural gas supplies 21 per cent of gross annual gas supply on a five-year average, with GB import capacity of 150 million cubic metres a day, slightly more than the Norwegian pipeline capacity1. A separate independent estimate puts LNG at around 15 per cent of the UK's gas at present3.
Qatar dominated this route for most of its history, accounting for 70 to 97 per cent of LNG volumes imported to the UK since 2005, and 87 per cent of LNG imports in 201112. That concentration has since loosened. By 2026 the reported pattern was that considerably more gas was arriving from the United States and much less from Qatar than in 202213. That shift proved material in March 2026, when Qatar suspended LNG production and exports14.
LNG is also the route through which the UK's small Russian exposure historically ran. Of six LNG shipments received in a period of early 2018, three were from Russia8. Public opinion has leaned towards diversification: an Energy and Climate Intelligence Unit poll found seven in ten UK adults backed more gas from other countries such as Algeria, Qatar or the US15. The terminal infrastructure behind this trade is covered in LNG imports and UK terminals.
Russian gas: a small and shrinking exposure

Russia has never been a significant direct supplier of gas to the UK. Five countries have long accounted for the vast majority of imports: Norway, the Netherlands, Belgium, Qatar and Algeria8. Russian LNG contributed 0.4 percentage points of UK supplies in the 2018 period8. At the start of the Ukraine conflict in February 2022, the Energy and Climate Intelligence Unit put UK imports from Russia at 5 to 6 per cent of gas imports, equal to 3 to 4 per cent of UK consumption16.
The two figures are not in conflict: one counts a share of the smaller import total in a particular year, the other a share of all supplies including LNG only. Either way, the UK's exposure to Russian gas was never comparable to that of several continental European states. What the UK was exposed to, and remains exposed to, is the price effect. Gas trades on an international market, so a supply shock anywhere raises the price everywhere, regardless of whose molecules arrive at Bacton or Milford Haven. This is the mechanism explored in how global events move UK energy prices.
How gas reaches your home
The gas grid is a network of pipelines across Great Britain2, with Northern Ireland served by a separate and much younger network. Gas comes ashore at coastal terminals, moves through the high-pressure national transmission system, and is then stepped down into the regional distribution networks that run under streets to meters.
Two interconnector pipelines under the English Channel link Britain to Belgium and the Netherlands17. They account for only about 1 per cent of gross annual supply on a five-year average, but play a key role in balancing supply and demand on cold winter days1. Their value is flexibility rather than volume: they can flow in either direction, exporting in summer and importing during a cold snap.
| Route | Share of gross annual gas supply (5-year average) | Import capacity |
|---|---|---|
| UK Continental Shelf | 43%1 | n/a |
| Norway (pipeline) | 35%1 | ~135 mcm/d1 |
| LNG shipments | 21%1 | 150 mcm/d1 |
| Belgium and Netherlands interconnectors | ~1%1 | n/a |
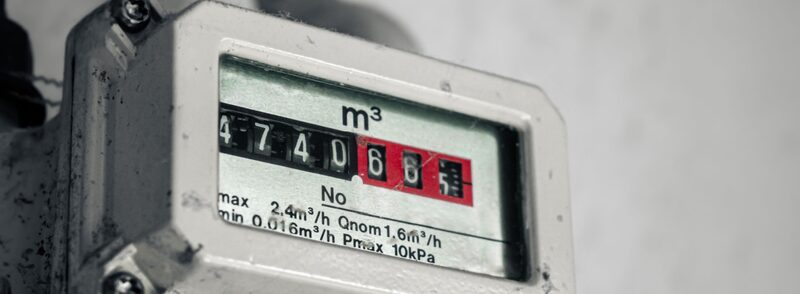
Around 85 per cent of UK homes are connected to the gas grid18, a figure repeated across independent sources, with one guide putting it at 84 per cent of domestic properties19. In England specifically, 21.2 million households, 86 per cent, used a gas-fired main heating system in 2023-2420. There are roughly 30 million homes in the UK, about 24.5 million of them heated by natural gas21. More than four million off-gas homes across England, Wales and Scotland rely instead on oil, LPG, solid fuel or electricity23. Nearly every household has access to the electricity grid, though not all are connected to gas24. Which network delivers to a given street is set out in gas distribution networks.
Biomethane: green gas already flowing into UK homes
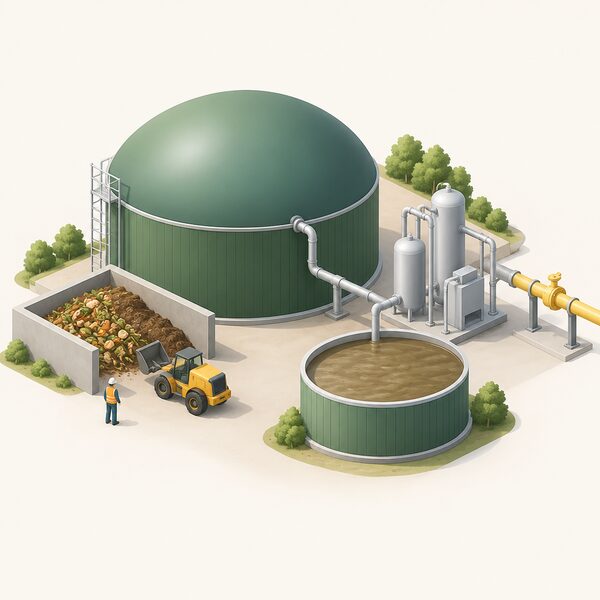
Biomethane is produced by anaerobic digestion of organic material such as food waste, manure, sewage or crops, broken down by bacteria in sealed digester tanks without oxygen19. The gas is cleaned and upgraded, then injected into the distribution network. The spent digestate makes usable organic fertiliser, which lowers emissions further26.
The decisive technical point for households is compatibility.
"it is molecularly identical to fossil gas, meaning that it can be supplied through existing pipelines and is entirely compatible with existing gas systems used by households, commercial businesses and industrial sites"
No boiler change, conversion or appliance modification is required. Because biomethane is blended into the general grid supply, no individual household receives it alone; it arrives as a small share of mixed mains gas.
Volumes are already meaningful. There is enough biomethane flowing through the network to heat up to one million homes27, from 130 connected sites27; a separate count in March 2025 put this at 128 sites with capacity to heat one million homes26, and an earlier study found 124 connected sites with 29 more in the connections process28. Connected capacity stood at 10.1 TWh, enough for over 840,000 homes, rising to 14.5 TWh and 1.2 million homes including sites in the pipeline28. Framed against heating systems rather than homes, that is enough for 1.2 million gas-boiler homes or around 6 million homes on hybrid systems29. Current production is 7 TWh9. In the last year covered, biomethane saved 1.2 million tonnes of carbon, equivalent to taking 923,000 cars off the road26. Biomethane is described as carbon neutral25, and with biogenic carbon capture at the production plant it can remove more carbon than it emits30. Deployment is particularly advantageous in rural areas, where fewer properties are connected to the main gas network19.
How much of UK gas demand biomethane could cover
Analysis published in May 2025 found sufficient sustainable domestic feedstock to generate 50 TWh of biomethane by 2030, equal to 14 per cent of current UK gas demand, and up to 120 TWh by 2050, which equates to up to 90 per cent of overall demand in 2050 on a scenario of significantly lower gas demand by then27. That is a tenfold or greater increase in production capacity, producing volumes equal to the heating demands of over 10 million homes and supporting up to 60,000 skilled jobs by 203027. The same analysis argues government has significantly underestimated the potential27, against a current official production target of 30 TWh by 205028.
The constraint is not feedstock but mobilisation: only 2.5 per cent of the UK's available organic farm waste is currently used to make biomethane19. Baringa analysis suggests scaling UK biomethane could deliver £156bn to £218bn in cumulative energy system savings9, and the National Energy System Operator has positioned biomethane as a whole-system solution deployable now, with further growth to be modelled in its Future Energy Scenarios9. Support runs through the Green Gas Support Scheme, which funds generation of biomethane by anaerobic digestion for injection into the gas grid31.
Temper the arithmetic with two cautions. The 90 per cent figure depends entirely on demand falling steeply first, through insulation, heat pumps and electrification; it is not a claim that biomethane can replace today's 687 TWh of gas demand2. And one network pathway has biomethane reaching the grid at scale only during the 2040s16. A fuller treatment sits at biomethane and green gas.
What import dependence means for a household
The UK is a net energy importer with a high dependence on gas and oil32, and has been strongly affected by the energy crisis because of its dependence on natural gas for heating, electricity generation and industry33. Gas and oil account for 78 per cent of UK household energy costs, with 47 per cent of that gas and oil relying on imports34. Scottish Government analysis expected the UK to be importing 67 per cent of its gas by 202535.
For a household, the practical consequence is that the gas bill and much of the electricity bill are both set by an international commodity price. About 30 per cent of UK electricity demand is met by fossil gas36, so a home that has removed its boiler but stayed on the grid still holds an indirect exposure. The dependencies that remain, whatever a household does inside its own walls, are the international gas market, the gas and electricity networks, a licensed supplier, and, for gas, the physical routes described above.
What a household can shift is the size of that exposure. Reducing demand through fabric measures cuts the number of imported kilowatt hours needed at any price. Moving heat to electricity swaps a direct gas dependence for a partial one, shrinking as the grid decarbonises. Biomethane greens the molecules without changing the appliance, but it is delivered as a grid blend and gives no household any independent claim on supply. None of these removes the dependence; they change its shape and its scale. The wider picture is set out in UK energy supply and in energy security and household independence.
Sources36 cited
- Statutory Security of Supply Report 2025, GOV.UK, 17 December 2025
- Gas demand and the gas network, House of Commons Library, 17 September 2026
- Factcheck: Nine false or misleading myths about North Sea oil and gas, Carbon Brief, 25 March 2026
- Gas from Norway, coal from Russia: eight graphs on the UK energy system, Carbon Brief, 12 April 2013
- Is the UK's limited gas storage capacity a problem?, Carbon Brief, 25 March 2013
- Getting off gas, Energy and Climate Intelligence Unit, 24 April 2023
- Net zero: solution to the gas crisis, Energy UK, 27 October 2022
- Factcheck: Less than 1% of UK gas supplies come from Russia, Carbon Brief, 16 March 2018
- Energy security in a turbulent world: why home-grown gas still matters, Institution of Gas Engineers and Managers, April 2026
- Which energy suppliers are British?, Uswitch, 26 June 2026
- Energy bills: how households could feel the cold this winter, UK Energy Research Centre, 2 November 2023
- How the global market is pushing up UK gas prices, Carbon Brief, 19 February 2013
- What the Middle East conflict means for your energy bills, Which?, 9 April 2026
- Gas and heating oil prices spike as energy risks mount, End Fuel Poverty Coalition, 4 March 2026
- Britons back insulation as most important route to curb Russian gas use, SWIGA, 20 September 2026
- Hydrogen for heating, Energy and Climate Intelligence Unit, 18 October 2021
- Where does my energy come from?, Uswitch, 3 August 2026
- What type of boiler should your next one be?, Which?, 17 February 2022
- Biomethane, SGN, 2026
- English Housing Survey 2023 to 2024: low carbon technologies fact sheet, GOV.UK, 2023-24
- Decarbonisation of heat, Energy Systems Catapult, 27 June 2025
- The role of gas heating in homes, Energy UK, 15 April 2025
- Renewing Britain report, MCS, September 2021
- Electric central heating, Which?, 22 September 2025
- Differences between green energy suppliers, Which?, 16 June 2026
- Cheese-making farm could show the whey to net zero, Wales & West Utilities, 3 March 2025
- The role of biomethane in reaching net zero, Institution of Gas Engineers and Managers, May 2025
- IGEM policy brief: policy asks of our new government, Institution of Gas Engineers and Managers, July 2024
- Boiler Upgrade Scheme consultation response, part 1, Institution of Gas Engineers and Managers, June 2025
- IGEM response to DESNZ alternative clean heating solutions consultation, Institution of Gas Engineers and Managers, February 2026
- Carbon Budget Delivery Plan, GOV.UK, 30 March 2023
- Spring Statement 2022, HM Treasury, March 2022
- Climate policy that cuts costs: international policy comparison, Climate Change Committee, 19 September 2026
- EVs and heat pumps reduced UK fossil fuel consumption in 2023, Ember, 21 October 2024
- Scottish Energy Strategy: the future of energy in Scotland, Scottish Government, 2025
- What's in an energy bill: wholesale costs, Nesta, 22 November 2024
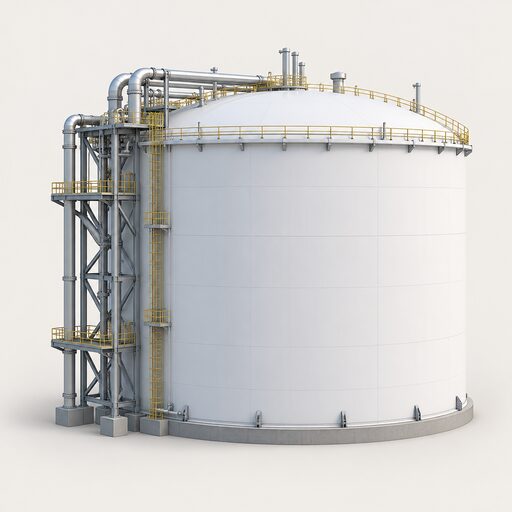 LNG Imports and TerminalsHow much of Britain's gas arrives by ship, where does it come from, and why does a damaged plant in Qatar or a storm of bidding in Asia change what a household pays?
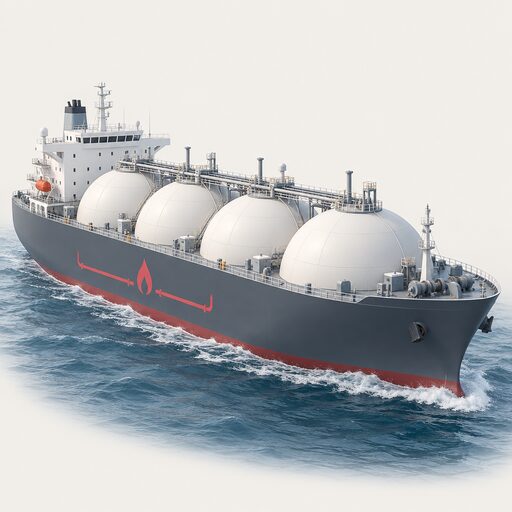 The Full Where Our Energy Comes From GuideWhere does the gas in your boiler and the electricity in your sockets actually come from?
 Gas Pipelines and LinksWhere does the gas in your home actually come from, and what happens when it gets really cold and the wind stops blowing?
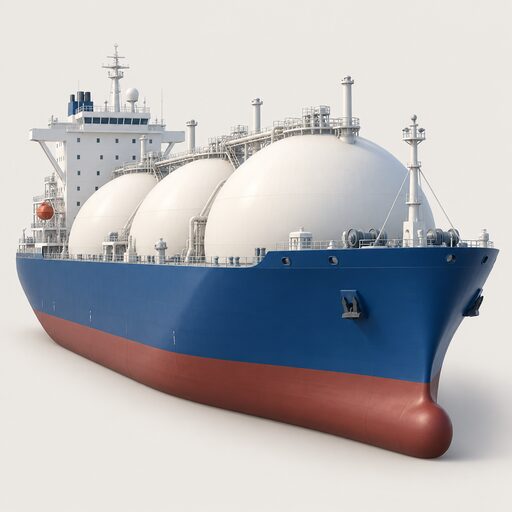 Household Import DependenceGas and oil make up most of what a typical UK home spends on energy, and roughly half of that gas comes from abroad.
 UK Gas StorageHow much working gas storage Great Britain holds, what the eight remaining sites do, how storage is filled and drawn down across a winter, and how Britain's position compares with continental Europe.
 UK Electricity Generation MixBreaks down the shares of gas, wind, nuclear, solar, biomass, hydro and imports in UK electricity generation, how those shares move by hour and season, where the published figures come from, and what the mix means for a household's energy independence.