In this guide
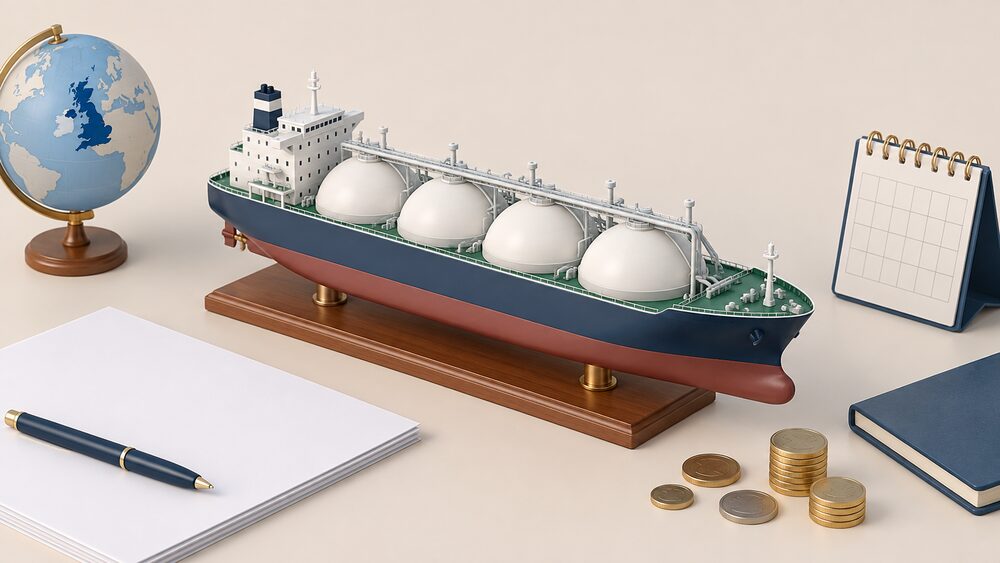
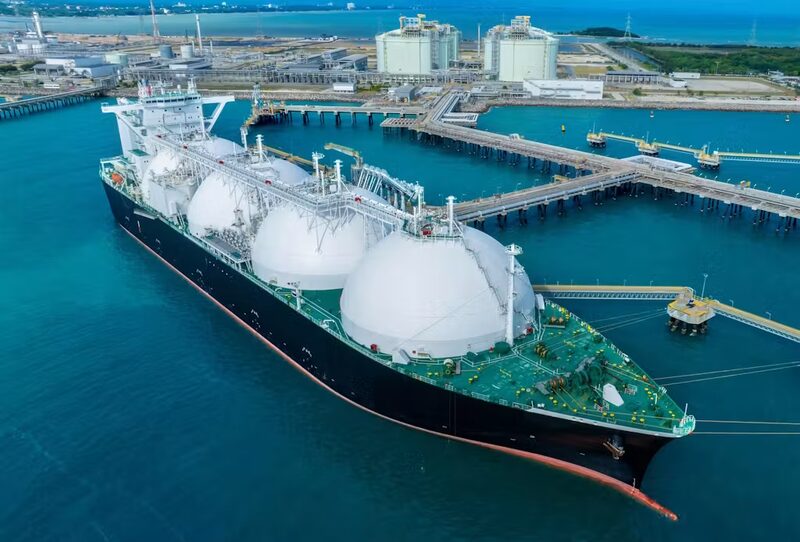
Liquefied natural gas (LNG) is natural gas cooled to a liquid so that it can be shipped by tanker, then warmed back into gas on arrival and fed into Britain's pipeline network. Great Britain can take in up to 150mcm/d of gas from LNG, out of a total import capacity of around 368 million cubic metres per day (134 billion cubic metres a year). Over the past five years, LNG shipments have made up 21% of the UK's gross annual gas supply, behind gas from the UK Continental Shelf (43%) and the Norwegian Continental Shelf (35%)1.
The UK has been a net importer of natural gas since 2004, when domestic supplies stopped meeting demand2. LNG fills part of that gap. Its share moves a great deal from year to year: a March 2026 analysis put LNG imports at around 15% of the UK's gas3, while total LNG imports fell to 111,000 GWh in 2024, a 31% decrease on the peak after the 2022 crisis4.
Because LNG cargoes are traded on a world market, they go wherever buyers pay most. That is how competition from Asia and continental Europe feeds into the wholesale gas price in Britain, and from there into household bills. For a home on mains gas, LNG is a source of flexibility in winter and, at the same time, one of the most direct links between a kitchen boiler and events on the other side of the world.
LNG is gas shipped as a liquid, and the UK needs it because it imports
The UK is "a net energy importer with a high dependence on gas and oil" in the Treasury's words6, and specifically a net importer of natural gas, meaning it imports more than it exports. The House of Commons Library draws the consequence plainly: the UK is vulnerable to global price volatility because of that position7.
The North Sea still supplies a large share, but not enough. The Scottish Government's energy strategy expected the UK to be importing 67% of its gas from outside the UK by 20258. Norway reaches Britain by pipeline; Belgium and the Netherlands through interconnectors under the Channel. Everything else arrives by sea, as LNG.
LNG has been part of the picture for well over a decade. In 2011 LNG imports made up about a quarter of total UK gas consumption, which made the UK the world's third biggest importer of LNG that year2. The advantage of shipped gas is that it is not tied to one pipeline or one producing country: a terminal can in principle receive cargoes from any exporting nation. The disadvantage is the mirror image: every cargo can also go somewhere else.
For a householder the point is not the chemistry but the market. Pipeline gas from Norway or the UK Continental Shelf flows more or less continuously; LNG is bought cargo by cargo, and the price of each is set by whoever wants it most at that moment. More on this is on the wholesale energy markets page and in the wider picture of where Britain's gas comes from.
Terminal capacity: 150mcm/d of Britain's 368mcm/d import route
Britain's LNG terminals together give Great Britain 150mcm/d of LNG import capacity, the largest single block of its import capacity. By comparison, capacity from Belgium and the Netherlands through interconnector pipelines is 83mcm/d. Total import capacity, across pipelines and LNG, is around 368mcm/d, or 134bcm a year1.
| Import route | Capacity | Share of gross annual supply (five-year average) |
|---|---|---|
| LNG terminals | 150mcm/d | 21% |
| Interconnectors from Belgium and the Netherlands | 83mcm/d | 1% |
| All import routes | around 368mcm/d (134bcm/y) | not applicable |
Source for all figures: DESNZ Statutory Security of Supply Report 20251.
The gap between capacity and use matters. LNG terminals have more capacity than they typically use, because their value lies partly in being able to take extra cargoes when Britain needs them, in winter or when another source fails. A terminal standing ready is a form of insurance, but it only pays out if cargoes can actually be secured.
Once gas leaves the terminal it enters the high pressure National Transmission System, which is owned and operated by National Gas Transmission and carries gas from terminals and ports across Great Britain9. Details of that backbone are on the National Gas Transmission page.
Northern Ireland's gas arrives by a different route and is covered separately on energy supply in Northern Ireland. In Scotland, LNG plays a particular role beyond the main grid: LNG and LPG supply the Scottish Independent Undertakings serving Oban, Campbeltown, Wick, Thurso and Stornoway, towns not connected to the national network8.
How a cargo reaches your boiler
The journey from a producing country to a household appliance runs through several stages, each owned by a different organisation.
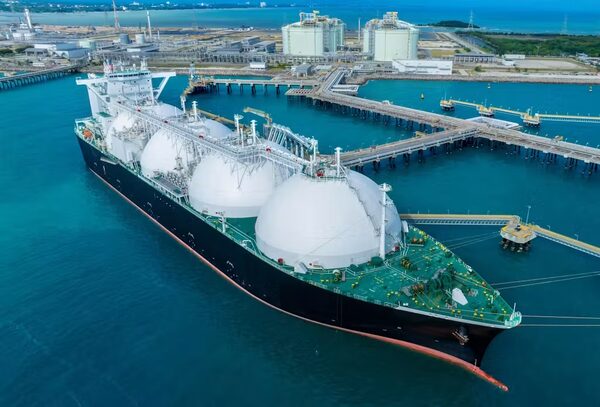
- Gas is liquefied at an export plant, such as those in Qatar or the United States, and loaded onto a tanker.
- The cargo sails to Britain, if it has been sold to a buyer delivering here. Routes and destinations can change while at sea.
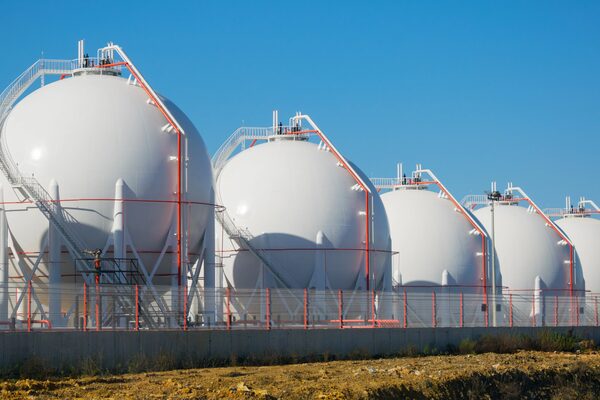
- At the UK terminal the liquid is unloaded, stored, and regasified.
- The gas enters the National Transmission System, the high pressure pipelines run by National Gas Transmission from terminals and ports9.
- Regional gas distribution networks take it at lower pressure to streets and homes.
- It is burned in the home. Boilers are usually fuelled by gas or oil, and sometimes by liquid petroleum gas (LPG) or biomass10.
Once LNG gas is in the pipes, it mixes with gas from the North Sea, Norway and the Continental interconnectors. No household receives "LNG gas" as such, and no supplier sells it as a separate product. Which network carries it to a particular street depends on location: Cadent, Northern Gas Networks, SGN and Wales & West Utilities each serve different regions, and the postcode lookup explains how to find which.
LNG is not the same as LPG. LPG (bottled or bulk propane and butane) is delivered by road and stored in a tank at the property rather than piped in11; LNG supplying mains gas homes arrives through the same pipes as all other gas. The heating oil and LPG supply page covers off-grid fuels.
Where UK LNG comes from: Qatar, the US and beyond
For most of the past two decades, "LNG" in Britain meant Qatar. Qatar has accounted for 70 to 97% of LNG volumes imported to the UK since 20055. In 2011, 87 per cent of the UK's LNG imports came from Qatar, which Carbon Brief described as "a lot of gas from one place"2. Consumer guides still describe UK LNG as arriving "in a liquid state from Qatar"12, and Uswitch reports that 30% of UK natural gas imports come from Qatar13. Other guidance lists UK gas as coming from the North Sea, Norway, the Middle East and North Africa14; Algeria was among the five countries accounting for the vast majority of UK imports up to 2017, alongside Norway, the Netherlands, Belgium and Qatar5.
The United States changed the picture. The first cargo from the newly started Cove Point export plant, the Gemmata, was due to arrive in the UK on 20 March 20185. By 2022, UK LNG imports from the United States had risen to 138,000 GWh4. In April 2026, Which? reported the shift in plain terms:
"we're getting a lot more gas now from places like the US and much less from places like Qatar"
| Supplier country | What the evidence shows | Period |
|---|---|---|
| Qatar | 70 to 97% of UK LNG volumes | since 20055 |
| Qatar | 87 per cent of UK LNG imports | 20112 |
| United States | 138,000 GWh of UK LNG imports | 20224 |
| United States | "a lot more gas" than in 2022 | April 202615 |
| Russia | just over 5,000 GWh, an 85% decrease | 20224 |
The move from one dominant supplier to several spreads the risk of any single plant failing, which the Qatari disruption of 2026 has made concrete. It does not remove dependence on the world market: US cargoes are sold to whichever buyer pays most, just as Qatari ones are.
How much of Britain's gas arrives as LNG
The share depends heavily on the year and on how it is measured, and the figures below are not directly comparable because they cover different periods and bases.
- 21%: LNG's share of UK gross annual gas supply, five-year average, official figure published December 20251.
- around 15%: LNG imports as a share of UK gas, March 2026 analysis3.
- 111,000 GWh: total UK LNG imports in 2024, a 31% decrease4.
- 8%: LNG's share of UK supplies in 2017, mostly from Qatar5.
- 2.9%: LNG's share of supplies in 2018 up to the March cold snap, including 0.4 percentage points from Russia5.
- about a quarter: LNG's share of UK gas consumption in 20112.
Why the swings? LNG is the marginal source. North Sea and Norwegian gas flow steadily; LNG is drawn in when British prices are high enough to attract cargoes away from Asia and Europe, and it drops away when they are not. After Russia's invasion of Ukraine, Europe pulled in far more LNG to replace Russian pipeline gas, and Britain acted as a landing point. That explains the 2022 peak and the later fall to 111,000 GWh in 20244.
Estimates of overall import dependence also vary. Cadent put it at around 50% of UK gas imported from international markets, mainly from Norway, Qatar, the United States and the Netherlands16; the Scottish Government expected 67% by 20258. The official supply shares show the North Sea still matters most: UK Continental Shelf gas averaged 43% of gross annual supply over five years1.
A measure of scale comes from the power sector. A March 2026 analysis estimated that generating the electricity produced by wind and other sources in 2025 from gas instead would have required around 200TWh of fuel, equivalent to three-quarters of UK LNG imports3. How that generation mix has shifted is covered on the UK electricity generation mix page.
LNG versus pipeline imports: which does what
Pipelines and LNG do different jobs in the system. Pipeline gas from Norway and the UK Continental Shelf provides the steady base: 35% and 43% respectively of gross annual supply1. Interconnector pipelines from Belgium and the Netherlands supply only 1% on average over the year, yet they "play a key role in balancing supply and demand on cold winter days"1. Netherlands pipeline imports fell to 2% of UK supplies in 2017, and in early 2018 other pipelines accounted for another 20% of demand5.
LNG sits between the two. It is larger than the interconnectors in normal years and brings in gas from outside Europe altogether, but it is less predictable than Norwegian pipeline gas, since each cargo is a separate commercial decision.
| Pipeline imports | LNG | |
|---|---|---|
| Physical route | Fixed pipes from Norway, Belgium, the Netherlands | Tankers from any exporting country |
| GB import capacity | 83mcm/d from Belgium and the Netherlands1 | 150mcm/d1 |
| Typical role | Base supply (Norway); winter balancing (interconnectors) | Flexible top-up, drawn in by price |
| Main risk | Failure or maintenance of a single route | Cargoes diverted to higher-paying buyers; disruption at distant plants or on shipping lanes |
The two are linked through Europe. When Russian pipeline gas to continental Europe was cut, Europe competed harder for LNG, and that competition lifted prices in Britain. Ofgem's July 2025 price cap summary still cited "the continued reduction in Russian pipeline gas since January" as part of the GB and European supply context17. More detail is on gas pipelines and interconnectors.
When cargoes are cancelled or rerouted
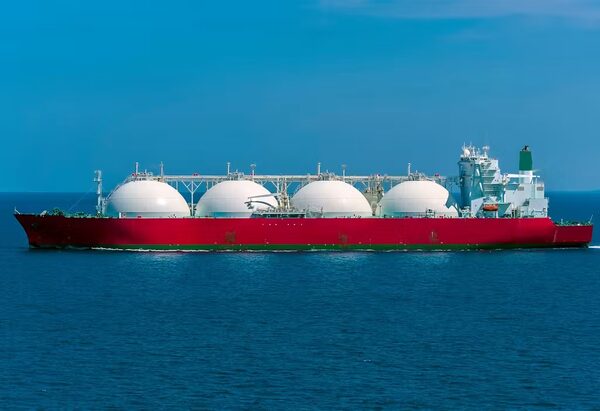
LNG's flexibility cuts both ways. A cargo heading for Britain can be diverted to Asia or Europe if prices there rise, and a cargo bound elsewhere can be pulled to Britain when British prices spike.
The second has happened in Britain's favour. In March 2013, The Times reported UK gas storage 10 per cent full and a Qatari LNG tanker rerouted to top up UK supplies18. In March 2018, a price spike caused by freezing temperatures drew additional LNG cargoes to the UK, including three from Russia; gas demand during that cold snap was 40% above the usual level5.
The first is the risk. Cancellation at source is different again: it happens when the export plant itself cannot load. In 2026, Which? reported that "a lot of Qatari facilities that produce gas, for instance, have been damaged and that could take years to rebuild"15. In March 2026 Cornwall Insight forecast that bills would rise from 1 July by 10% to around £1,800 for the average household amid Middle East conflict and Qatari LNG disruption. In September 2026 QatarEnergy was reported to have cancelled five further cargoes, due between late September and early November, after damage at Ras Laffan, and to be seeking multi-year US supply through 2031. In the same month, Houthi forces were reported to have taken control of Yemen's Red Sea coastline between 10 and 14 September, adding a war risk premium to LNG shipping.
Supply growth offers some counterweight. Global LNG supply rose by 4% (or 12bcm) in the first half of 2025, and around 300bcm of new LNG export capacity is expected to begin production by 20301. Higher prices also cut demand elsewhere: around 81GW of planned gas power capacity in Asia was cancelled in 2022 and 2023 amid LNG supply disruptions and price spikes. How such events pass through to bills is covered on global events and UK energy prices.
Russian LNG and the import ban
Russia was never a large source of UK LNG, but it was a real one. Russian LNG shipments to the UK began after the Yamal LNG terminal in Siberia opened in December 2017; before then they were not recorded in government data. Of the six LNG shipments the UK received in early 2018, three were from Russia5. An analyst quoted at the time put it this way:
"Russian LNG from Yamal has supplied approximately 0.4% of the UK's gas demand so far this year,"
Before the 2022 invasion of Ukraine, the UK got just 5 to 6% of its gas imports from Russia, equal to 3 to 4% of UK consumption19. By 2022, UK LNG imports from Russia had fallen to just over 5,000 GWh, an 85% decrease4.
The government's 2022 energy security strategy committed to phasing out Russian oil and coal by the end of 2022, with Russian LNG imports to end as soon as possible thereafter. Regulations banning the import and acquisition of LNG from Russia came into force on 1 January 2023.
Storage: a thin buffer behind the terminals
Britain holds little gas in reserve, which puts more weight on imports, including LNG, arriving on time. Great Britain has eight gas storage facilities1. A 2013 analysis found that the UK had the capacity to store the equivalent of four per cent of its annual consumption, about fourteen days' supply, and "less gas storage relative to its consumption than any other major European economy"18. Gas is stored in above-ground tanks and underground in depleted oil and gas fields, water aquifers and salt caverns18. The Rough facility in the North Sea, the UK's main storage site, was reported in 2018 as set to close5.
LNG terminals hold gas on site in their own tanks, but these exist to receive and regasify cargoes rather than to serve as a national reserve. In practice the UK relies on its ability to import at short notice, through 150mcm/d of LNG capacity and the Continental interconnectors, in place of large stocks. The storage picture is set out on UK gas storage and Rough gas storage, and emergency arrangements on gas supply emergencies.
What LNG means for household energy independence

For a home on mains gas, LNG adds reach: Britain can buy gas from Qatar, the United States and elsewhere, rather than relying only on the North Sea and Norway. That spreads physical risk. It does not spread price risk. Because each cargo goes to the highest bidder, the price of every unit of gas in Britain, including North Sea gas, tends to follow the world LNG price when the market is tight.
The energy crisis showed the result. UK household gas prices were temporarily among the most expensive in Europe in the first half of 202320. The 2026 Qatari disruption fed into a forecast 10% rise in bills from 1 July. A household cannot choose to buy only British or only pipeline gas; the gas in the pipes is shared, and so is its price.
The dependence that remains for a gas-heated home is layered:
- on the world LNG market and the buyers in Asia and Europe competing in it;
- on export plants and shipping lanes thousands of miles away;
- on National Gas Transmission and the regional distribution network;
- on a licensed supplier and the price cap that passes wholesale costs through.
Homes off the gas grid face a different, but related, exposure. Some two million properties in the UK are off-grid and depend on alternative fuels for heating and cooking21, and around two hundred thousand households use LPG11. Their fuel does not come through LNG terminals, but its price moves with the same global energy markets.
What a household controls is how much gas it needs at all: insulation, heating controls and a switch to electric heating each reduce exposure to cargo prices, though an electric home then depends on the grid, which itself burns gas for part of its output. The choices and their limits are set out on energy security and household independence, within the wider UK energy supply picture.
Sources21 cited
- Statutory Security of Supply Report 2025, Department for Energy Security and Net Zero, 2025-12-17
- How the global market is pushing up UK gas prices, Carbon Brief, 2013-02-19
- Factcheck: Nine false or misleading myths about North Sea oil and gas, Carbon Brief, 2026-03-25
- Lessons from very recent history: how global energy shocks affect UK households, Nesta
- Factcheck: Less than 1 per cent of UK gas supplies come from Russia, Carbon Brief, 2018-03
- Spring Statement 2022, HM Treasury, 2022-03
- Domestic energy prices briefing, House of Commons Library, 2022-01
- Scottish Energy Strategy: the future of energy in Scotland, Scottish Government, 2017-12-20
- Call for input on disconnections, Ofgem, 2025-01-13
- Heating your home, Energy Saving Trust, 2026-05-19
- LPG central heating, Which?, 2025-09-22
- Where does my energy come from?, Uswitch, 2026-08-03
- Which energy suppliers are British?, Uswitch, 2026-06-26
- Heating fuel guide, Uswitch, 2026-01-27
- What the Middle East conflict means for your energy bills, Which?, 2026-04-09
- The five benefits of hydrogen, Cadent, 2022-10-12
- Summary of changes to the energy price cap, 1 July to 30 September 2025, Ofgem, 2025
- Is the UK's limited gas storage capacity a problem?, Carbon Brief, 2013-03-25
- Briefing: Ukraine conflict and impacts on UK energy, Energy and Climate Intelligence Unit, 2022-02-28
- International energy prices briefing, House of Commons Library, 2023
- New to LPG, Liquid Gas UK, 2026-09-20
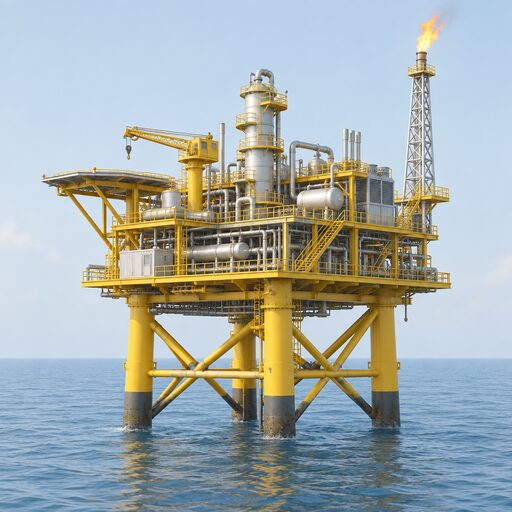 Where Britain's Gas Comes FromWhere does the gas in British homes actually come from, and how much of it is ours?
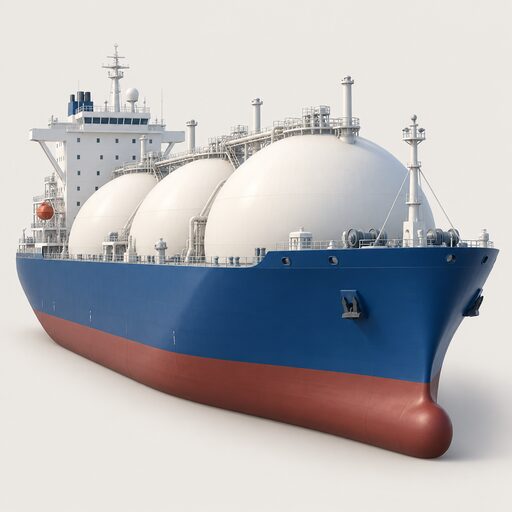 Household Import DependenceGas and oil make up most of what a typical UK home spends on energy, and roughly half of that gas comes from abroad.
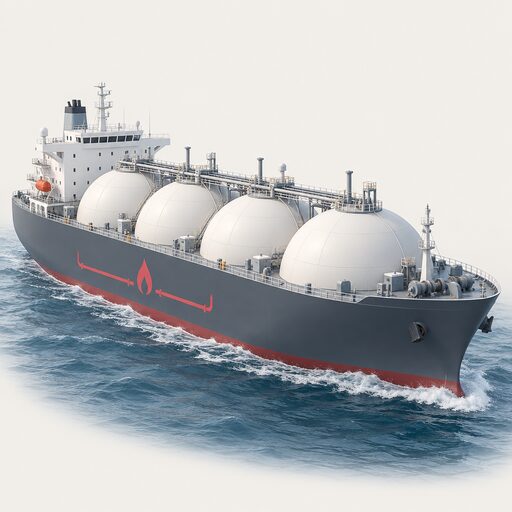 The Full Where Our Energy Comes From GuideWhere does the gas in your boiler and the electricity in your sockets actually come from?
 Gas Pipelines and LinksWhere does the gas in your home actually come from, and what happens when it gets really cold and the wind stops blowing?
 Global Events and UK PricesWhy do gas prices here go up when something happens far away?
 Heating Oil and LPG SupplyHow heating oil and bulk LPG reach off-grid homes, who owns the tank, what the fuels cost, why neither is covered by the price cap, and what supply risk looks like in winter.