

In this guide
Wholesale costs are the cost a supplier pays to buy energy, and they are the largest single component of a British household energy bill1. The market that produces those costs is not one market but several: gas trades at the National Balancing Point, electricity trades day ahead and within the day, and the price of the last plant needed to meet demand sets the price paid to all generators. Because gas fired plants are usually that last plant, gas often sets the electricity price even when wind is plentiful.
That price does not reach a household directly. It reaches it through the default tariff cap, which Ofgem sets every three months and which limits the unit rate and standing charge rather than the total bill2. For 1 October to 31 December 2025 the cap for a typical household using electricity and gas and paying by Direct Debit in England, Scotland and Wales was £1,755 a year3. Wholesale costs made up 37.5% of the average GB electricity bill at the Q1 2025 cap4.
The government has confirmed its decision to retain a single UK wide wholesale market and proceed with Reformed National Pricing5. That decision matters to households because it determines whether the price a home pays reflects the cost of the power nearest to it or a national average. The sections below set out how the markets work, what the cap adds on top, and where the limits of both lie.
What the wholesale market is and how it sets the price of energy
The wholesale market is where suppliers buy the energy they later sell to homes. Gas is bought and sold at the National Balancing Point, the virtual trading point for the British gas system, and electricity is traded in a sequence of markets running from years ahead down to the half hour of delivery. The day ahead market for Great Britain settles the price for each half hour of the following day, and intraday trading continues up to gate closure.
The pricing mechanism that matters most to a household bill is marginal pricing. Every generator whose output is needed to meet demand in a given half hour is paid the price of the most expensive plant required, not its own cost. That single clearing price is what suppliers pay, and it is why the wholesale cost of electricity tracks the cost of gas so closely: gas fired generation is frequently the marginal plant, so its fuel cost becomes the reference price for the whole market.
The consequence is that a windy afternoon does not automatically produce a cheap afternoon. Wind has near zero marginal cost, so it displaces the most expensive plant and lowers the clearing price when it is generating. When wind output falls, the marginal plant is more likely to be gas, and the price rises accordingly. The relationship is a matter of which plant is marginal at that moment, not of how much renewable capacity exists in total.
For a household, this structure means the price of electricity is exposed to a fuel it may not use directly. A home with a heat pump and no gas connection still pays a price shaped by gas. That is the dependence the market design creates, and it is the reason reform proposals focus on the marginal pricing rule rather than on retail tariffs.
"wholesale costs, the cost a supplier pays to buy energy"
From wholesale cost to household bill: what the price cap adds on top

Wholesale cost is one line in a bill, not the whole of it. Ofgem's cap methodology builds the maximum price from several allowances: wholesale energy, network costs for transporting energy, scheme costs for government programmes, operating costs, and a margin. The wholesale allowance is set so that the cap tracks and reflects the efficient costs of serving cap customers over time10.
The relative weight of these components has shifted. Wholesale costs made up 37.5% of the average GB electricity bill at the Q1 2025 cap4. Analysis of the rise in bills since pre-crisis levels attributes 54% to higher wholesale prices, with network charges and green levies accounting for 20% and 6% of the rise respectively11. The remainder comes from other components including operating costs and margin.
Ofgem has also examined whether the wholesale allowance itself is set at the right level. A 2023 review compared maximum allowances with actual costs and found a maximum of £165 per standard variable tariff customer at benchmark consumption across cap periods 9a to 10b, against an upper quartile figure of £6912. Those figures are the regulator's own assessment of the gap between what the cap permits and what suppliers spend.
The practical effect for a household is that the cap is a constructed price, not an observed one. It reflects a modelled supplier's costs at a modelled consumption level. A household whose supplier is more efficient than the benchmark, or less, pays the same capped rate either way, because the cap is a maximum rather than a cost pass-through.
The price cap: a limit on the unit rate and standing charge, not the total bill
The cap protects people on standard variable tariffs, where the unit rate can go up or down depending on the energy market2. It applies where a customer has not signed up for a fixed-term contract with their supplier, and it sets maximum prices for a unit of energy and daily standing charges for customers in each energy supply region of Great Britain8.
Two numbers make up the cap. The unit rate is the price per kilowatt hour, so it scales with how much energy is used. The standing charge is a fixed daily amount, charged whether or not any energy is used, covering supply, metering and network costs. Ofgem sets a maximum for each separately, and the annual figure quoted in the news is the product of those maxima at assumed consumption.
The cap came into force at the beginning of 2019 and currently protects around 28 million customers in Great Britain8. Its statutory basis is the Domestic Gas and Electricity (Tariff Cap) Act 2018, which provides that tariff cap conditions do not apply to domestic customers who benefit from the prepayment charge restriction order or a replacement cap13. That carve-out reflects the separate protection that already existed for prepayment customers.
The distinction between a rate cap and a bill cap is the single most misunderstood feature of the scheme. A household that uses more than the assumed consumption pays more than the headline figure, and one that uses less pays less, on identical unit rates. The cap constrains the price of energy, not the amount of it a home chooses to buy.
| Element | What it limits | What it does not limit |
|---|---|---|
| Unit rate | Price per kWh of gas or electricity | Total energy used |
| Standing charge | Daily fixed charge | Number of days supplied |
| Annual figure | Cost at assumed consumption | A household's actual annual bill |
How the cap is calculated: the cost components behind your unit rate
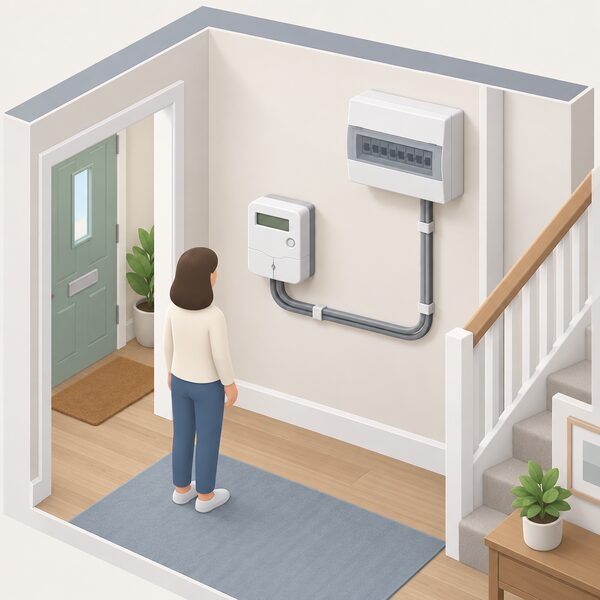
The cap is built from allowances rather than from a supplier's actual accounts. Ofgem's wholesale costs review set out maximum allowances per standard variable tariff customer at benchmark consumption, and compared them with observed costs to test whether the allowance was adequate12. The methodology is periodically reviewed, and the wholesale allowance in particular is the subject of current consultation.
The components fall into recognisable groups. Wholesale energy is the cost of buying the gas and electricity. Network costs cover transmission and distribution, the wires and pipes that deliver energy. Scheme costs fund government programmes, including support for vulnerable customers and environmental obligations. Operating costs cover billing, metering and customer service, and a margin allows the supplier a return.
The scheme costs are not trivial. The Feed-in Tariffs scheme, for example, spreads its costs across all licensed electricity suppliers in Great Britain through a levelisation process based on their share of the electricity supply market14. That mechanism is why a closed scheme can still appear on a current bill: the obligation to pay it outlives the scheme's closure to new applicants.
For a household, the composition of the cap explains why a fall in wholesale prices does not translate pound for pound into a fall in the bill. Network and scheme costs are largely fixed in the short term, so a wholesale movement of a given size produces a smaller movement in the capped rate. It also explains why the cap can rise when wholesale prices are flat, if other components have increased.
Reviewed every three months: how and when the cap changes
Ofgem sets the price cap level every three months2. The regulator reviews and sets a level for how much an energy supplier can charge for each unit of energy and daily standing charge on that cycle3. Announcements come roughly six weeks before the period they cover begins, so a household learns the next quarter's rates before they take effect.
The quarterly rhythm is a deliberate design choice. It protects consumers from the rapid changes observed in the wholesale energy market in the short term, while still allowing the cap to track sustained movements in cost15. A longer interval would leave suppliers exposed to wholesale swings between reviews; a shorter one would expose households to them.
Recent periods illustrate the pattern. The cap for 1 April to 30 June 2025 was £1,849 for a typical dual fuel customer paying by Direct Debit, a fall of £129 or 7% from the previous period16. For 1 July to 30 September 2025 the Economy 7 standard credit cap carried an additional £82 compared with Direct Debit16. For 1 October to 31 December 2025 the typical monthly figure rose to £102 from £1006.
The cap for 1 April to June 2026 was confirmed to fall by 7%17. Ofgem's own guidance notes that estimates suggest it is expected to stay roughly the same until the end of the year17. The next period begins on 1 January 2027, announced in late November 2026.
Regional variation: 14 separate caps across Great Britain
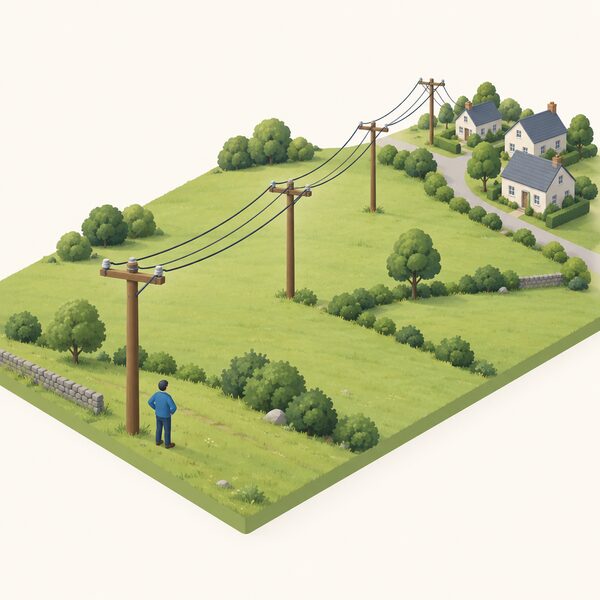
A separate price cap is set for each of the 14 regions and applies throughout the region, with no breakdown below regional level8. The regional differences are driven by the cost of distributing energy to that area, not by the wholesale price, which is national. Two households on identical tariffs in different regions therefore pay different capped rates for the same energy.
The scale of the variation is visible in the published levels. For 1 October to 31 December 2025, the North West electricity cap was £177.83 at nil consumption and £978.21 at 3,100 kWh on a single rate, while London was £160.10 and £916.85 on the same basis19. North Wales and Mersey was higher still at £243.15 and £1,061.64, and the Northern region at £208.10 and £935.81 on prepayment19.
The pattern is not a simple north south split. Standing charges and unit rates move independently, so a region can have a high standing charge and a comparatively low unit rate, or the reverse. The Eastern region, for example, had a nil consumption figure of £167.73 and a 3,100 kWh figure of £926.96 on prepayment19.
For a household, regional variation means that a national headline figure is an average of fourteen different caps. Comparing a bill with a figure quoted for another region is not comparing like with like. The relevant cap is the one published for the supply region the property sits in.
| Region | Nil consumption | 3,100 kWh single rate | Basis |
|---|---|---|---|
| North West | £177.83 | £978.21 | Other payment method19 |
| London | £160.10 | £916.85 | Other payment method19 |
| N Wales and Mersey | £243.15 | £1,061.64 | Other payment method19 |
| Northern | £208.10 | £935.81 | Prepayment19 |
| Eastern | £167.73 | £926.96 | Prepayment19 |
Payment method matters: Direct Debit, standard credit and prepayment levels
The cap varies by where you live, payment method, fuel type and meter type2. Payment method is the factor a household can most readily change, and the differences are material. Customers who pay by standard credit, that is cash or cheque, paid an additional £106 compared with Direct Debit in cap period 12a20.
The gap persists across meter types. For electricity only customers on Economy 7 meters, standard credit carried an additional £84 compared with Economy 7 Direct Debit21. For the 1 July to 30 September 2025 period the Economy 7 standard credit premium was £8216. These are annual figures at the assumed consumption for that meter type.
Prepayment has moved in the opposite direction. For 1 April to 30 June 2025, Economy 7 prepayment customers paid £25 less compared with paying by Direct Debit22. For 1 July to 30 September 2025 the figure was £30 less16. The mechanism behind this is the levelisation allowance, which makes sure prepayment and Direct Debit customers pay the same standing charge2.
The levelisation allowance has a measurable effect. From 1 April 2024, prepayment customers typically paid £49 a year less, or £52 a year less including VAT20. The allowance is funded across the supplier base rather than falling on the customers who benefit, which is why the prepayment cap can sit below the Direct Debit cap while the standing charges are equalised.
For a household, the practical point is that the payment method is part of the price. A household on standard credit pays more for the same energy than one on Direct Debit, and a prepayment customer pays less than both on the current settlement. None of these differences reflects the cost of the energy itself.
Who the cap does not cover: fixed tariffs, heat networks and off-gas homes
The cap applies to default tariffs regardless of payment method, but not to fixed, green or time of use tariffs17. A household that has agreed a fixed tariff with its supplier is outside the cap for the duration of that contract2. The cap applies where a customer has not signed up for a fixed-term contract with their supplier8.
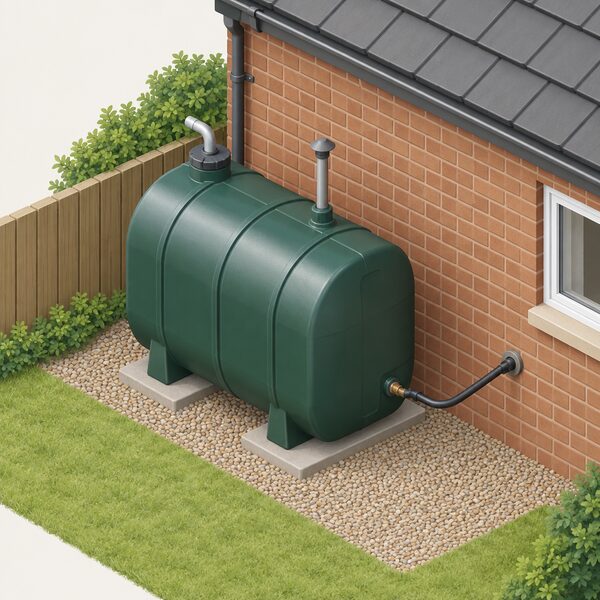
Several other groups sit outside it entirely. Heat networks are not covered by the Ofgem energy price cap or by the UK government's Energy Price Guarantee, because they are classed as commercial supplies23. Heating oil is not covered by Ofgem's energy price cap, leaving consumers fully exposed to sudden market increases24. Business energy contracts are outside it as well2.
There is one important protection for households that have not chosen a supplier. A household is still covered by the energy price cap even if it is put on a deemed contract, for example after a supplier ceases trading7. That matters because a supplier failure moves customers onto a deemed contract automatically, and the cap continues to apply to it.
For a household, the boundary of the cap defines where market exposure begins. A fixed tariff trades the cap's protection for price certainty, and a heat network or oil heated home has neither. The cap is a default protection for those who have not contracted out of it, not a universal ceiling on the price of domestic heat.
How wholesale price swings reach your bill: the crisis peak and since
The link between wholesale prices and household bills is easiest to see at the extremes. The daily UK wholesale gas price peaked at just over 17 p/kWh in early March 20229. That movement fed through into the cap with a lag, because the cap is set quarterly from a trailing assessment of wholesale costs rather than from the spot price on the day.
The result is a bill that has risen far more than the wholesale component alone would suggest. Electricity prices under the cap are 38% higher than in mid 20218. Analysis of the rise since pre-crisis levels attributes 54% to higher wholesale prices, with network charges and green levies accounting for 20% and 6% respectively11.
The pass-through is also asymmetric in timing. A wholesale spike reaches the cap at the next quarterly review, and a wholesale fall does the same. That is why the cap can rise in a period when spot prices have already fallen, and fall in a period when they have risen. The cap reflects an average of recent wholesale costs, not the price on the day the bill arrives.
For a household, this lag is the reason the cap is described as protection from rapid change rather than from high prices. It smooths the path of the bill, but it does not cap the level. A sustained wholesale movement, up or down, eventually reaches the unit rate in full.
What happens next: balancing and settlement reforms and the cap outlook
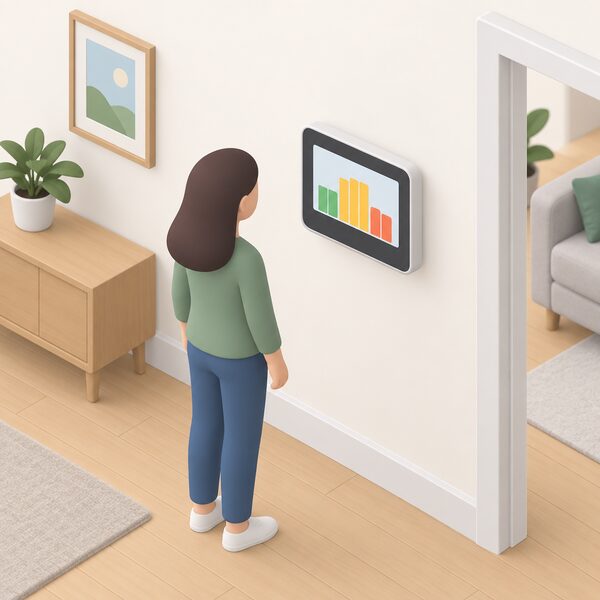
The most significant change in train is Market-wide Half-Hourly Settlement, which Ofgem lists as a strategic priority for its price cap programme in 2026 and 202725. The reform moves settlement to half-hourly periods across the market, which allows prices to reflect when energy is used rather than only how much.
Ofgem consulted on how to adapt the wholesale allowance of the energy price cap to accommodate Market-wide Half-Hourly Settlement, seeking views on updating how the cap level is set for single-rate customers and on whether to account for differences in the cost to serve different customer groups and suppliers10. That consultation opened on 25 March 2026 and closed on 6 May 202610.
The direction of travel is towards time of use pricing. Ofgem is developing the cap for customers who want to change how and when they use electricity, for example paying by time of use where the price varies depending on when customers use it10. The government has separately stated its intention to follow up with a consultation on options for reform of the retail market26.
On market structure, the government has confirmed its decision to retain a single UK wide wholesale market and proceed with Reformed National Pricing5. That settles the question of whether locational pricing would replace national pricing, at least for now. Decisions on balancing and settlement reforms are expected from the second half of 2026 onwards.
For a household, the practical implication is that the unit rate may become more dependent on when energy is used and less on a single national average. That offers a route to lower bills for homes that can shift load, and a new form of exposure for homes that cannot. The cap is being adapted to accommodate that shift rather than to prevent it.
Sources26 cited
- Check if you are owed money on your energy bill, Ofgem, 2026
- Energy price cap, Ofgem, 2026-09-17
- Changes to the energy price cap between 1 October and 31 December 2025, Ofgem, 2025
- Tackling fuel poverty in Scotland: periodic report 2021 to 2024, Scottish Government, 2025
- DESNZ annual report and accounts 2025 to 2026: performance report, GOV.UK, 2026
- Energy price cap will rise 2 percent in October, Ofgem, 2025-08-27
- What happens if your energy supplier goes out of business, Ofgem, 2026
- The energy price cap, House of Commons Library, 2026-09-20
- Energy prices and the price cap, House of Commons Library, 2024-07
- Energy price cap: technical approach to market wide half hourly settlement, Ofgem, 2026-03-25
- Electricity prices in Great Britain, House of Lords Library, 2026-06
- Energy price cap wholesale costs review, Ofgem, 2023-12-15
- Domestic Gas and Electricity (Tariff Cap) Act 2018, legislation.gov.uk, 2018-07-19
- Feed-in Tariffs scheme, Ofgem, 2026
- Spring Statement 2022, HM Treasury, 2022-03
- Summary of changes to the energy price cap, 1 July to 30 September 2025, Ofgem, 2025
- Energy price cap explained, Welsh Government, 2026
- What the Middle East conflict means for your energy bills, Which?, 2026-04-10
- Energy price cap levels, 1 October to 31 December 2025, Ofgem, 2025
- Default Tariff Cap letter, 1 April 2024, Ofgem, 2024-02-23
- Summary of changes to the energy price cap, 1 October to 31 December 2025, Ofgem, 2025-08-27
- Summary of changes to the energy price cap, 1 April to 30 June 2025, Ofgem, 2025
- Edinburgh local heat and energy efficiency strategy, City of Edinburgh Council, 2023-12
- Cost of living pressures and soaring prices expose gaps in bulk fuel checks, Chartered Trading Standards Institute, 2026-03-16
- Energy price cap programme of work 2026 and 2027, Ofgem, 2026-08-26
- Delivering a better energy retail market, GOV.UK, 2023-07-24
 Wholesale Prices and BillsGas prices around the world keep changing, so why do your bills move so slowly, and why does gas still set what you pay for electricity?
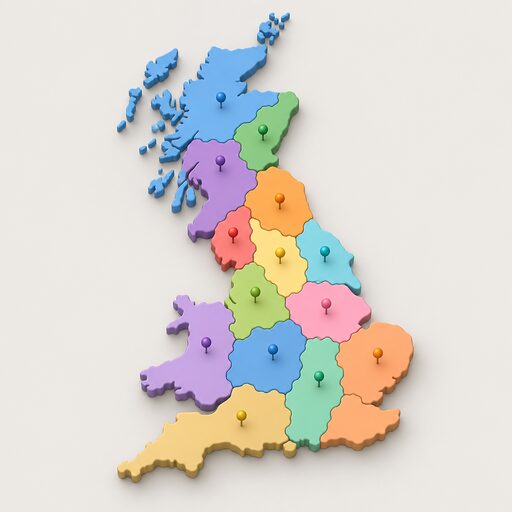 Unit Rates by RegionWhy do electricity and gas prices differ depending on where you live?
 Energy Price CapThe price cap sets the most you pay for each unit of gas and electricity, plus the daily standing charge, but not your total bill.
 The Full Rules and Regulation GuideConfused about who actually decides what you pay for gas and electricity, or why rules differ in Scotland and Wales?
 Ways to Pay an Energy SupplierHow you pay for gas and electricity changes what you are charged, and by how much.
 The Full Energy Bills and the Price Cap GuideWondering why your bill went up even when you used less power?