In this guide
- Price Cap Limits Prices
- Covered and Not Covered
- Unit Rates and Standing Charges
- Typical Bills Under the Cap
- Standing Charges Explained
- How the Cap Is Calculated
- Regional Variation
- Quarterly Review Cycle
- Why Your Bill Is Not Capped
- Fixed Tariffs Versus the Cap
- Northern Ireland Exception
- Government Policy and Bills
- Suppliers and Capped Tariffs
Energy Bills and the Price Cap: The Full UK Guide
A household energy bill in Great Britain is built from two prices. One is a unit rate for each kilowatt hour (kWh) of gas or electricity used. The other is a standing charge paid every day whether or not any energy is used. For households on a standard variable tariff, Ofgem's energy price cap sets the maximum a supplier can charge for both. It does not limit the total bill: Ofgem states that the more energy you use, the higher your bill will be1. The cap is revised each quarter. Separate caps are set for gas and for electricity, and a separate level is set for each of 14 regions2.
The headline figures are illustrations for a household with typical consumption. For 1 October to 31 December 2025, Ofgem put that figure at £1,755 a year by Direct Debit, £1,890 by standard credit and £1,707 on prepayment3. For 1 April to 30 June 2026 it was set at £1,6414. From 1 July 2026 it rose by 13%5, which added a reported average of £221 a year for standard variable customers6. A further rise of 4%, reported as £1,663 to £1,723 for an average household, takes effect on 1 October 20267.
The cap covers England, Scotland and Wales only. Northern Ireland has its own regulator and no Ofgem cap, and fixed tariffs anywhere in Great Britain sit outside it. The sections below explain what the cap limits, who is covered, how the numbers are built, and where the detailed pages in this lane take each subject further.
The price cap limits prices, not bills
The default tariff cap was introduced on 1 January 2019. Ofgem first set it every six months. In summer 2022 it moved to setting it every quarter, in response to high and volatile wholesale prices11. The cap applies to standard and default tariffs and is reviewed and updated every three months12.
Ofgem describes the cap as the maximum amount a supplier can charge for a unit of energy and the standing charge together. It exists to protect people on tariffs where the unit rate can go up or down with the energy market1. The House of Commons Library describes it the same way: maximum prices for a unit of energy and for daily standing charges, for customers in each energy supply region of Great Britain, with separate caps for gas and electricity2.
"It does not limit the cost of your total bill. The more energy you use, the higher your bill will be."
This is the point the annual headline figure most often hides. A figure such as £1,755 is what a household with typical consumption would pay at the capped rates over a year. It is not a ceiling on any individual bill. The page on what the typical household figure means covers this in detail.
For energy independence the consequence is simple. The cap regulates a price the household does not control, and the quantity used is the only part of the calculation in its hands. A home that uses fewer units from the grid, through efficiency or its own generation, pays for fewer capped units. It still pays every capped standing charge. That relationship is explored in energy bills and energy independence.
Covered and not covered: standard variable tariffs only
Ofgem's guidance names the protected group as people on standard variable tariffs. It lists what falls outside the cap1:
- fixed tariffs agreed with a supplier
- business energy contracts
- heat networks
- heating oil
The Welsh Government's guidance adds that the cap applies to default tariffs however the bill is paid, and does not apply to fixed, green or time of use tariffs13. Those products are compared with the cap on the page about tracker and time-of-use tariffs.
Payment method does not take a household out of the cap. The Energy Saving Trust states that it applies to anyone on a default energy tariff, regardless of how they pay or whether they have a prepayment meter, and that it applies only in England, Scotland and Wales14. There is currently one cap for credit customers and another for prepayment customers15. The pages on prepayment meters and price cap rates by payment method set out how the two differ.
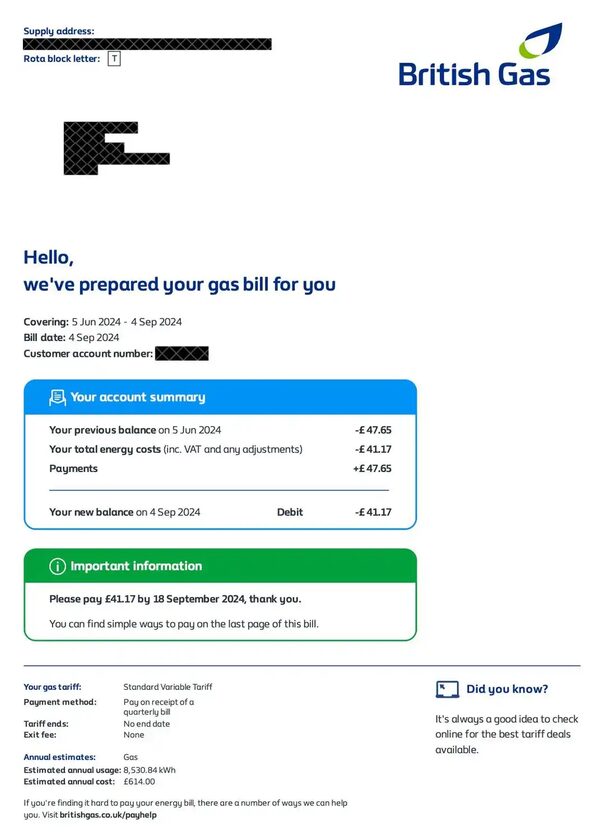
No application is needed. A household that has never chosen a fixed deal, or whose fixed deal has ended, is on the default tariff and is covered automatically. The page on whether you need to apply for the cap explains this. The tariff name is usually on the latest bill or statement, or in the supplier's app or online account16. How to read a gas and electricity bill shows where to look.
Ofgem's May 2025 decision document puts the number protected at 22 million default tariff and standard variable tariff customers10.
Unit rates and standing charges: the two numbers the cap sets
Every capped tariff has a unit rate in pence per kWh and a standing charge in pence per day, each for gas and for electricity. The published averages are for a Direct Debit customer across England, Scotland and Wales, and include VAT at 5%17. The table gathers the average rates given for recent cap periods5.
| Cap period | Electricity unit rate | Electricity standing charge | Gas unit rate | Gas standing charge |
|---|---|---|---|---|
| 1 October to 31 December 2025 | not given | not given | not given | 34.03p per day17 |
| 1 January to 31 March 2026 | 27.69p per kWh13 | 54.75p per day13 | not given | not given |
| 1 April to 30 June 2026 | 24.67p per kWh12 | 57.21p per day12 | 5.74p per kWh12 | 29.09p per day12 |
| 1 July to 30 September 2026 | 26.11p per kWh5 | 57.19p per day8 | not given | not given |
Two things stand out in that run. The electricity unit rate fell between the first and second quarters of 2026 and rose again in the third, following the quarterly reset. The electricity standing charge moved much less. It went up between January and April 2026 and was almost unchanged in July.
A gas unit costs far less than an electricity unit. In April to June 2026 the rates were 5.74p against 24.67p per kWh12. That gap shapes the running cost of every heating choice and is examined in is gas cheaper than electricity per kWh.
Ofgem lists what determines these rates18:
- VAT at 5%
- wholesale costs
- network costs
- operating, debt and industry costs
- supplier profit (EBIT)
- policy costs
- the type of energy used
- the type of meter installed
- how the bill is paid
What makes up a UK energy bill takes each in turn. Appliance running costs shows how a unit rate converts into the cost of using a particular device.
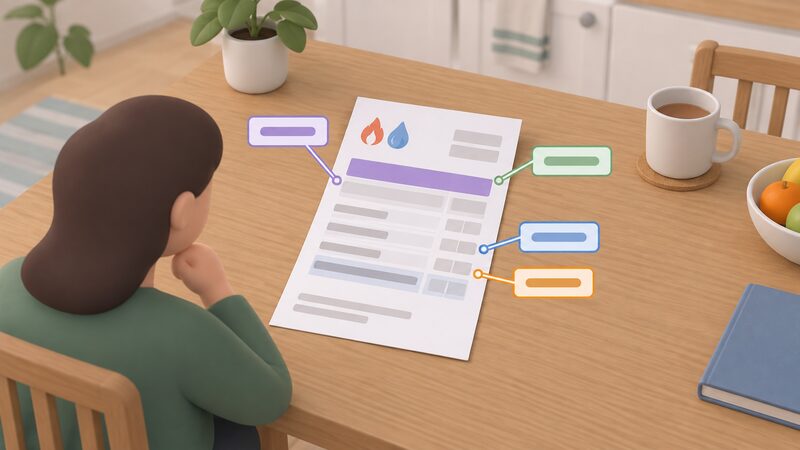
Typical bills under the cap: £1,755 by Direct Debit, £1,890 by standard credit, £1,707 on prepayment
For 1 October to 31 December 2025, Ofgem gave three typical annual totals by payment method3.
| Payment method | Previous level | October to December 2025 | Change |
|---|---|---|---|
| Direct Debit | £1,720 | £1,755 | £35 (2%) |
| Standard credit | £1,855 | £1,890 | £35 (2%) |
| Prepayment | £1,672 | £1,707 | £35 (2%) |
In that period standard credit was £135 a year above Direct Debit (£1,890 against £1,755). Prepayment was £48 below it (£1,707 against £1,755)3. In the April to June 2024 period the standard credit premium over Direct Debit was £10619. The reasons for the gap are covered in standard credit vs direct debit and prepayment vs direct debit.
The next table shows the recent run of Direct Debit levels3.
| Cap period | Typical dual fuel Direct Debit level |
|---|---|
| From 1 January 2024 | £1,92819 |
| 1 April to 30 June 2024 | £1,69019 |
| 1 January to 31 March 2025 | £1,73820 |
| 1 April to 30 June 2025 | £1,84920 |
| 1 July to 30 September 2025 | £1,72021 |
| 1 October to 31 December 2025 | £1,7553 |
| 1 January to 31 March 2026 | around £1,75813 |
| 1 April to 30 June 2026 | £1,6414 |
Before the energy crisis the equivalent figure was £1,13822. Wholesale prices rose rapidly from mid-2021 and led to a 54% increase in the cap in April 2022. The House of Commons Library gives the cap for October to December 2022 as £3,3719. In that period government support under the Energy Price Guarantee determined what households actually paid. Ofgem noted that the October to December 2025 level was £625 (26.3%) lower than at the start of 2023, when the crisis was at its peak17.
For July to September 2026 the published figures do not line up neatly. One comparison site's table shows an average usage household moving from £1,641 to £1,862, a rise of £221, on a usage basis of 11,500 kWh of gas and 2,700 kWh of electricity23. The same site's September 2026 release gives the level before 1 October as £1,663, rising 4% to £1,7237. One visible cause is that they do not all use the same consumption basis. The full series is on the price cap history page.
Standing charges: the daily fee you pay even when you use nothing
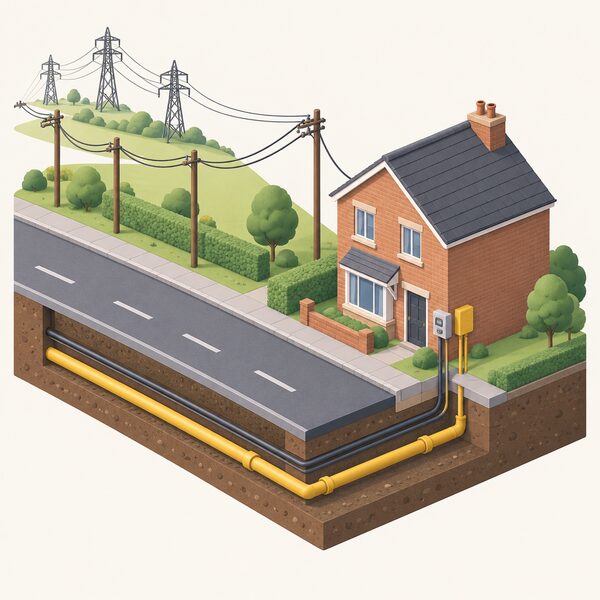
The House of Commons Library defines standing charges as a daily charge that energy customers have to pay even if they use no energy. It says they recover the cost of providing energy company services. That runs from providing and maintaining the wires, pipes and cables that deliver power to a customer's door through to the staff and buildings the business needs24.
The average electricity standing charge under the July to September 2026 cap was 57.19p per day8. Regional differences are wide. For the same period one comparison site reports 70.76p per day in North Wales and Mersey and 44.78p per day in London, which it identifies as the cheapest region25. Another gives London as 44.83p per day8. The two figures differ by a fraction of a penny.
Independent guidance says standing charges cover transport costs and administration charges, and also help pay for government environmental and social schemes26. The subject is taken further in standing charges: what they pay for and why is the standing charge so high.
Ofgem has considered moving costs out of the standing charge. Its December 2024 operating cost and debt allowances publication records a decision not to move a further £20 to £100 of costs from standing charges to unit rates27. The wider debate is on the standing charge reform page.
Zero standing charge tariffs
Independent guidance updated in August 2026 reports that zero standing charge tariffs currently exist only for prepayment customers, and that none of the big six suppliers offers one15. The guidance says these tariffs usually charge a higher cost per kWh. It describes them as best suited to households that use little gas or electricity and to properties left empty for long periods, such as holiday homes26. No standing charge tariffs vs standard tariffs compares the two structures.
How the cap is calculated: wholesale, network, policy and operating costs
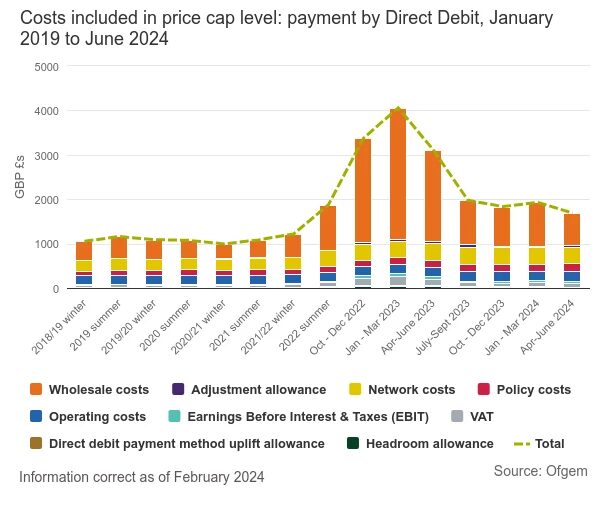
Ofgem builds each cap level from a list of allowed costs1:
- Wholesale costs: buying energy on the open market
- Network costs: the pipes and wires that carry energy
- Policy costs: government social and environmental schemes
- Operating costs: running a supply business, including billing and debt
- EBIT: an allowance for supplier profit
- Headroom: an allowance for uncertainty
- Levelisation allowance: making sure prepayment and Direct Debit customers pay the same standing charge
- VAT: charged at 5%
The wholesale element is an index based on a 12 month forward view of gas and electricity prices11. Quarterly movements are driven mainly by wholesale prices. Independent guidance attributes the 13% rise in July 2026 to high wholesale energy prices caused by the conflict in the Middle East28. Wholesale prices and energy bills explains how those prices reach a bill.
Network costs are the next most important component. They make up almost 30% of the total2. They can move the cap when wholesale prices are calm. Ofgem said the October to December 2025 rise came from increases to parts of the cost of transporting energy in Great Britain and from costs towards government schemes and essential support. For a typical household that rise was £2.93 a month, or £35.14 a year17. The levies themselves are covered in policy costs and levies on energy bills. The tax element is in how much VAT is charged on energy bills.
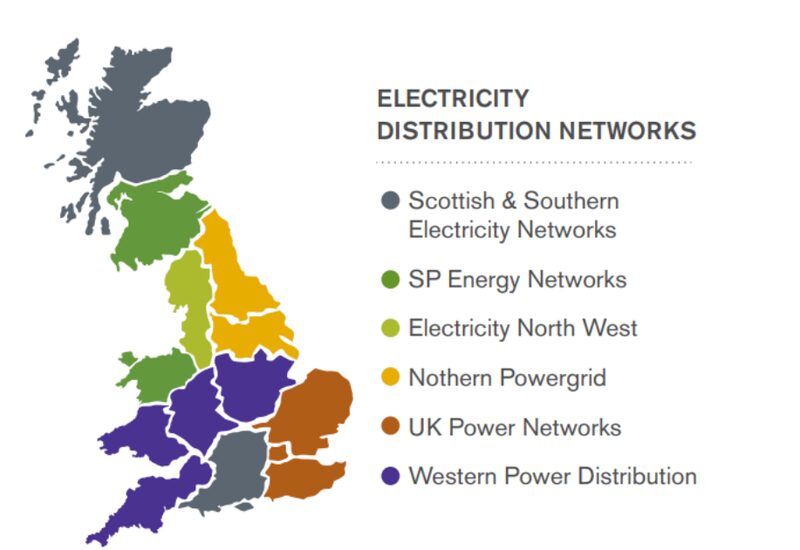
Regional variation: 14 separate caps across Great Britain
A separate price cap is set for each of the 14 regions. It applies throughout the region, with no breakdown below regional level2. Ofgem says the level a household faces varies with four things1:
- where the household lives
- the payment method (Direct Debit, standard credit or prepayment meter)
- the fuel (gas or electricity)
- the meter type
Ofgem publishes the electricity cap for each region in two forms: as an annual amount at nil consumption, which is in effect the standing charge, and as an annual amount at a benchmark consumption. The table gives entries from the first electricity table of the 1 July to 30 September 2026 publication, for single-rate and multi-register meters29.
| Region | Single-rate: annual standing charge | Single-rate: annual bill at 2,500 kWh | Multi-register: annual standing charge | Multi-register: annual bill at 3,400 kWh |
|---|---|---|---|---|
| Northern | £223.48 | £824.03 | £220.70 | £986.44 |
| Yorkshire | £223.79 | £826.29 | £221.43 | £992.07 |
| Midlands | £207.57 | £810.72 | £206.15 | £977.09 |
| East Midlands | £186.33 | £783.86 | £184.40 | £947.09 |
| South East | £189.27 | £824.22 | £190.23 | £996.63 |
| North West | £165.50 | £787.60 | £163.01 | £952.88 |
A low standing charge does not guarantee a low bill. The South East has a lower annual standing charge than the Midlands (£189.27 against £207.57). Its bill at 2,500 kWh is higher (£824.22 against £810.72), because its unit rate is higher29.
Ofgem's tables for 1 October to 31 December 2025 state that all values are exclusive of VAT, which suppliers then add. Under the prepayment cap in that period, the single-rate nil consumption figure was £243.15 in North Wales and Mersey and £208.10 in the Northern region30. In September 2026 the capped single rate in the South Wales region was given as 26.33p per kWh with a standing charge of 57.84p per day31. Households on multi-register meters are covered in Economy 7, Economy 10 and restricted meter billing. Every region's rates are listed in electricity and gas unit rates by region.
The quarterly review cycle and how to track the next change
Ofgem sets the cap level every three months1. New periods start on 1 January, 1 April, 1 July and 1 October. Ofgem announces each new level about six weeks before it comes into effect32. In practice the July level becomes known towards the end of May and the January level in late November.
Ofgem's scheduled reviews for 2027 are due on these dates14:
- 23 February 2027, for the April to June 2027 cap.
- 26 May 2027, for the July to September 2027 cap.
Between announcements, analysts and suppliers publish forecasts. One guide, averaging predictions from British Gas, EDF and E.ON Next, gives £1,970 a year for 1 January to 31 March 2027, for an average usage household paying by Direct Debit31. That is a prediction, not an Ofgem figure. The confirmed level at each step, with its announcement date, is recorded in price cap history and announcement dates.
Because the rate changes on a fixed date, a meter reading taken close to that date separates units used at the old rate from units used at the new one. Meter readings and estimated bills explains how suppliers apportion usage when no reading is given.
Why the cap does not limit your total bill

Three things push a real bill away from the headline figure. All three are consistent with the cap working as designed.
- Consumption. The cap figures assume 2,500 kWh of electricity and 9,500 kWh of gas a year9. A larger or less efficient home, or one heated by electricity, uses more units and pays more. Ofgem's tables use a higher benchmark of 3,400 kWh for multi-register electricity meters29.
- Payment method. The typical standard credit figure for October to December 2025 was £1,890, against £1,755 by Direct Debit3.
- Region. The cap's averages are taken across Great Britain, while each of the 14 regions has its own rates2.
Monthly Direct Debit amounts add a further layer. They are a supplier's estimate of annual cost spread across the year, so a payment can rise or fall independently of the cap. That is covered in Direct Debit payments and credit balances and why is my energy direct debit so high. Where a bill exceeds the headline and the cause is unclear, why is my bill higher than the price cap figure works through the possibilities. Reducing an energy bill shows where the money goes.
When a bill cannot be paid, the routes are set out in energy debt and repayment plans, repaying energy debt through a prepayment meter and disconnection, warrants and forced prepayment installation. There are nation-specific help pages for England, Scotland, Wales and Northern Ireland.
Fixed tariffs versus the cap: which households are on each
A fixed tariff holds its unit rate and standing charge for the length of the contract. It sits outside the cap1. Its price can be above or below the capped level on the day it is agreed and on any day after that.
The published counts of who is on which tariff do not match. They use different units, and one dates from 2024.
| Measure | Figure |
|---|---|
| Customers protected by the cap | 22 million default and standard variable tariff customers (Ofgem, May 2025)10 |
| Household accounts on fixed tariffs | about 40% of accounts, counting gas and electricity separately (attributed to Ofgem, June 2026)33 |
| Households on fixed tariffs | around 11 million, unaffected by cap changes (August 2026)34 |
A dual fuel household holds two accounts, so account percentages and household counts are not directly comparable.
A fixed tariff protects against cap rises. It also locks the household out of cap falls, and a fixed deal may carry an exit fee. The trade-off is set out, without a verdict, in fixed tariff vs staying on the price cap and fixed and standard variable tariffs explained. What follows the end of a contract is in what happens when my fixed energy deal ends. The mechanics of moving are in switching energy supplier.
Northern Ireland: why the cap does not apply
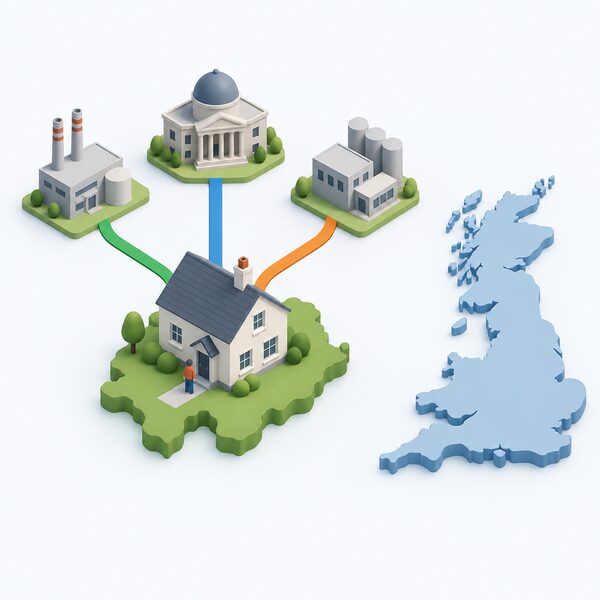
Ofgem regulates the energy market in Great Britain, and its cap applies only in England, Scotland and Wales14. Northern Ireland is a separate market.
"There is a different regulator, the Utility Regulator for Northern Ireland, no price cap and an entirely different set of suppliers from Great Britain."
Three consequences follow for a Northern Ireland household. The quarterly Ofgem announcements and the headline typical bill do not describe its prices. The regional tables above do not include it. And support schemes designed around Great Britain suppliers have had to be delivered separately, as happened with the crisis-era schemes described in closed energy bill support payments.
Prices, regulation and the supplier landscape are covered in energy bills in Northern Ireland. The main electricity supplier's tariffs are covered in Power NI tariffs. The complaints route is in who deals with energy complaints in Northern Ireland.
What government policy changes mean for future bills
Policy costs are the component of the cap that ministers can change directly. In April 2026 the government cut them by ending a levy-funded energy efficiency scheme and shifting funding for the largest renewable generation support scheme to general taxation2. The Department for Energy Security and Net Zero's annual report describes measures to reduce energy bills by an average of £150 from April 202636. The cap fell by 7% for April to June 202613. It then rose by 13% in July as wholesale prices climbed5. The sequence shows that a policy cut lowers one layer of the bill and leaves the wholesale layer exposed.
Looking further ahead, the Climate Change Committee estimated in 2017 that the gradual shift towards low-carbon electricity could add a further £85 to £120 a year to a typical bill by 2030 if further policies were put in place37. In its May 2025 advice on Scotland's carbon budgets, the same body called for electricity to be made cheaper by rebalancing prices to remove policy levies from electricity bills. It described this as a key recommendation to the UK Government38.
On security, the Committee's assessment of the Heat and Buildings Strategy states that delivering its goals would help protect UK consumers from future price spikes. It says the same goals would increase energy security by reducing energy needs and shifting demand from gas to electricity, which it expects to come predominantly from UK-based renewable generation39. For a household, that is the long-term case for lower dependence on imported gas. In the near term, the capped price of electricity and gas still follows international wholesale markets. Proposals for targeted price protection are tracked in a social tariff for energy and the Energy Debt Relief Scheme.
Suppliers and their capped tariffs
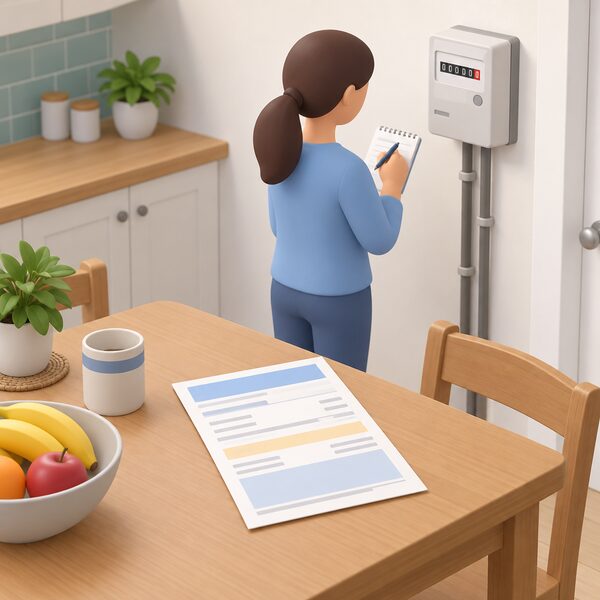
Every licensed domestic supplier in Great Britain has a standard variable tariff that must sit at or below the cap for its region and payment method. Ofgem states that it monitors supplier compliance closely and will continue to take firm action against suppliers who fall short3. Because of this, standard variable prices differ little between suppliers. Most of the variation is in their fixed, tracker and time-of-use products, which are outside the cap.
Supplier pages in this lane describe tariffs and billing for EDF, Octopus Energy and OVO Energy, without ranking them.
Supplier finances matter to customers. In May 2022 ScottishPower said its retail business was losing money during the cost of living crisis40. The page on Bulb Energy records what happened to customers when a large supplier failed. Whichever supplier is involved, a household on a capped tariff still depends on the grid for delivery, on a licensed supplier for billing, and on wholesale markets for the price of each unit.
Sources40 cited
- Energy price cap explained, Ofgem, 2026-09-17
- Research briefing on the energy price cap, House of Commons Library, 2026-09-20
- Summary of changes to the energy price cap, 1 October to 31 December 2025, Ofgem, 2025-08-27
- Written statement: fuel poverty, Welsh Government, 2026-02-26
- Current gas and electricity prices, Centre for Sustainable Energy, 2026-08-27
- Energy bills rise today, Uswitch, 2026-07-01
- October price cap rise press release, Uswitch, 2026-09-16
- Energy standing charges guide, Uswitch, 2026-08-26
- Research briefing CBP-9714, House of Commons Library, 2026-08-28
- Operating cost and debt allowances decision overview, Ofgem, 2025-05-23
- Price cap methodology: backwardation deadband decision, Ofgem, 2025-11-21
- Grants and schemes for those worried about energy bills, Smart Energy GB, 2026-05-28
- Energy price cap explained, Welsh Government Climate Action Wales, 2026-03-04
- What is the energy price cap, Energy Saving Trust, 2026-09-07
- Should I get a no standing charge tariff, Uswitch, 2026-08-26
- How to check your energy tariff and switch, British Gas Energy Trust, 2026-07-30
- Changes to the energy price cap between 1 October and 31 December 2025, Ofgem, 2025
- How your electricity or gas bill is calculated, Ofgem, 2026
- Default tariff cap letter, 1 April 2024, Ofgem, 2024-02-23
- Summary of changes to the energy price cap, 1 April to 30 June 2025, Ofgem, 2025-02-25
- Summary of changes to the energy price cap, 1 July to 30 September 2025, Ofgem, 2025
- Response to Ofgem debt and affordability call for input, National Energy Action, 2024-03-28
- Checklist ahead of 1 July price rises, Uswitch, 2026-06-15
- Research briefing on standing charges, House of Commons Library, 2026-09-17
- Regional UK energy prices, Confused.com, 2026-07-01
- Gas and electricity standing charges, Confused.com, 2026-07-06
- Operating cost and debt allowances consultation, Ofgem, 2024-12-12
- When is the best time to switch my energy deal, Uswitch, 2026-08-26
- Energy price cap levels, 1 July to 30 September 2026, Ofgem, 2026
- Energy price cap levels, 1 October to 31 December 2025, Ofgem, 2025-08
- Economy 7 guide, Uswitch, 2026-09-08
- February 2026 price cap announcement: what to expect, Uswitch, 2026-02-23
- Comment on the July price cap, Energy and Climate Intelligence Unit, 2026-06-30
- Ofgem confirms gas prices will hit bills in winter 2026, End Fuel Poverty Coalition, 2026-08-26
- Energy Prices (Domestic Supply) (Northern Ireland) Regulations 2022 debate(NorthernIreland)Regulations2022), UK Parliament Hansard, 2022-11-16
- DESNZ annual report and accounts 2025 to 2026: performance report, Department for Energy Security and Net Zero, 2026-04
- Analysis of policy costs on household energy bills, Climate Change Committee, 2017-08-03
- Scotland's carbon budgets, Climate Change Committee, 2025-05-21
- Independent assessment of the UK's Heat and Buildings Strategy, Climate Change Committee, 2022-03-16
- Cost of living update, May 2022, ScottishPower, 2022-05-05