

In this guide
The default tariff cap, usually called the energy price cap, was introduced on 1 January 2019 and applies across Great Britain to households on standard variable and other default tariffs1. It limits the unit rate a supplier may charge for each kWh of gas and electricity and the daily standing charge, with separate caps for gas and for electricity. It does not limit the annual bill, which depends on how much energy a household actually uses2. Around 20 million households in Great Britain are on variable tariffs and covered by it, including 5 million prepayment meter customers and 3 million standard credit customers, while roughly 11 million households have fixed their rates and sit outside it3.
The cap has moved from an initial level of £1,254 a year for a medium-usage household in April 2019 to a peak of £4,059 for January to March 2023, and back down again4. It was reviewed twice a year until summer 2022, when Ofgem moved to quarterly setting in response to high and volatile wholesale prices6. Levels now change on 1 January, 1 April, 1 July and 1 October, and each new level is published around three months before it takes effect: the January to March 2026 level was published by 25 November 2025, and the April to June 2026 level by 25 February 20267.
The most recent movements are upward. The cap rose 13% from 1 July 2026, driven by wholesale prices, and a further 4% from 1 October 20263. Cornwall Insight predicts a further rise of 8.6% for January 2027, taking the average annual bill to £1,872, which would be a 12.6% rise over six months9. Forecasts for that period differ between analysts and none is a decision: the Ofgem level for 1 January 2027 is not set until late November 2026.
What the cap limits, and what it leaves uncapped
The cap sets maximum prices for a unit of energy and for daily standing charges, with separate caps for gas and electricity. It does not limit annual bills2. Ofgem states the point plainly:
"It does not limit the cost of your total bill. The more energy you use, the higher your bill will be."
That distinction matters because the headline figure quoted in news coverage is a modelled annual cost for an assumed level of consumption. A household using more than the benchmark pays more than the headline; a household using less pays less. The typical household bill figure is an illustration, not an entitlement.
Several forms of household energy are outside the cap altogether. Fixed-term tariffs, where the unit price and end date are agreed, are not capped1. Business energy contracts are not protected10. Heat networks were not covered by the existing price cap11. Heating oil prices are not regulated by Ofgem and are not covered by the cap12, which leaves off-grid households exposed to a market with no equivalent ceiling. From the start, the default tariffs of a small number of suppliers were excluded: Ofgem exempted Good Energy, Ecotricity and the supplier now trading as 100Green13.
Households moved onto a deemed contract, for example after a supplier failure or on moving into a property, remain covered by the cap15.
Legal basis: the Domestic Gas and Electricity (Tariff Cap) Act 2018

The cap is statutory, not a voluntary arrangement. The Domestic Gas and Electricity (Tariff Cap) Act 2018 is described in its own words as an Act "to make provision for the imposition of a cap on rates charged to domestic customers for the supply of gas and electricity; and for connected purposes"16. It came into force on 19 July 201817, and the cap itself came into force at the beginning of 20192.
The Act requires Ofgem to put in place and maintain the licence conditions that give effect to the cap18. Changes to the way the cap works, such as the 2025 revision of benchmark consumption, are made through a modification under section 1(2) of the Act6. Section 1(6) sets out five matters Ofgem must have regard to when setting the cap19, which is why decisions on allowances for wholesale costs, debt and supplier earnings are published as formal consultations and decisions rather than as simple announcements.
A separate legal instrument governed the crisis period. The Energy Price Guarantee, laid under the Energy Prices Act, capped domestic electricity and gas prices over 1 October 2022 to 31 March 2024 and sat on top of the default tariff cap rather than replacing it20. That scheme is closed; the Energy Price Guarantee page covers how it worked.
Ofgem continues to reopen parts of the methodology. A review of historical debt-related costs published on 25 March 2026, with a response deadline of 16 June 2026, proposed to include costs and revenues across all tariff types rather than only customers on variable tariffs21.
Every cap level since the cap began
The figures below are the levels and changes recorded for each period. They are not all on the same basis: cap figures published before October 2023 assumed 2,900 kWh of electricity and 12,000 kWh of gas a year, while current figures assume 2,500 kWh and 9,500 kWh5. Comparing a 2022 headline with a 2026 headline therefore compares two different baskets as well as two different price levels.
| Period or date | Level or change | Source type |
|---|---|---|
| January 2019 | Cap introduced across all payment types5 | Official |
| 1 April 2019 | £1,254 a year, medium usage4 | Independent |
| From 1 April 2021 | Prepayment cap up £87 to £1,156 for 4 million customers23 | Official |
| Before April 2022 | £1,277 a year equivalent24 | Official |
| April 2022 | £1,971, a 54% increase24 | Official |
| October 2022 | £3,549 average costs after a further 80% rise25 | Independent |
| January to March 2023 | £4,0595 | Official |
| January to March 2024 | 5% higher than the previous cap24 | Official |
| April 2024 | 12% fall24 | Official |
| 1 July to 30 September 2024 | £1,56826 | Independent |
| 1 October to 31 December 2024 | £1,7177 | Official |
| 1 April 2025 | £1,738 to £1,849, a 6.4% increase27 | Official and independent |
| 1 October to 31 December 2025 | 2% rise; 2.2% higher than the same period in 202429 | Official |
| 1 July 2026 | 13% increase, bills up around 13.5%3 | Independent |
| 1 October 2026 | 4% increase9 | Independent |
Published cap values are exclusive of VAT, which suppliers then apply to bills30.
Two figures in the record are disputed between documents. The October 2022 default tariff cap is given as £3,549 a year in one official statement and £3,608 in another, and that conflict has not been resolved; both were superseded in practice by the Energy Price Guarantee. Regional detail for North West nil-consumption and annual gas levels in 2024 also differs between official tables.
The crisis peak: £4,059 and the 54% jump
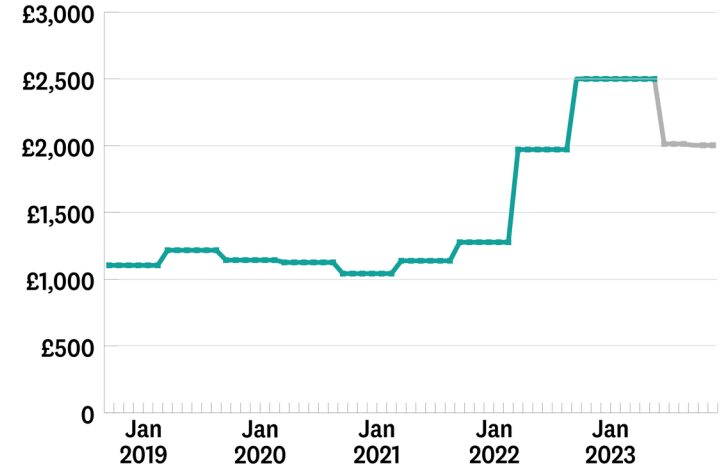
Rapid increases in wholesale energy prices from mid-2021 onwards led to a 54% increase in the cap in April 20225. That took the annual equivalent from £1,277 to £1,97124 and was, at the time, the highest the gas and electricity price cap had ever been. A further rise of 80% was planned for the fourth quarter of 20222, taking average costs to £3,549 on the figures quoted at the time25. The January to March 2023 cap then reached £4,0595. At the peak of the crisis in January 2023, UK consumers under the cap were paying four times more for their electricity than two years earlier31.
The mechanism did not cause the rise; it transmitted it. The cap's wholesale element was designed to calculate a wholesale index on a 12 month forward view of gas and electricity prices6, so sustained increases in forward gas prices feed through to capped rates with a lag rather than being absorbed. Ofgem's own review of wholesale costs in cap periods 7 (October 2021 to March 2022) and 8 (April to September 2022) drew on data from 11 suppliers representing 96% of the retail market28.
Recovery has been partial and slow. The April to June 2025 cap, announced in February 2025 as a 6.4% increase, was still £531 (22%) lower than at the height of the energy crisis at the start of 2023 when the Energy Price Guarantee was in place27, which is another way of saying capped bills have settled well above pre-crisis levels rather than returning to them. For a household, the practical lesson of 2022 is that exposure to internationally traded gas is not removed by regulation: the cap changed the shape of the increase, not its existence. That is the argument set out on energy bills and energy independence.
Quarterly resets on 1 January, 1 April, 1 July and 1 October
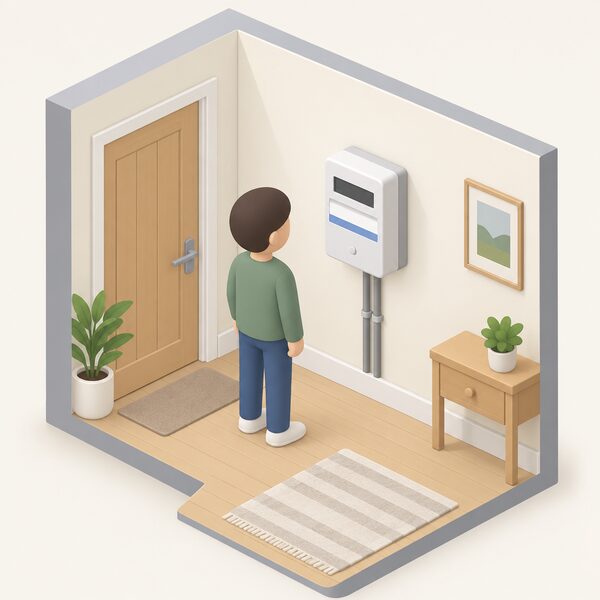
The cap has been set every quarter since summer 2022, when Ofgem moved from six-monthly to quarterly setting in response to high and volatile wholesale conditions6. Levels change on 1 January, 1 April, 1 July and 1 October each year32, and the calculation is redone every three months8.
Quarterly setting cuts both ways. It means a fall in wholesale prices reaches households within months rather than up to half a year, as with the roughly 12% fall in April 202424 and the reduction that took effect on 1 April 2026. It equally means an increase arrives faster: the 13% rise on 1 July 2026 reflected wholesale prices described as high because of conflict in the Middle East33. Shorter periods also make budgeting harder, because a household on a variable tariff faces four possible price changes a year rather than two.
The 1 October 2026 change illustrates how different the two fuels can move within one reset. Gas unit rates rose from 6.29p per kWh the previous winter to 8p from 1 October, up around 27% year on year, while electricity unit rates were held roughly stable at 26.32p per kWh, helped by the Government cutting VAT on electricity3. Standing charges moved in opposite directions over the same step: gas up 2.2% to 29.68p a day, electricity down 4.1% to 54.83p a day3. A household heating with gas therefore felt that reset far more sharply than an all-electric one. Wholesale prices and energy bills sets out how those input costs are formed.
Fourteen regional caps, not one national figure
There is no single national cap. A separate price cap is set for each of the 14 regions and applies throughout the region, with no breakdown below regional level2, the regions being the electricity distribution areas of Great Britain34. Some regions, such as Merseyside and North Wales, pay substantially more than others, such as London3.
Regional divergence shows in the published tables. For 1 October to 31 December 2025, the gas cap for a standard credit customer in the Eastern region was £145.17 at nil consumption and £893.82 at 12,000 kWh, while the Northern region on another payment method was £118.70 and £837.3330. For electricity in the Northern region for 1 July to 30 September 2026, the benchmark maximum was a £223.48 standing charge and £824.03 at 2,500 kWh on a single rate, with £220.70 and £986.44 on the multi-rate benchmark35. In Scotland for January to March 2026, direct debit electricity rates under the cap were 27.83p per kWh in southern Scotland and 28.36p in northern Scotland, with gas at 5.89p per kWh across the whole country36.
Ofgem lists the factors that change the level for any given household: where you live, payment method, fuel type and meter type1. That is why two neighbouring properties can face different capped standing charges, and why comparing a bill against a national headline figure usually fails. The detail sits on electricity and gas unit rates by region and standing charges.
Who the cap covers, and who it leaves out
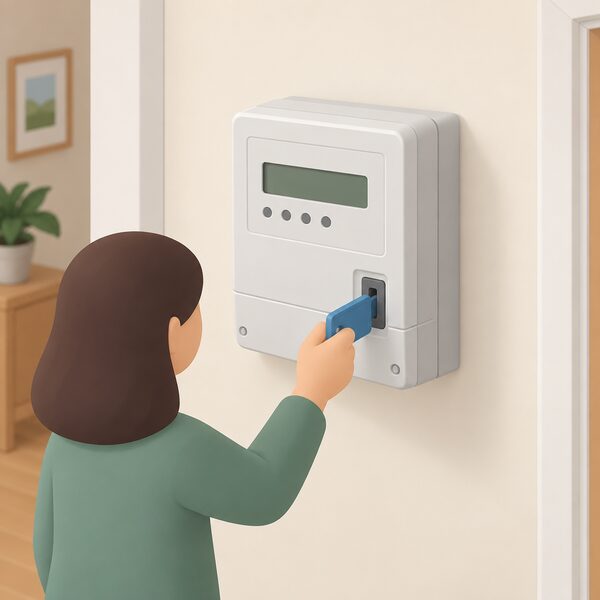
The cap applies where a customer has not signed up for a fixed-term contract with their supplier2, and it applies regardless of how the bill is paid37. Around 20 million households in Great Britain are on variable tariffs and so covered, including 5 million on prepayment and 3 million on standard credit, while around 11 million have fixed3. When the cap began in 2019 it affected around 11 million customers on standard and default tariffs14.
Payment method changes the level rather than the coverage. For 1 July to 30 September 2025, standard credit customers paying by cash or cheque faced an additional £136 a year compared with direct debit, and an additional £82 on Economy 7 electricity38. For the April 2024 period the standard credit premium was £106, with £67 extra on Economy 739. The separate cost premium for prepayment relative to direct debit was removed through the cap3. Full detail is on price cap rates by payment method.
Groups outside the protection:
- Households on fixed-term tariffs for the length of the term1
- Business energy customers10
- Heat network customers, who were not covered by the existing cap11
- Households heating with oil or LPG, which Ofgem does not regulate12
- Northern Ireland, which has no Ofgem cap at all
Fixed tariffs sit outside the cap in both directions
A fixed-term tariff has a fixed end date and an agreed per unit price, and the cap does not apply to it [7 refs below]. The price holds for the full duration of the tariff regardless of changes in the wholesale cost of electricity or in the cap during that period. That protects a household from increases and equally denies it any reduction when the cap falls. When the term ends, a household rolls onto the supplier's standard variable rate, which is determined by the cap and changes every three months. The comparison is set out on fixed and standard variable tariffs and fixed tariff vs price cap.
The next cap: forecast to rise to around £1,872
For 1 January 2027, Cornwall Insight predicts an 8.6% rise taking the average annual bill to £1,872, which would represent a 12.6% increase over six months9. Separate modelling assumes gas rising a further 12% from 1 January 2027, though the price monitoring window for that period had only recently opened when the forecast was made3. Forecasts from different analysts for the same period do not agree, and none of them binds Ofgem.
Earlier quarters show how far a forecast can sit from the outcome. Bills were forecast to rise by £209 to £1,850 from July 2026 in one estimate and by £202 in another [17 and related]; the eventual change was a 13% increase33. During 2022, forecasts for the October cap ranged from around £3,580 to figures quoted as an £800 increase, against an actual crisis peak of £4,059 the following quarter5.
When the next level is announced

Ofgem announces a new cap level every three months, about three months before it takes effect32. The published pattern has been consistent:
| Cap period | Published by |
|---|---|
| 1 January to 31 March 2026 | 25 November 20257 |
| 1 April to 30 June 2026 | 25 February 2026 [1 of Ofgem news] |
| 1 October to 31 December 2026 | 26 August 2026 [35 news] |
| 1 April to 30 June 2027 | review due 23 February 2027 |
| 1 July to 30 September 2027 | review due 26 May 2027 |
The level for 1 January 2027 is due to be announced in late November 2026, following the same pattern as the 25 November 2025 announcement for the equivalent period a year earlier8. Announcement dates matter to households weighing a fixed deal, because the published level for the coming quarter is known several weeks before it applies. Ofgem has also signalled continuing work on energy pricing rules through its programme for 2026 and 2027.
Beyond the cap: VAT and levies on the bill
The published cap values are exclusive of VAT, which suppliers apply to bills30. VAT of 5% applies on gas from 1 October 2026 to 31 March 20271. Electricity unit rates in the October 2026 cap were held roughly stable, helped by the Government cutting VAT on electricity3, so part of what a household sees on the bill is tax policy rather than the cap.
The cap also carries network and policy costs inside the allowed unit rate and standing charge rather than showing them separately to the customer. Reviews of individual allowances, such as the 2026 consultation on historical debt-related costs, change the level without changing the headline structure21. A household reading its own bill against the cap will find the two do not reconcile line by line; what makes up an energy bill and policy costs and levies set out the components.
What the cap does, and does not do, for independence
The cap constrains the price of each unit bought from a supplier. It does nothing about the quantity bought, and it is explicit that the total bill is not limited1. A household remains dependent on the grid, on a licensed supplier, on internationally traded gas and on a regulator's quarterly judgement about allowed costs. The 54% rise of April 2022 and the £4,059 peak of early 2023 happened with the cap fully in force5.
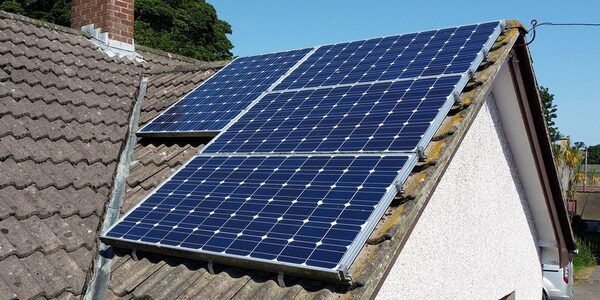
Where a household cuts consumption, insulates, or generates and stores its own electricity, it reduces the number of capped units it must buy, and that reduction is not reversed by the next quarterly reset. Where it cannot, the cap sets the ceiling price but the exposure remains, and for off-grid heating oil users there is no ceiling at all12. Options for reducing the volume are covered on reducing an energy bill, and the wider picture on energy bills and the price cap.
Sources39 cited
- Energy price cap, Ofgem, 2026-09-17
- Domestic energy prices briefing, House of Commons Library, 2026-09-20
- Ofgem price cap analysis, End Fuel Poverty Coalition, 2026-08-26
- Energy prices briefing, House of Commons Library, 2019
- Domestic energy price rises since 2021, House of Commons Library, 2026-08-28
- Energy price cap methodology: backwardation deadband decision, Ofgem, 2025-11-21
- Changes to the energy price cap, 1 October to 31 December 2025, Ofgem, 2025-08-27
- Changes to the energy price cap, 1 January to 31 March 2026, Ofgem, 2025-11-21
- Winter countdown: four weeks to escape rising energy bills, Uswitch, 2026-09-09
- Alternative homes energy guidance, Ofgem, 2026
- Heat networks briefing, House of Commons Library, 2026-02-26
- Domestic energy prices and off-grid fuels, House of Commons Library, 2026-09-20
- Green electricity tariffs, Centre for Sustainable Energy, 2026-07
- Energy customers could face bigger bills than before the price cap, Which?, 2019-02-07
- What happens if your energy supplier goes out of business, Ofgem, 2026
- Domestic Gas and Electricity (Tariff Cap) Act 2018, legislation.gov.uk, 2018-07-19
- Additional debt-related costs allowance consultation, Ofgem, 2023-10-12
- Energy price cap wholesale adjustment decision, Ofgem, 2024-02-23
- Decision on amending the EBIT allowance methodology, Ofgem, 2023-08-25
- Energy Price Guarantee up until 30 June 2023, GOV.UK, 2026-09-17
- Energy price cap: review of historical debt-related costs, Ofgem, 2026-03-25
- Our data and savings figures, Energy Saving Trust, 2026-09-01
- Energy price cap increase in April, Ofgem, 2021-04-01
- Energy price cap will rise 6.4% in April, Ofgem, 2025-02-25
- Fuel poverty campaign, CIPHE, 2022
- Cheap and simple changes to help cancel out price cap hike, Which?, 2024-07-01
- April 2025 energy price cap increase in effect, Uswitch, 2025-04-01
- Energy price cap wholesale costs review, Ofgem, 2023-12-15
- Energy price cap will rise 2% in October, Ofgem, 2025-08-27
- Energy price cap levels, 1 October to 31 December 2025, Ofgem, 2025-08
- Cutting the bills: UK clean power, Ember, 2023
- Energy price cap levels, 1 July to 30 September 2026, Ofgem, 2026-05
- When is the best time to switch my energy deal, Uswitch, 2026-08-26
- Average gas and electricity bill, The Energy Shop, 2026
- Energy price cap October 2026: what we know so far, Uswitch, 2026-08-20
- Balancing investment in clean heat and energy efficiency in Scottish housing retrofit, ClimateXChange, 2026
- Energy price cap explained, Welsh Government, 2026-03-04
- Summary of changes to the energy price cap, 1 July to 30 September 2025, Ofgem, 2025
- Default tariff cap letter, 1 April 2024, Ofgem, 2024-02-23
 Energy Price CapThe price cap sets the most you pay for each unit of gas and electricity, plus the daily standing charge, but not your total bill.
 The Full Energy Bills and the Price Cap GuideWondering why your bill went up even when you used less power?
 Domestic Energy Prices Over TimeTracks the published domestic gas and electricity unit rates, standing charges and cap levels over time, from the £1,277 cap of early 2022 through the crisis peak to the 2026 quarters.
 Typical Household FigureThe energy price cap limits unit rates and daily standing charges, not the total bill.
 Wholesale Prices and BillsGas prices around the world keep changing, so why do your bills move so slowly, and why does gas still set what you pay for electricity?
 Switching and Supplier MarketWhat is the Ofgem price cap and does it limit what you actually pay?