

In this guide
The Ofgem price cap is revised each quarter, and it protects around 28 million customers in Great Britain on default tariffs1. It is not a cap on a household's total bill. It sets maximum unit rates and standing charges, so a home that uses more pays more, and the benchmark annual figures Ofgem publishes for set consumption levels are illustrations rather than limits.
The cap has moved a long way since it was first introduced in January 2019. It peaked at £3,116 for April to June 2023, and by February 2025 the average dual fuel Direct Debit household was £531, or 22%, lower than at the height of the energy crisis at the start of 2023, when the Energy Price Guarantee was in place1. Ofgem announced a 2% rise for October to December 20253.
Switching behaviour sits alongside all of this. Ofgem's own research found that whether a household has switched supplier or tariff explains 5% of the explained variance in its demographic and energy characteristics model, and 0.6% of total variance, which is a modest share for a decision that determines what a household actually pays4.
What the price cap covers, and what it does not cap
The cap is a statutory instrument of a particular kind. Ofgem sets it with reference to the Domestic Gas and Electricity (Tariff Cap) Act 2018, which requires licence conditions giving effect to the cap8. It was designed as a temporary measure while Ofgem and the government introduced other reforms such as faster switching and smart meters9. Its purpose, in the government's own words, is that "the energy price cap protects consumers from the rapid changes observed in the wholesale energy market in the short term"10.
What it does not do is fix a bill. It caps the standing charge and the unit rate a supplier can charge on a default tariff, so consumption still drives the total. The cap tracks the costs underneath it rather than setting a price independently, which is why it can rise when wholesale prices are calm.
Coverage has boundaries that matter to particular households. A household placed on a deemed contract, for instance after a supplier fails, is still covered by the energy price cap11. Heat networks are not: they are classed as commercial supplies and are not covered by the Ofgem energy price cap or by the UK Government's Energy Price Guarantee12. The cap applies in Great Britain, so Northern Ireland households sit outside it.
The cap in numbers: unit rates, standing charges and typical bills
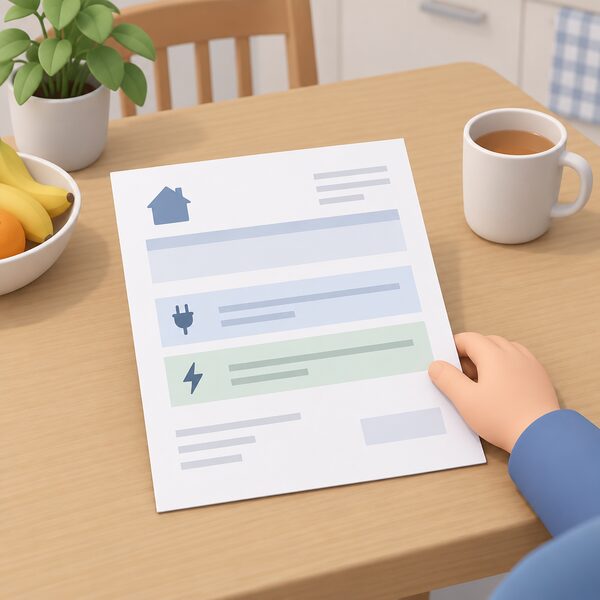
Ofgem publishes cap levels by region and by payment method, and the tables are the most direct way to see what a default tariff can cost. For 1 July to 30 September 2026, the electricity benchmark maximum charges show how much the standing charge and the annual illustration vary between regions at identical consumption.
| Region | Standing charge | Annual bill at 2,500 kWh (single-rate) | Annual bill at 3,400 kWh (multi-rate) |
|---|---|---|---|
| Northern | £223.48 | £824.03 | £986.44 |
| Midlands | £207.57 | £810.72 | £977.09 |
| South East | £189.27 | £824.22 | £996.63 |
| South Wales | £201.07 | £828.06 | £996.34 |
| Yorkshire | £223.79 | £826.29 | £992.07 |
| Southern | £172.77 | £801.74 | £973.28 |
Source: Ofgem cap levels, 1 July to 30 September 20262.
The pattern is worth reading carefully. Yorkshire and Northern carry the highest standing charges in that table, at £223.79 and £223.48, while Southern carries the lowest at £172.77, a difference of roughly £51 a year before a single unit of electricity is used. The annual bill illustrations at 2,500 kWh are much closer together, because the unit rate component partly offsets the standing charge. A household that uses very little electricity feels the standing charge most; a household that uses a great deal feels the unit rate most.
For the preceding period, 1 October to 31 December 2025, the average electricity standing charge on a standard variable tariff paid by Direct Debit across England, Scotland and Wales was 53.68 pence per day, including VAT5. Ofgem also added around £1.23 a month to the average household bill to cover electricity balancing costs3.
How the cap has moved: from crisis peak to today's level
The trajectory since 2019 has been unusually volatile, and the sequence matters more than any single figure. The cap was kept at the level set in October 2021 over the winter of 2021 to 202213. From January 2023 the price cap fell from £2,500, under the Government's Energy Price Guarantee14. It then fell to £3,116 in April to June 20231, and there were falls of 12% in April 20241.
By February 2025, Ofgem described the level as £531, or 22%, lower than at the height of the energy crisis at the start of 2023, when the Energy Price Guarantee was in place, for an average dual fuel Direct Debit household14. From 1 April, Britain's standing charges were to reduce for most households, though some regional variation remained14. Ofgem then announced a 2% rise for the period covering October to December 20253, which independent statistics describe as a 2.03% increase from the previous quarter6.
The reasons given for movements are as important as the movements themselves. Ofgem attributed the October 2025 rise to increases to parts of the costs of transporting energy in Great Britain, meaning England, Scotland and Wales, and to costs towards government schemes and essential support5. That is a different driver from wholesale gas prices, and it explains why the cap can rise even when the wholesale market is calm.
"There have been increases to parts of the costs of transporting energy in Great Britain (England, Scotland and Wales)."
For a household, the practical consequence is that the default tariff is not a stable baseline. It is a quarterly reset that follows a cost stack, and the cost stack has changed composition over the period. Network costs and scheme costs now carry more of the total than they did when the cap was introduced.
Regional variation: why the same tariff costs more in some regions
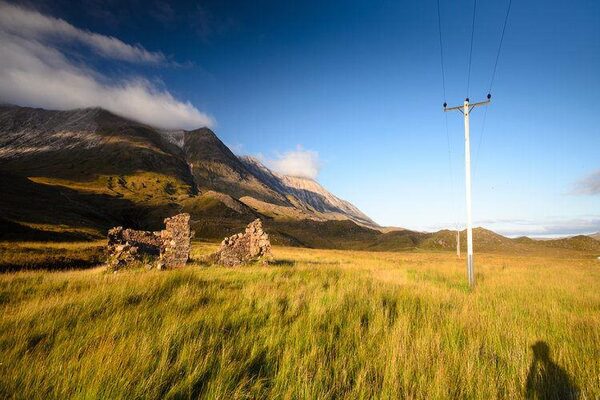
The same capped tariff costs different amounts in different parts of Great Britain, and the reason is structural rather than commercial. Ofgem's regional tables show the standing charge and the annual illustration varying by region at identical consumption, and the variation is large enough to matter over a year2.
The distribution networks differ in age, density and the cost of maintaining them, and those costs are recovered through the standing charge. That is why a rural or sparsely populated area can carry a higher fixed daily cost than a dense urban one, and why the standing charge is the component that varies most between regions. The unit rate varies too, but by less.
The 1 October to 31 December 2025 tables show the same pattern by payment method. For Southern, the standard credit cap level was £183.50 at nil consumption and £1,008.32 at 3,100 kWh on a single rate, while the prepayment level for Eastern was £167.73 at nil consumption and £926.96 at 3,100 kWh5. Those are different regions and different payment methods, so they are not directly comparable, but they show the range the tables cover.
For a household, this means that a comparison between two homes in different regions on the same tariff is not a like-for-like comparison. It also means that the standing charge is the part of the bill least responsive to changing behaviour, because it is charged per day regardless of use.
Fixed and variable tariffs: how the GB market splits
The default tariff is the fallback, not the whole market. Ofgem's research on what drives consumer satisfaction found that whether a household has switched supplier or tariff accounts for 5% of the explained variance in its Demographic and Energy Characteristics model, and 0.6% of total variance4. That is a striking result: the decision that most directly determines what a household pays is only weakly predicted by who that household is.
The market also splits by tariff structure. Ofgem's 2021 consumer survey found that 3% of consumers were on a time-of-use tariff, defined as a smart meter with different prices by time of use, not Economy 7 or 10, with the results described as indicative15. The same survey found that half of all consumers, 51%, reported being on a green tariff currently or said they were likely to switch to one, with a further 24% saying they were likely to switch to one in the next five years15. Among those not switching, 13% cited not enough information to decide, rising to 18% among those not worried about climate change15.
Time-of-use tariffs are structured so that electricity prices vary throughout the day, usually with a cheaper overnight charging window16. Ofgem's impact assessment work suggests those who do not generally use electricity at peak times, meaning 4pm to 7pm, could save over £200 a year by switching from the price cap to a tariff that changes throughout the day17. That is a modelled figure for a specific usage pattern, not a general saving.
The Feed-in Tariff scheme, though closed to new applicants, still illustrates how supplier market share is used administratively: its costs are spread across all licensed electricity suppliers in Great Britain through the levelisation process, based on their share of the electricity supply market18. Each supplier's share of the Great Britain electricity market is used to apportion the cost, taking into account any contribution already made20.
Why switching still matters when the cap sets the default
The cap sets a ceiling, and a ceiling is not a target. A supplier can offer a fixed tariff below the cap, and those tariffs are where the competitive part of the market operates. The cap exists because the default tariff would otherwise move with the wholesale market without the household having chosen that exposure.
The statutory basis is the Domestic Gas and Electricity (Tariff Cap) Act 2018, which requires Ofgem to put in place and maintain the licence conditions giving effect to the cap8. The cap was conceived as temporary, alongside faster switching and smart meters9. Its persistence reflects how long those reforms have taken to mature rather than a change in the original design.
Switching behaviour responds to perceived costs. Ofgem's research on consumer tariff choices found that 70% of consumers who thought they had an exit fee on their current contract would take a £300 exit fee deal21. That is a hypothetical choice in a research setting, but it shows how strongly a perceived penalty shapes the decision.
For energy independence, the picture is mixed. A household on a default tariff is protected from short-term wholesale spikes but exposed to quarterly resets driven by network and scheme costs it cannot influence. A household on a fixed tariff has certainty for the term but takes on the risk that the cap falls below its fixed rate. Neither position reduces dependence on the grid or on a supplier; both are choices about how the cost of that dependence is priced.
Barriers to switching: debt, prepayment and standard credit premiums
Not every household can switch freely, and the barriers are specific. Ofgem's switching guidance sets out the debt rules. If a household has a prepayment meter and owes the supplier up to £500, it can switch22. If it owes money to an old supplier and has been in debt to them for less than 28 days, any money owed should be added to the final bill22. If the switch is not completed in time, the new supplier must pay the household £4022.
Suppliers are also expected to review payments and debt repayments, under consumer protection rules16. Ofgem has consulted on proposals to ensure customers at risk of getting into debt are better supported23, and Citizens Advice offers information and support on struggling to pay bills, problems with an energy supplier or supply, saving energy at home and getting a better energy deal24.
Payment method is itself a barrier in cost terms. Standard credit and other payment methods carry higher cap levels than Direct Debit, and the tables are published separately for each. Network operators accept payment through a cheque, cash or bank transfer, automatically if they have bank details, or via the energy supplier added to the energy account or prepayment meter25. Each of those routes carries handling cost, and the cap reflects it.
Off-gas homes: where the cap's protection ends
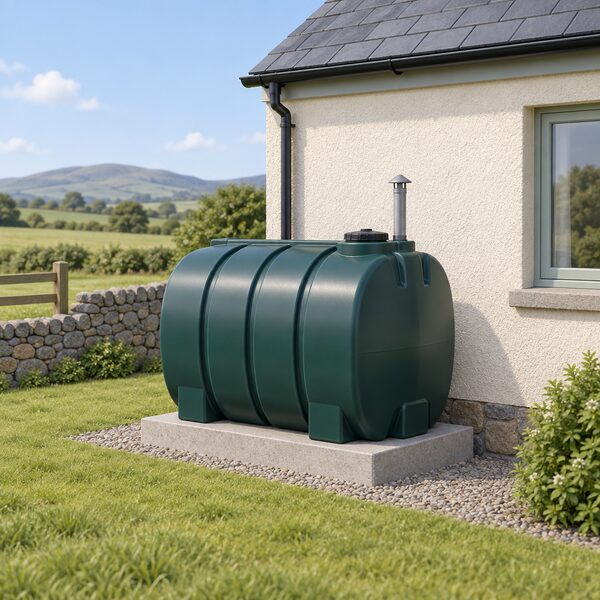
The cap covers gas and electricity supplied through the grid. It does not cover the fuels used by homes off the gas network, and the share of those homes is substantial. In 2024, 16.0% of domestic properties in Great Britain were off the gas grid, rising to 19.5% in Scotland, while the East Midlands had 11.9%7.
That means roughly one in six GB households, and closer to one in five in Scotland, has no default tariff protection for its heating fuel. Those homes buy heating oil, LPG or solid fuel at prices set by the fuel market, and they carry the storage and delivery logistics themselves. The cap offers them nothing on the heating side, though they remain covered for any electricity they use.
Ofgem's consumer archetypes make the same point in segmentation terms. Archetype G17, upper middle income with oil or other heating in unconventional rural housing, covers 163,166 households, and archetype G18, upper middle income with other heating fuel in rural owner-occupied housing, covers 667,836 households. Together these archetypes represent 831,002 households, or approximately 3% of UK consumers26. Archetype H19, upper-middle income with oil heating in rural housing with a poor EPC, covers 675,712 households26.
For these households, energy independence is a different proposition. There is no capped default to fall back on, no supplier obliged to offer a protected rate, and no quarterly reset that limits exposure. The fuel is bought outright and stored on site, which gives control over timing but not over price.
How Ofgem models households: the consumer archetypes
Ofgem does not model a single typical household. It models a set of archetypes, and the spread between them is wide enough that any single "typical" figure should be treated with caution. The archetypes carry household counts, average annual electricity consumption and modelled bill ranges.
| Archetype | Description | Households | Average annual electricity | Modelled bill range |
|---|---|---|---|---|
| A1 | Lower consumption | 578,333 | 2,742 kWh | £35 to £50 |
| A2 | Lower consumption | 868,191 | 2,849 kWh | £45 to £80 |
| B4 | Low income, electric heating, 65+ | 731,318 | 4,811 kWh | £55 to £95 |
| B5 | Low income, electric, solid fuel or LPG heating, 45+ | 465,288 | 6,597 kWh | £40 to £60 |
| C9 | Lower-middle income, retired 65+, owner occupied | 3,408,514 | 3,337 kWh | £60 to £100 |
| D12 | Mid-range | 1,457,829 | 3,952 kWh | £40 to £60 |
| G17 | Upper middle income, oil or other heating, rural | 163,166 | 5,901 kWh | £90 to £165 |
| G18 | Upper middle income, other heating fuel, rural owner occupied | 667,836 | 5,294 kWh | £100 to £170 |
| H19 | Upper-middle income, oil heating, rural, poor EPC | 675,712 | 4,907 kWh | £60 to £85 |
Source: Ofgem consumer archetypes, 202426.
The range in average annual electricity consumption runs from 2,742 kWh for archetype A1 to 6,597 kWh for archetype B5, a difference of more than a factor of two26. The modelled bill ranges overlap heavily, which reflects the fact that standing charges and payment methods shift the total independently of consumption.
This matters for how switching statistics should be read. A headline figure about how many households switched, or how many are on the cap, describes a population in which the underlying consumption and circumstances differ enormously. Archetype C9 alone covers 3,408,514 households, more than the next three archetypes combined26. Any average drawn across the whole set is dominated by the largest groups.
Where to get free help: Citizens Advice and the Energy Ombudsman

Free, independent help exists and is funded rather than commercial. Citizens Advice consumer service can be reached on 0808 223 1133 in England and Wales, with a Welsh language line on 0808 223 1144, and opening hours of Monday to Friday, 9am to 5pm16. In England there is also a line on 0808 144 884424. The service covers struggling to pay bills, problems with an energy supplier or supply, saving energy at home and getting a better energy deal24.
Citizens Advice may refer a household to the Extra Help Unit if it needs support with a difficult or urgent complaint, cannot deal with its energy supplier on its own due to personal circumstances, is considered vulnerable, or is at risk of being disconnected from an energy supply27. That referral route is for cases the standard service cannot resolve.
Ofgem's own complaints guidance sets out the escalation path where a supplier has not resolved a complaint27. The Energy Ombudsman handles disputes that have exhausted the supplier's process, and its consumer advice covers areas such as time-of-use tariffs and home charging, where it notes that electricity prices vary throughout the day, usually with a cheaper overnight charging window16.
For a household, the practical value of these routes is that they are free and independent of the supplier. They do not reduce the bill directly, but they can resolve billing errors, enforce the switching rules and, in the Extra Help Unit's case, intervene where a household is at risk of disconnection.
Sources27 cited
- Energy price cap and switching statistics, House of Commons Library, 2026
- Energy price cap levels, 1 July to 30 September 2026, Ofgem, 2026
- Energy price cap will rise 2 percent in October, Ofgem, 2025
- What drives consumer satisfaction with energy suppliers, Ofgem, 2025
- Changes to the energy price cap between 1 October and 31 December 2025, Ofgem, 2025
- Energy statistics, Uswitch, 2025
- Off-gas grid households research briefing, House of Commons Library, 2024
- Domestic Gas and Electricity (Tariff Cap) Act 2018, legislation.gov.uk, 2018
- Energy price caps explained, Ofgem, 2020
- Spring Statement 2022, HM Treasury, 2022
- What happens if your energy supplier goes out of business, Ofgem, 2026
- Edinburgh local heat and energy efficiency strategy, City of Edinburgh Council, 2023
- Energy price cap levels, 1 October to 31 December 2025, Ofgem, 2025
- Energy price cap will rise 6.4 percent in April, Ofgem, 2025
- Consumer Survey 2021: decarbonisation and home energy use, Ofgem, 2021
- EV tariffs and home charging: what consumers need to know, Energy Ombudsman, 2026
- Consumer Consent Solution impact assessment, Ofgem, 2026
- Feed-in Tariffs scheme, Ofgem, 2026
- Feed-in Tariffs scheme: FIT 0, Ofgem, 2026
- FIT guidance for licensed electricity suppliers, Ofgem, 2024
- Understanding consumers' energy tariff choices, Ofgem, 2025
- Switch your home energy supplier, Ofgem, 2026
- Proposals to support customers at risk of debt, Ofgem, 2023
- Targeting support when energy bills rise in April, Citizens Advice, 2025
- Check if you can get a payment or power cut, Ofgem, 2026
- Ofgem archetypes update 2024, Ofgem, 2024
- Complain about your energy supplier or network operator, Ofgem, 2026
 Financial Resilience RulesYour supplier going bust raises two questions: who takes over and what happens to your credit balance?
 Typical Consumption ValuesOfgem's typical usage figures are what the price cap and most bill comparisons are based on.
 Supplier Licensing and FailureWhat happens when your energy supplier goes bust?
 OfgemOfgem sets the rules energy suppliers and network companies must follow, including the price cap on standard tariffs.
 Tariff Rules and ProtectionsOfgem decides which energy tariffs suppliers can offer you, so it's worth knowing what they must provide.
 Price Cap HistoryThe energy price cap sets the most a supplier can charge you for each unit of gas and electricity, so it shapes what you pay.