
In this guide
Energy Performance Certificates are the basis of many energy efficiency policies in the domestic built environment, and the statistics built from them are the closest thing the UK has to a running census of how efficient its homes are1. In the quarter January to March 2026, 460,000 EPCs were lodged on the register across England and Wales, domestic and non-domestic together, a 2% decrease compared with the same quarter in 20251. Of those, 416,000 were domestic certificates in England, a 1% decrease on the same quarter a year earlier, and 22,000 covered domestic dwellings in Wales, an 8% decrease1.
The headline numbers matter because lodgement counts are used as a proxy for housing activity: a certificate is required when a home is built, sold or let, so the quarterly flow tracks the market rather than the stock. Over the 12 months to March 2026, 1,649,000 domestic EPCs were lodged in England, a 4% increase on the previous 12 months1. The band distribution tells a different story, about the condition of the housing stock itself, and it is the part of the data that policy targets are written against.
This page explains what an EPC contains, how the 1 to 100 score and the A to G bands are produced, when a certificate is required, what the quarterly statistics show, how coverage of the housing stock varies, and what reform is coming.
What an EPC is and what the certificate contains
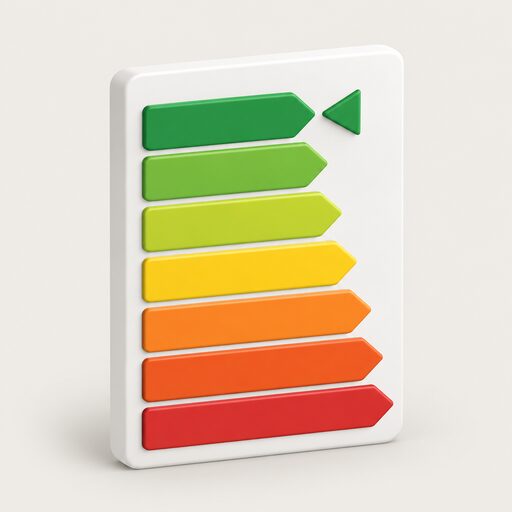
An EPC is a widely used measure of the energy performance of buildings, in both the residential and commercial sectors3. It provides information about the energy efficiency and emissions of a building, and it comes with a report setting out the cost effective measures that owners or businesses can take to improve the energy efficiency and energy rating, such as low energy bulbs or upgrading insulation4. The certificate itself carries information on potential energy costs and carbon dioxide emissions, with a coloured chart showing how energy efficient the building is or could be5.
The Scottish Government's guide to EPCs describes the same document in similar terms: buildings are rated on a scale from A to G, with A being the most efficient, and the certificate includes information on measures which could be made to improve the energy efficiency of the building, with an indicative cost for each improvement6. That improvement report is the part of the certificate most often overlooked, and it is the part that connects the rating to a household's own decisions about insulation, glazing or heating.
The certificate is not a statement of measured consumption. It is a modelled assessment of the building as a fixed set of characteristics, produced by an accredited assessor, and it is that modelled quality which makes it usable as a policy instrument and as a dataset. It is also why the statistics derived from it describe the stock rather than the behaviour of the people living in it.
The rating scale: 1 to 100, bands A to G
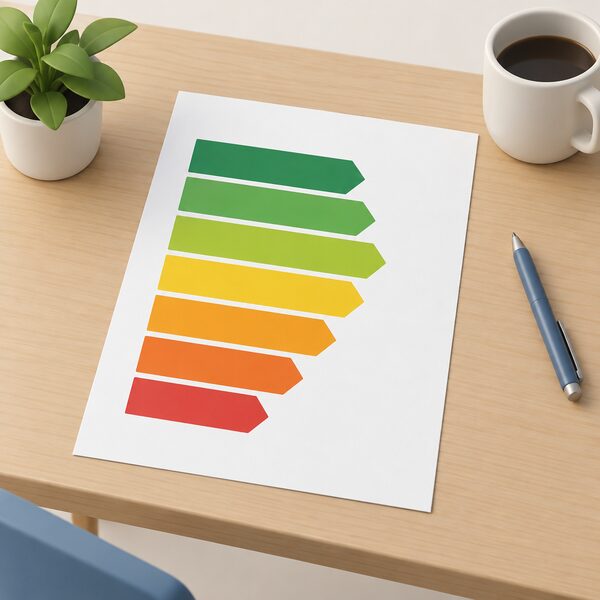
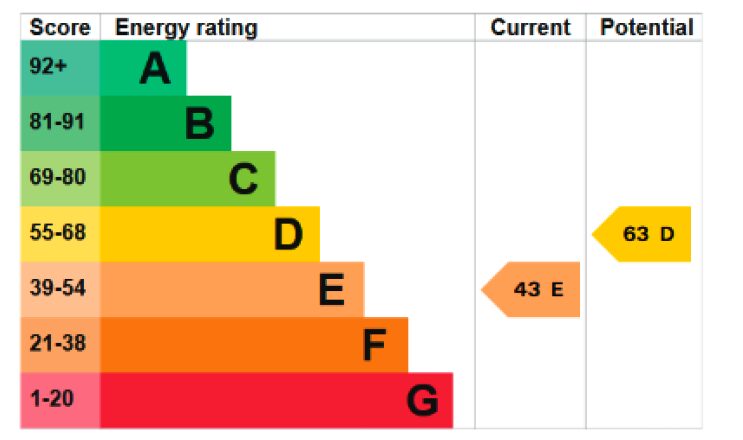
Both the energy efficiency rating and the environmental impact rating are scored on a scale of 1 to 100 and split into bands from A to G4. The score is typically expressed as a figure ranging from 1 to 100, and the bands map onto it as follows2:
| Band | Score range |
|---|---|
| A | Highest efficiency rating |
| B | 81 to 91 |
| C | 69 to 80 |
| D | 55 to 68 |
| E | 39 to 54 |
| F | Between E and G |
| G | 1 to 20 (least efficient) |
The Scottish Government describes the same scale as a 1 to 100+ score presented on a distinctive graphic which shows how the score maps onto seven rating bands represented by the letters A to G7. The quarterly England and Wales release notes that assessments are banded from A to G, where A, or A+ for non-domestic properties, is the most efficient in terms of lighting, heating and hot water1.
The band boundaries are fixed, which is what makes year on year comparison possible, but the score behind them is not a physical measurement. Two homes with the same band can sit at opposite ends of a range, and a home that moves from the top of band D to the bottom of band C has crossed a policy threshold without changing very much in absolute terms. That is worth holding in mind when reading any statistic expressed as a share of homes in band C or above.
How the rating is calculated: SAP and RdSAP
To determine the energy efficiency rating of a home, EPC assessors use the Standard Assessment Procedure, known as SAP4. The content of the domestic EPC is produced by calculations carried out in the SAP methodology8, and the procedure also supports the production of EPCs alongside its role in energy rating of dwellings9. For new dwellings in England, the approved version is the government's Standard Assessment Procedure for the Energy Rating of Dwellings, version 10.3, which also produces the target CO2 emission rate for the dwelling as designed and constructed10.
Existing dwellings are treated differently. EPCs for existing dwellings are produced using the Reduced Standard Assessment Procedure, or RdSAP, a simplified implementation of the SAP methodology based on a site survey, used when the complete data set for a SAP calculation is not available7. That distinction is the single most important caveat in the whole dataset. A certificate lodged for a Victorian terrace under RdSAP and a certificate lodged for a new build under SAP 10.3 are not produced by the same calculation, and comparing them directly compares two methodologies as much as two buildings.
The practical consequence is that the register holds certificates produced under successive versions of the methodology, and the statistics release is explicit that the underlying assessment regime changes over time. Where a figure is described as a median score, it is a median across whatever mix of assessment versions was lodged in the period, not a like for like physical measurement of the stock.
When an EPC is required, and who must provide it

EPCs are needed whenever a property is built, or marketed for sale or rent5. More precisely, they must be provided when a building is advertised for sale or for let to a new tenant, and they are also required upon completion of construction of a new building, and must be displayed by certain large non-domestic buildings11. The Planning Portal states the same rule for existing buildings: an EPC is required when selling or letting an existing building12. The Energy Performance of Buildings Directive as transposed in the UK requires certificates when any building is sold, rented out or constructed, and sometimes after refurbishment work13.
It is a legal requirement for all new build domestic dwellings in England and Wales to have an EPC when completed14. In Scotland, the Energy Performance of Buildings (Scotland) Regulations 2008 place obligations on building owners to provide an energy performance certificate when buildings are to be sold or rented out, and a requirement to issue EPC data to a register has also been introduced15. An EPC is required as part of the Home Report for buildings for sale in Scotland, and an EPC is required for every individual dwelling that is rented out16.
Responsibility sits with the owner. It is the owner's or landlord's responsibility to make sure they have an EPC, to make it available to potential buyers or tenants, and to give a copy to the new owner when selling5. Private rented sector properties in England and Wales must meet a minimum EPC rating of E or above, and the government publishes the exemptions from that standard18.
How many EPCs are lodged each quarter
Lodgement counts are the flow measure in the statistics, and they move with the housing market rather than with the stock. The most recent release covers January to March 20261:
| Measure, England unless stated | Q1 2026 | Change |
|---|---|---|
| Domestic EPCs lodged | 416,000 | 1% decrease year on year |
| Existing dwelling EPCs | 368,000 | 2% decrease |
| New dwelling EPCs | 48,000 | 6% increase |
| Non-domestic EPCs | 21,000 | 7% decrease |
| Domestic EPCs lodged, Wales | 22,000 | 8% decrease |
| EPCs lodged, England and Wales, all types | 460,000 | 2% decrease |
The 12 month figures smooth the quarterly noise. In the 12 months to March 2026, 1,649,000 domestic EPCs were lodged in England, a 4% increase on the previous 12 months, and 204,000 EPCs were lodged for new dwellings, a 2% increase on the previous year1. Non-domestic lodgements ran the other way: 87,000 in the 12 months to March 2026, an 8% decrease on the previous 12 months1.
For comparison, the April to June 2025 quarter saw 495,000 domestic EPCs lodged in England, a 21% increase on the same quarter a year earlier, and 544,000 EPCs lodged across England and Wales including non-domestic certificates19. Non-domestic lodgements in that quarter were 23,000 in England, a 9% decrease compared with the same quarter in 2024, and 93,000 over the 12 months to June 2025, a 14% decrease19. The gap between a 21% rise in one quarter and a 1% fall a few quarters later is the clearest illustration that this series tracks transaction and construction activity, not a steady underlying trend.

What the ratings show: how efficient the housing stock is
The band distribution is where the statistics become a statement about the country rather than about the market. New dwellings are consistently the most efficient part of the stock: in the quarter January to March 2026, 87% of new dwellings in England were given an A or B rating, an increase from 86% in the same quarter a year earlier1. The median score for new dwellings in England rose from 82 in the five year period to March 2013 to 84 in the five year period to March 20252.
Older and rural stock sits lower. Flats and maisonettes were the most energy efficient property type in England and Wales, with a median score of 74, while existing larger rural properties scored 67, similar to urban or larger rural areas, both scoring 692. The gap between a median of 84 for new build and 67 for larger rural existing homes is the stock's central fact: efficiency is concentrated in what has been built recently.
The longer trend is one of improvement. In 2010, just 14% of UK homes had an Energy Performance Certificate of C or above; by the time of that statement it was 46% and rising20. In Scotland, homes in the social rented sector are now some of the most energy efficient, with 85% already achieving EPC D or above21. An earlier Scottish assessment found social housing generally more energy efficient, with 56% of homes having attained EPC C22.
Ratings by tenure, dwelling type and age
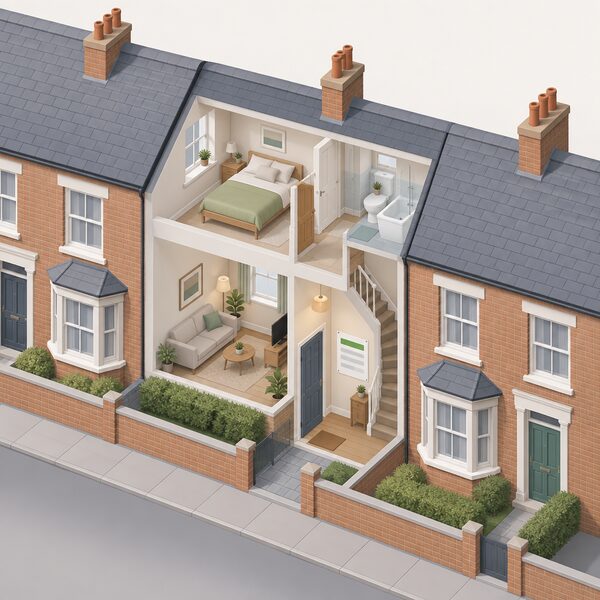
Tenure is one of the sharpest dividing lines in the data. Around 2% of dwellings in the social sector are within EPC bands E, F or G, while 12% of owner-occupied dwellings and 14% of the private rented sector are within those bands23. The private rented sector therefore has the largest share of the least efficient homes, which is the reason minimum standards have been aimed at it.
Age and location reinforce the pattern. New dwellings in England moved from a median score of 82 in the five year period to March 2013 to 84 in the five year period to March 2025, while existing larger rural properties scored 67 and urban or larger rural areas scored 692. Coverage itself is uneven by age: a much smaller proportion of dwellings built before 1930 in Wales were covered by an EPC, at 58%2.
Northern Ireland publishes its own breakdown. The Northern Ireland Statistics and Research Agency table CT0059 presents Energy Performance Certificate band by household tenure by resident characteristics, using Census 2021 estimates that classify usual residents in Northern Ireland living in households by EPC band, by household tenure and by resident characteristics24. That is a different construction from the England and Wales lodgement series: it is a census based classification of households rather than a count of certificates lodged, and the two should not be read as the same measure.
| Group | Figure | Period |
|---|---|---|
| Social sector homes in bands E, F or G | Around 2% | 2024 |
| Owner-occupied homes in bands E, F or G | 12% | 2024 |
| Private rented homes in bands E, F or G | 14% | 2024 |
| Flats and maisonettes, median score | 74 | To March 2025 |
| Existing larger rural properties, median score | 67 | To March 2025 |
| New dwellings, median score | 84 | To March 2025 |
Coverage: how much of the housing stock has an EPC
Coverage is the question that determines how far the statistics can be treated as a description of the whole stock. Just over 71% of all residential dwellings in England, and 67% in Wales, had at least one EPC registration since records began in 2007, as of March 20252. The quarterly release puts the same measure at around 71% of the housing stock in England and around 67% in Wales, based on Census 2021 analysis1.
An earlier release gave lower figures, describing EPCs as covering around 60% of the housing stock in England and around 55% in Wales, also based on Census 2021 analysis by the ONS19. The two sets of figures are not reconciled in the documents, and the difference is large enough to matter when coverage is used to judge how representative the band distribution is. Both are official statistics; the later release gives the higher figures.
Coverage is also uneven within each nation. A much smaller proportion of dwellings built before 1930 in Wales were covered by an EPC, at 58%2. Since older homes are also the least efficient on average, the properties least likely to appear in the data are the ones the data would most usefully describe. That is a structural limitation of a register built from transaction and construction events rather than from a survey of the stock.
For context on the denominator, the dwelling stock estimates for England are accredited official statistics, published for 31 March 202525. The gap between the number of dwellings in England and the number with a lodged certificate is the part of the housing stock for which no EPC based assessment exists at all.
What the data is used for, and who can access it

The EPC is publicly available, and some of the underlying data may be shared with others for the monitoring and compliance of the EPB regulations, with government also able to use some data for research or statistical purposes5. The register itself is kept by the Secretary of State for the Department of Levelling Up, Housing and Communities, and the unauthorised disclosure of data is a criminal offence26.
User research into the England and Wales statistics found the data is generally split between several needs: communication methods for journalist or social media posts, comparing areas of housing to help understanding of possible improvements, gathering data on rating and floor area to create price per metre data, and enabling up to date calculation of the carbon score27. The same research found the most useful data is the current EPC, its potential and the floor area, and noted a dashboard to provide more accessibility to the data underlying the live tables27. Seven users were interviewed remotely for that study27.
The statistics themselves have been upgraded in status. The figures in the release were changed from "Official Statistics in development" to "Official Statistics" from October 2024, on the basis of improvements to the data1. The next release, covering April to June 2026 for England and Wales, is expected on 30 July 20261.
Reform: new ratings, shorter validity and the Home Energy Model
The assessment regime is being rebuilt. The Scottish Government has set out plans to reform EPCs by introducing new ratings, redesigning the certificates, and making improvements to the operational infrastructure11. The UK Government expects the Home Energy Model to be introduced as the basis for calculating EPC ratings in the second half of 2026, establishing a new technical infrastructure to replace the current Standard Assessment Procedure with the new UK Home Energy Model, together with a new EPC Register28.
In Scotland, EPCs are to be generated using the UK Government's new Home Energy Model, which will replace the current Standard Assessment Procedure methodology in autumn 202629. Validity is also in scope: the Scottish Government has stated that it is reducing the validity period of EPCs from ten to five years29. The current rule remains ten years, and a certificate can be used multiple times during that period5.
Policy targets are written against the bands. Upgrading fuel poor homes in England to EPC band C "where reasonably practicable" is one stated aim30. The government has also announced £15 billion to improve energy efficiency and cut bills20. Reducing the price of electricity relative to gas would make heat pumps more competitive, which bears on the running cost case for low carbon heating rather than on the certificate itself31.
Sources31 cited
- Energy Performance of Buildings Certificates Statistics: January to March 2026, England and Wales, GOV.UK, 2026
- Energy efficiency of housing in England and Wales: 2025, Office for National Statistics, 2025
- Energy Performance Certificates in buildings: call for evidence, GOV.UK, 2018
- Energy Performance Certificates, House of Commons Library, 2026
- Energy Performance Certificates, nidirect, 2026
- Energy Performance Certificates guide, Scottish Government, 2026
- Domestic EPC reform consultation, Scottish Government, 2021
- Technical annex for chapter 2: what EPCs measure, GOV.UK, 2026
- National Calculation Methodology and Product Characteristics Database, NCM PCDB, 2026
- Notice of approval of the methodologies of calculation of the energy performance of new buildings, GOV.UK, 2026
- Energy Performance of Buildings (Scotland) Regulations 2025: update and government response, Scottish Government, 2025
- When is an Energy Performance Certificate required?, Planning Portal, 2026
- Energy Performance of Buildings (Scotland) Regulations 2025: amended regulations business and regulatory impact assessment, Scottish Government, 2026
- Energy Performance of Buildings Certificates: change note, GOV.UK, 2025
- The Energy Performance of Buildings (Scotland) Regulations 2008, legislation.gov.uk, 2026
- Energy Performance Certificates guide: buildings for sale, Scottish Government, 2026
- Energy Performance Certificates guide: buildings for let, Scottish Government, 2023
- View private rented sector energy standards exemptions, GOV.UK, 2026
- Energy Performance of Buildings Certificates Statistics: April to June 2025, England and Wales, GOV.UK, 2025
- £15 billion to improve energy efficiency and slash bills, GOV.UK, 2022
- Energy efficiency in homes, Scottish Government, 2026
- Heat in Buildings Strategy: business and regulatory impact assessment, Scottish Government, 2021
- Scottish House Condition Survey 2024: Key Findings, Scottish Government, 2026
- CT0059: Energy Performance Certificate (EPC) band by household tenure by resident characteristics, NI, Northern Ireland Statistics and Research Agency, 2024
- Dwelling stock estimates in England: 31 March 2025, GOV.UK, 2026
- The Energy Performance of Buildings (Amendment) Regulations 2024: explanatory memorandum, legislation.gov.uk, 2026
- Energy Performance of Buildings Certificates in England and Wales: user research, GOV.UK, 2021
- EPC reform consultation: government response, Scottish Government, 2025
- Heat in Buildings: progress report 2025, Scottish Government, 2025
- Carbon Budget Delivery Plan, GOV.UK, 2026
- Research briefing: heat pumps and the electricity price, Parliamentary Office of Science and Technology, 2026
 Energy Performance CertificatesAn Energy Performance Certificate rates how energy efficient your home is, from A down to G.
 New Build Energy PerformanceHow energy efficient are new build homes compared with older ones?
 EPC Regulations and ReformSelling or renting out a home means you need an Energy Performance Certificate.
 Read an EPCA walk through each part of an EPC: the A to G rating and potential rating, the estimated costs, the fabric and heating assumptions and the recommendation table, plus what the assessor did and did not inspect and how the rules differ across the UK.
 Get an EPC for Your HomeSelling or renting out a home means you need an Energy Performance Certificate.
 Energy Checks Before BuyingHow energy efficient is the house, and what will it cost to heat?