

In this guide
The official picture of energy in the United Kingdom is carried by a small family of statistical publications, nearly all of them produced by the department responsible for energy and published free on GOV.UK. Energy Trends is the quarterly bulletin containing statistics on all major aspects of energy in the UK, published as accredited official statistics1. Quarterly Energy Prices is its companion on price, covering energy prices to domestic and industrial consumers for all the major fuels2. The Digest of United Kingdom Energy Statistics is the annual reference volume, giving a comprehensive picture of the production and consumption of individual fuels and of energy as a whole3. Energy Consumption in the UK sets out how that energy is used across industry, transport, domestic and services4. UK energy in brief is the short summary of key annual statistics5.
Between the quarterly editions, a monthly Energy Trends and Prices statistical release refreshes the tables. It typically lands on a Thursday towards the end of the month: the release of 30 June 2026 announced the next for Thursday 30 July 2026, and the July release announced Thursday 27 August 20266. Each release names the exact data period it covers, so a reader always knows how recent the numbers are: the January 2026 release carried retail price data and EU comparative data for December 2025, with petrol and diesel data for January 20268.
For a household, these publications are the raw material behind almost every claim made about energy bills, heating, generation and efficiency in the UK. They do not tell a household what to do, and they are not a live feed: they are dated snapshots, revised over time, produced by a government department. Understanding which publication answers which question, and how current each one is, is the difference between quoting a figure correctly and quoting one that has been superseded.
Quarterly Energy Prices, and how it sits alongside Energy Trends
Quarterly Energy Prices is a quarterly statistical publication on energy prices10. Its coverage is energy prices to domestic and industrial consumers for all the major fuels2, and the 2016 edition also presented comparisons of fuel prices in the European Union and G7 countries3. The publication is built of tables, charts and commentary3, with links to the price tables provided from the main document itself in the June 2024 edition10. Recent editions, including June 2016, June 2024 and December 2025, all carry accredited official statistics status3.
Energy Trends covers the wider ground. It is a quarterly bulletin of statistics on all major aspects of energy in the UK, also accredited1. Where Quarterly Energy Prices answers what fuel costs, Energy Trends answers what was produced, imported, converted and consumed. The monthly Energy Trends and Prices statistical release carries data for the UK on monthly production and consumption of coal, electricity, gas, oil and total energy: the release of 31 August 2017, for instance, included data up to the end of June 2017, and prices statistics for July 201711. The pattern persists: the June 2026 release carried retail price data and EU comparative data for May 20266.
That two month lag on energy data and one month lag on prices matters in practice. A household reading a release in late June 2026 was reading price data for May 2026 and energy data that ran to an earlier month still. For anyone tracking bills against the published series, the record of domestic energy prices over time and the European comparison both rest on these tables. The dependence is plain: there is no independent household source for national fuel prices of this kind, so the household, the analyst and the journalist all rely on the same departmental series and the same publication timetable.
Digest of UK Energy Statistics: the annual reference volume

The Digest of United Kingdom Energy Statistics, known as DUKES, is the annual energy statistics publication of the department12. Its scope is deliberately broad: it provides a detailed and comprehensive picture on the production and consumption of individual fuels and of energy as a whole over the last three years, and a detailed picture for the last five years12. That five year detail is what separates DUKES from the monthly and quarterly releases, which are concerned with the newest months rather than with a settled run of history.
DUKES carries accredited official statistics status12. The 2016 edition was published on 27 July 2017 by what was then the Department for Business, Energy and Industrial Strategy12, a reminder that these series have passed through several departmental names while keeping their continuity, and that a citation should name the publication and its year rather than assume a fixed publisher.
In practice a reader turns to Energy Trends for the latest quarter and to DUKES for the authoritative annual figure that will be quoted for the following twelve months. Where the two differ for the same period, the annual volume is the later and more fully reconciled statement. For the household lens, DUKES is where the national fuel mix and the balance between domestic production and imports are set out: the underlying question of how much of the country's energy is generated within it, which is the national-scale version of the question a self-sustaining home asks of its own roof.
Energy Consumption in the UK: accredited statistics on how energy is used
Energy Consumption in the UK, usually shortened to ECUK, gives information for overall energy consumption in the UK with details of the industry, transport, domestic and services sectors4. It is accredited official statistics13. The 2025 edition was published on 25 September 2025 and last updated on 20 April 20264. The main PDF is given as 894 KB and 22 pages, and a second figure of 363 KB and 15 pages also appears against the release, so a reader downloading the file should expect one or the other4.
ECUK is the publication that turns national energy totals into end uses. It is the natural companion to the household consumption statistics and to the sub-national series. Energy consumption statistics for local authority areas, produced by the department, are one of the two main data sources behind the UK local authority and regional greenhouse gas emissions statistics, alongside the UK National Atmospheric Emissions Inventory14. Those emissions statistics are themselves accredited official statistics14.
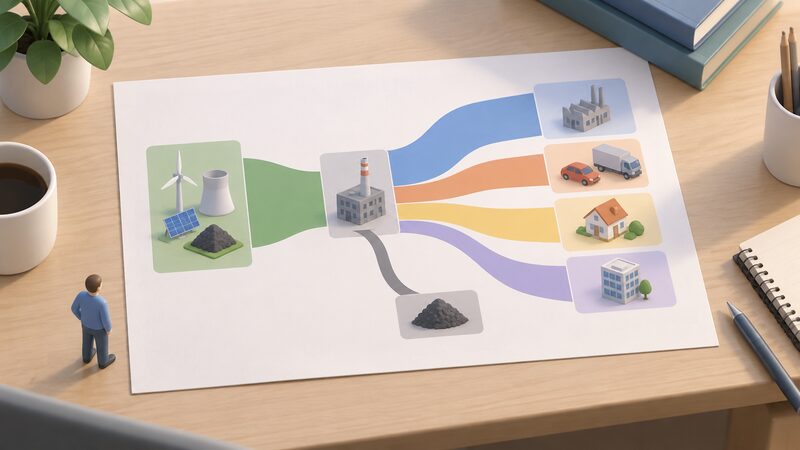
Work on end use has also been published through Energy Trends special feature articles. Experimental statistics on whole UK energy flow incorporating end use energy efficiency appeared as a special feature article from the June 2019 edition of Energy Trends, published on 27 June 2019, as an eight page PDF of 610 KB with accompanying Excel data tables of 108 KB9. Experimental work of this kind is weaker ground than the accredited series, and the label is there to signal it.
At local level, domestic electricity consumption is published as an indicator on the Office for National Statistics Explore Local Statistics service, one of 109 local indicators, with Great Britain data sourced from the department and published on 18 December 202515. Postcode level domestic gas and electricity consumption data is published under the department's name, with its earlier guidance still attributed to the predecessor department16.
UK energy in brief: the short summary publication
UK energy in brief is the digest of the digest: a summary of some of the key annual statistics in the UK energy system5. The 2026 edition was published on 30 July 2026 and last updated on 3 August 20265. It runs to 54 pages as a 2.31 MB PDF, with an accompanying Excel dataset of 331 KB5. It is accredited official statistics5.
Its topics are how energy is produced and used and the way in which energy use influences greenhouse gas emissions, together with combined heat and power, renewable energy, energy efficiency, energy prices and fuel poverty5. For a reader who wants a single document covering the ground rather than a shelf of tables, this is the one that carries the headline charts. It is not a substitute for the detailed series: the figures in it are drawn from the fuller publications, and anyone needing a table rather than a chart will end up in DUKES, Energy Trends or ECUK regardless.
| Publication | Frequency | Status | Latest noted edition |
|---|---|---|---|
| Energy Trends | Quarterly bulletin | Accredited official statistics | June 2016 edition cited1 |
| Quarterly Energy Prices | Quarterly | Accredited official statistics | December 20252 |
| Digest of UK Energy Statistics | Annual | Accredited official statistics | 2016 edition published 27 July 201712 |
| Energy Consumption in the UK | Annual | Accredited official statistics | 2025, updated 20 April 20264 |
| UK energy in brief | Annual | Accredited official statistics | 2026, published 30 July 20265 |
| Energy Trends section 6: renewables | Updated through the year | Accredited official statistics | Updated 10 September 202617 |
Accredited official statistics: what the status means

Accreditation is a quality badge applied by the statistics regulator rather than by the publishing department. The National Energy Efficiency Data-Framework states the meaning plainly.
"Accredited Official Statistics status means that our statistics meet the highest standards of trustworthiness, quality,"
The designation is not permanent and is periodically re-checked: continued designation of the domestic NEED statistics as accredited official statistics was confirmed in September 2018 following a compliance check by the Office for Statistics Regulation18. NEED is published as accredited official statistics in its data tables too19. Outside the energy department, the same regime applies: consumer price inflation statistics are accredited official statistics, independently reviewed by the Office for Statistics Regulation in July 201720.
Across the energy and housing releases the status is mixed, and it is worth knowing which tier a figure comes from:
- Accredited official statistics: Energy Trends1, Quarterly Energy Prices2, DUKES12, ECUK4, UK energy in brief5, Energy Trends renewables17, Household Energy Efficiency Statistics headline release June 202621, UK local authority and regional greenhouse gas emissions statistics14, and the English Housing Survey low carbon technologies fact sheet for 2023 to 202422.
- Official statistics: Energy Performance of Building Certificates releases have carried plain official statistics status at various points23.
- Official statistics in development, formerly experimental: the EPC statistical releases for England and Wales have been published under this label23, and the Energy Rating of Housing in Northern Ireland statistics are also official statistics in development24.
The distinction bears directly on how firmly a number can be quoted. Statistics in development are published precisely so that users can comment on them, and they may change. Further reading on revisions, sample sizes and status is set out in the guide to reading UK energy statistics, and the EPC statistics page covers that series in detail.
The release calendar: when each publication comes out
There is no single fixed date that applies to every energy publication. Instead, each release names its successor, and the department maintains a statistics release calendar to which the individual pages refer.
The monthly Energy Trends and Prices releases form the most regular rhythm. The release published on 30 June 2026 stated that the next would take place on Thursday 30 July 20266; the 30 July 2026 release stated Thursday 27 August 20267. Annual publications cluster in the summer: UK energy in brief 2026 on 30 July 20265, DUKES for 2016 on 27 July 201712, and ECUK 2025 on 25 September 20254.
Related housing and efficiency releases run to their own timetables:
| Release | Date given |
|---|---|
| EPC statistics, April to June 2026, England and Wales | Expected 30 July 202625 |
| Energy efficiency of housing, England and Wales, five years rolling | Released 28 October 2025, next release October 202626 |
| Household Energy Efficiency Statistics, headline release | June 2026 edition published as accredited official statistics21 |
| Energy Trends section 6: renewables | Last updated 10 September 202617 |
Older cycles show the same pattern of a stated next date, not always a single one. The Household Energy Efficiency Statistical Release of March 2023 announced a headline release at 9.30am on 20 April 2023 containing ECO measures up to the end of February 2023, while another passage in the same release pointed to a next quarterly release at 9.30am on 25 May 2023; the two dates sit side by side and a reader should treat the earlier as the headline and the later as the full quarterly set21. Publication times of 9.30am are standard, as with the EPC release confirmed for 28 April 2017 at 9.30am25.
For a household planning around the data, the practical consequence is that any given figure has a shelf life. A price figure quoted in September will usually be a May or June reading, and an annual figure quoted through a year will be superseded the following summer.
Renewables: capacity, generation and liquid biofuels
Section 6 of Energy Trends is the renewables release. It carries data on the UK's renewables sector, including capacity, electricity generation and liquid biofuels consumption17. Its stated focus is renewables electricity generation, renewable electricity capacity, renewable electricity load factors, feed-in tariffs capacity and liquid biofuels consumption17. It is accredited official statistics, and its tables are refreshed through the year rather than only at a single annual edition: the Renewables Obligation Certificate tables were updated on 10 September 202617.
Load factor is the quantity in that list that most concerns a household weighing self-generation, because it describes how much of the theoretical maximum a technology actually delivers over a period. Capacity alone says nothing about output. The solar PV deployment statistics and the feed-in tariff installation statistics draw on the same family of tables, as does the record of renewable generation by UK nation.
Longer analytical pieces appear as Energy Trends special feature articles rather than in the main tables. Renewable energy in 2013 was published on 26 June 2014 as a special feature article from the June 2014 edition27; Renewable energy in 2014 followed on 25 June 2015, a 13 page PDF of 199 KB28. Nation level breakdowns have also appeared this way: electricity generation and supply figures for Scotland, Wales, Northern Ireland and England for 2011 to 2014 were published as official statistics on 22 December 201529. Methodological changes are consulted on in the same format, as with the September 2022 article on proposed changes to the Energy Trends renewables tables, published on 29 September 202230.
For independence, the renewables series is the national mirror of what a household does on its own roof. It shows how much capacity exists and how much it generates, but it says nothing about who owns it or how much of a given home's demand is met on site. Devolved policy adds its own targets, tracked separately from the UK statistics.
Who publishes the statistics and how to reach the team

The publications described here come from the Department for Energy Security and Net Zero, with older editions attributed to its predecessor departments including the Department for Business, Energy and Industrial Strategy and the Department of Energy and Climate Change12. Each statistical release names a responsible team and a contact address, and these differ by subject.
| Subject | Contact |
|---|---|
| Renewables statistics, including Energy Trends section 6 | renewablesstatistics@energysecurity.gov.uk17 |
| Feed-in tariff and MCS domestic battery statistics | fitstatistics@energysecurity.gov.uk32 |
| Energy efficiency and regional consumption statistics | energyefficiency.stats@energysecurity.gov.uk33 |
| Heat pump deployment statistics | EnergyEfficiency.Stats@energysecurity.gov.uk34 |
| Accessible formats of a publication | alt.formats@energysecurity.gov.uk35 |
| Ofgem scheme enquiries | Renewable.enquiry@ofgem.gov.uk36 |
The energy consumption and regional statistics team has historically given a postal address of 3 Whitehall Place, London, SW1A 2AW, alongside an older departmental email address37. Maps showing average electricity, gas and total final energy consumption are published for local authorities in Great Britain37, and regional and local authority gas consumption statistics were first published on 22 January 201333.
Who publishes what, and which bodies sit outside government, is covered further in the guide to who publishes UK home energy data. The wider set of household datasets sits under the UK home energy statistics collection.
Access, formats and what the publications cannot tell you
Every publication named here is put out on GOV.UK or on the Office for National Statistics website and downloaded from those pages. The standard shape is a PDF commentary with accompanying Excel data tables: UK energy in brief 2026 is a 54 page PDF of 2.31 MB with a 331 KB spreadsheet5; Quarterly Energy Prices annexes A to D for June 2016 ran to 47 pages as a 639 KB PDF3; the whole energy flow article came with Excel data tables of 108 KB9. Where a reader needs a different format, the accessible formats address handles the request35.
The limits are as important as the contents. These are dated, revised, national series. They do not show what a particular home used last week, they do not price a particular tariff, and they lag by weeks or months. Where a release is in development rather than accredited, its figures may change. Where two passages in the same document disagree, as with the ECUK 2025 page length and the 2023 household efficiency release dates, the disagreement should be reported rather than resolved by guesswork.
For a household pursuing energy independence, the honest reading is that the national statistics describe the system the home is trying to depend on less: the fuel mix, the import balance, the prices set in markets beyond the household's control. They measure the context, not the escape from it. What the data says about that gap is set out in what the data says about household energy independence.
Sources37 cited
- Energy Trends: June 2016, GOV.UK, 30 June 2016
- Quarterly Energy Prices: December 2025, GOV.UK, 18 December 2025
- Quarterly Energy Prices: June 2016, GOV.UK, 30 June 2016
- Energy Consumption in the UK (ECUK) 2025, GOV.UK, 20 April 2026
- UK energy in brief 2026, GOV.UK, 30 July 2026
- Energy Trends and Prices statistical release: 30 June 2026, GOV.UK, 30 June 2026
- Energy Trends and Prices statistical release: 30 July 2026, GOV.UK, 30 July 2026
- Energy Trends and Prices statistical release: 29 January 2026, GOV.UK, January 2026
- Energy Trends June 2019 special feature: whole UK energy flow and end use energy efficiency, GOV.UK, 27 June 2019
- Quarterly Energy Prices: June 2024, GOV.UK, 27 June 2024
- Energy Trends and Prices statistical release: 31 August 2017, GOV.UK, 31 August 2017
- Digest of UK Energy Statistics 2016, GOV.UK, 27 July 2017
- Energy consumption in the UK 2025 collection, GOV.UK, 25 September 2025
- UK local authority and regional greenhouse gas emissions statistics, 2005 to 2024, GOV.UK, 25 June 2026
- Domestic electricity consumption local indicator, Office for National Statistics, 18 December 2025
- Postcode level domestic gas and electricity consumption: about the data, GOV.UK, 30 March 2017
- Energy Trends section 6: renewables, GOV.UK, 10 September 2026
- National Energy Efficiency Data-Framework report, summary of analysis 2026, GOV.UK, 11 June 2026
- NEED impact of measures data tables 2025, GOV.UK, 26 June 2025
- Consumer price inflation, July 2026, Office for National Statistics, 2026
- Household Energy Efficiency Statistics, headline release June 2026, GOV.UK, 25 June 2026
- English Housing Survey 2023 to 2024: low carbon technologies fact sheet, GOV.UK, 15 May 2025
- EPC statistical release, July to September 2023, England and Wales, GOV.UK, 26 October 2023
- Energy efficiency of housing in Northern Ireland consultation, NI Direct, July 2024
- EPC statistical release, January to March 2026, England and Wales, GOV.UK, 19 May 2026
- Energy efficiency of housing, England and Wales, five years rolling, Office for National Statistics, 28 October 2025
- Energy Trends June 2014 special feature: renewable energy in 2013, GOV.UK, 26 June 2014
- Energy Trends June 2015 special feature: renewable energy in 2014, GOV.UK, 25 June 2015
- Energy Trends December 2015 special feature: electricity generation and supply by UK nation, GOV.UK, 22 December 2015
- Energy Trends September 2022 special feature: proposed changes to tables 3.6 and 3.11, GOV.UK, 29 September 2022
- MCS certified domestic battery installation statistics, GOV.UK, 29 May 2025
- MCS domestic retrofit battery installations data tables, GOV.UK, 28 May 2026
- Regional and local authority gas consumption statistics, GOV.UK, 22 January 2013
- Heat pump deployment statistics: June 2026, GOV.UK, 10 September 2026
- Heat pump deployment statistics: March 2026, GOV.UK, 11 June 2026
- Smart Export Guarantee contacts, guidance and resources, Ofgem, 17 September 2026
- Maps showing average energy consumption, GOV.UK, 22 January 2013
 The Full Statistics GuideHow many homes in the UK have solar panels, heat pumps or batteries?
 Who Publishes Home Energy DataA directory of the organisations producing household energy numbers, from government departments and regulators to certification bodies, trade associations and charities.
 Domestic Energy Prices Over TimeTracks the published domestic gas and electricity unit rates, standing charges and cap levels over time, from the £1,277 cap of early 2022 through the crisis peak to the 2026 quarters.
 Household Energy ConsumptionHow much gas and electricity does a typical UK home use in a year?
 How to Read Energy StatisticsWhy do energy figures change after they are first published, and how much can you trust them?
 Regional Energy ConsumptionHow much gas and electricity does your area use compared with the rest of the country?