

In this answer
Short answer
Fuel poverty rates by local authority are published separately for each UK nation, because fuel poverty is a devolved policy area defined and measured differently across the UK, and rates are not directly comparable between nations1. In England, the Department for Energy Security and Net Zero published sub-regional fuel poverty statistics on 14 May 2026 covering 2024 data, as official statistics in development2. The same release sits behind the fuel poverty indicator on the Office for National Statistics Explore local statistics service, one of 109 local indicators, sourced from the department and published on 14 May 20263.
The national picture behind those local figures differs sharply by nation. In the latest estimates, around 11% of households in England were classed as fuel poor, 34% in Scotland, 14% in Wales and 24% in Northern Ireland4. Earlier estimates, taken before the energy price cap increase in October 2021, put fuel poverty at around 13% of households in England, 25% in Scotland, 12% in Wales and 18% in Northern Ireland5. The gap between those two sets is a measure of how much the price cap period moved the numbers, not a change in method.
For a household, the local rate is a description of the area, not a prediction about the home. It tells you how common the condition is where you live, and it is shaped by the housing stock, tenure mix, income levels and whether the area is rural or urban. The sections below set out what the sub-regional statistics cover, how each nation measures fuel poverty, which areas record the highest and lowest rates, and where to look up your own authority.
What the sub-regional fuel poverty statistics cover
The sub-regional release is an England-only publication. The 2026 report presents official statistics in development on 2024 data, and its territorial extent is England2. The previous edition, published on 30 April 2025, carried the same status and the same England extent, covering 2023 data8. The dataset is also catalogued on data.gov.uk as fuel poverty in England, sub-regional, and carries the Official Statistics marking9.
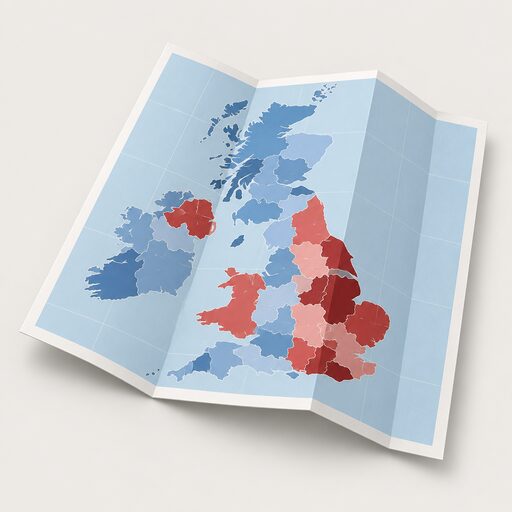
That England-only scope matters when reading a map of the UK. There is no single four-nation dataset at local authority level, because each administration runs its own survey or model. Wales published detailed modelled estimates for Wales as at October 2024, estimating around 340,000 households, or 25%, in fuel poverty10. Scotland publishes through the Scottish House Condition Survey, whose local authority tables for 2022 to 2024 were published on 26 May 20266. Northern Ireland reports through the Northern Ireland Sustainable Energy Programme annual report, which uses a 10% of weekly income definition11.
The English sub-regional figures are classed as official statistics in development rather than accredited official statistics. The national annual fuel poverty statistics report for England, by contrast, is accredited official statistics, published on 26 March 2026 and republished on 7 August 2026 to correct a calculation error on benefit receipt and the description of the median affordability indicator12. A household comparing a local figure with a national headline is comparing a developing series with an accredited one.
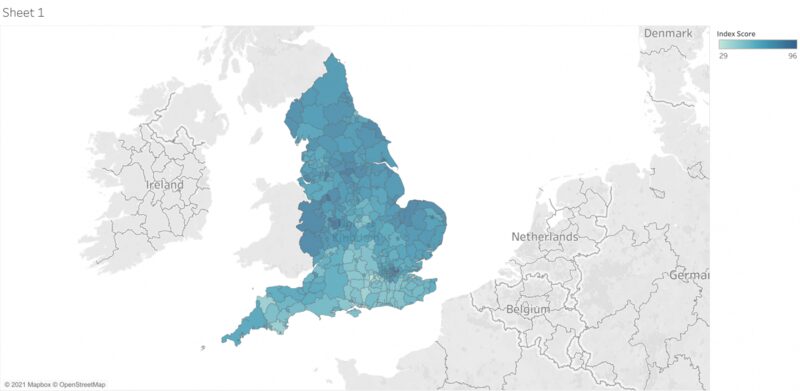
Fuel poverty rates by local authority: England, Wales, Scotland and Northern Ireland
Each nation's headline rate comes from a different instrument, and the four are not interchangeable. The latest estimates place England at around 11% of households, Scotland at 34%, Wales at 14% and Northern Ireland at 24%4. The pre-October 2021 estimates, on the older basis, were around 13% in England, 25% in Scotland, 12% in Wales and 18% in Northern Ireland5.
| Nation | Latest estimate | Earlier estimate, before October 2021 cap increase | Measure |
|---|---|---|---|
| England | around 11% | around 13% | LILEE4 |
| Scotland | 34% | 25% | 10% of net income after housing costs4 |
| Wales | 14% | 12% | Modelled estimates4 |
| Northern Ireland | 24% | 18% | 10% of weekly income4 |
Wales illustrates how a devolved figure is produced. The Welsh Government's modelled estimates as at October 2024 put around 340,000 households, 25%, in fuel poverty10. That is a modelled figure for a specific date, not a survey count, and it sits alongside the 14% figure in the four-nation comparison above; the two figures come from different vintages and measure different points in time, so they disagree and neither replaces the other.
Scotland's position is the highest of the four on the latest estimates, at 34%4. The Scottish Government's own scenario modelling for the April to June 2026 price cap period estimated around 680,000 fuel poor households, a decrease of around 30,000 from the previous quarter, with a 1 percentage point change for the private rented sector compared with the January to March 2026 cap period14. That modelling is tied to cap periods, so it moves with the cap rather than with a survey cycle.
Northern Ireland's definition is the oldest of the four in form: a customer is in fuel poverty if they need to spend more than 10% of their weekly income on energy to obtain an acceptable level of warmth11. Wales, Scotland and Northern Ireland have all had eradication targets at different points; official guidance records that Scotland and Northern Ireland had targets to eradicate fuel poverty by 2016 and Wales by 201815.
How the fuel poverty rate is measured and what counts as fuel poor
England measures fuel poverty using the Low Income Low Energy Efficiency method, known as LILEE10. Under LILEE, a household is fuel poor if it lives in a property with an energy efficiency rating of band D, E, F or G under the most up-to-date Fuel Poverty Energy Efficiency Rating methodology, and its disposable income after housing costs and energy needs would be below the poverty line3. The earlier Low Income High Costs indicator asked whether a household would have to spend more than the median amount on fuel to keep the home at a reasonable temperature, and whether spending that amount would push income below the poverty line16.
Scotland uses a different test. A household is fuel poor where more than 10% of net income, and 20% for extreme fuel poverty, is required to pay for reasonable fuel needs after housing costs have been deducted13. The Scottish Government also sets a maximum median fuel poverty gap: the median gap for households in fuel poverty should be no more than £250 in 2015 prices before adding inflation13. Northern Ireland applies the 10% of weekly income test11.
All three measures rest on the same three drivers: a household's income, its fuel costs, and its energy consumption1. What differs is where the line is drawn and what is held constant. LILEE builds the energy efficiency of the property into the definition, so a home with a poor rating can be fuel poor even where the occupants' income is not far below the poverty line. The 10% measures are income-and-cost tests that do not require a particular band.
"Fuel poverty is a devolved policy area, and is defined and measured differently in different parts of the UK."
The practical consequence is that a 34% Scottish rate and an 11% English rate are not measuring the same thing, and a household should not read the difference as a straightforward statement that Scotland is three times worse off.
Which local authorities have the highest and lowest rates
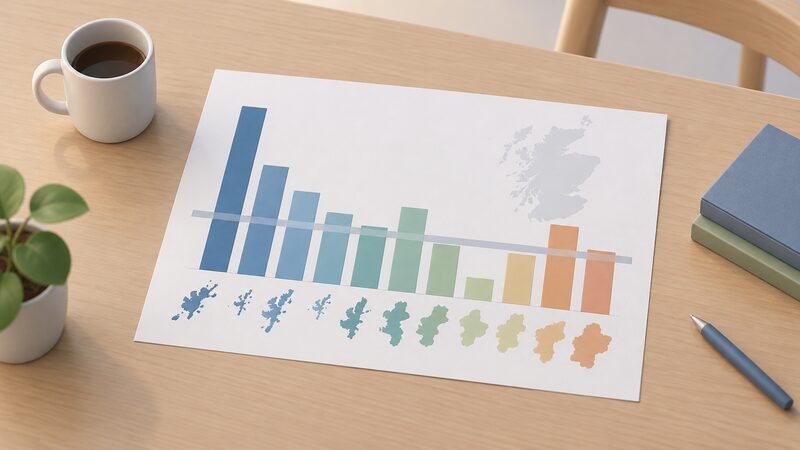
The clearest local authority range in the statistics is Scottish. The Scottish House Condition Survey local authority tables for 2022 to 2024, published on 26 May 2026, show fuel poverty rates ranging from 22% in Stirling to 51% in Orkney Islands, against a Scotland average of 31%6. That is a spread of 29 percentage points within one nation, and it is the single most useful illustration of how much a local rate can depart from a national one.
Earlier Scottish data on extreme fuel poverty, for the 2018 to 2019 period, recorded Na h-Eileanan Siar at 24%, Orkney Islands at 22%, Shetland Islands at 22%, Highland at 22% and Argyll and Bute at 19%7. Those are island and Highland authorities, and they sit at the top of the distribution. At the other end, Scottish fuel poverty rates were highest for remote rural households at 21% and lowest for other urban and accessible small towns at 8% in 202117.
For England, independent work has produced local authority comparisons rather than a single official league table. The English Fuel Poverty Index created a league table of local authority areas by combining fuel poverty figures with data on measures improving energy efficiency18. A separate fuel poverty risk index calculates a score estimating the risk of someone being in fuel poverty for each local authority in England19. Regional data for England is available at LSOA level or local authority and metropolitan authority level20.
Why rates differ so much between local authorities

Tenure is one of the strongest dividing lines. In Scotland in 2024, 52% of households renting from a local authority and 45% of households renting from a housing association were fuel poor, against an overall social sector rate of 49% and a private sector rate of 22%6. A local authority with a large social housing stock will therefore record a higher rate than one dominated by owner occupation, even where incomes are similar.
Income band drives the extremes. Households in the lowest income band, under £15,000 annually, have the highest rate of extreme fuel poverty at 74%6. Households earning £15,000 to £24,999 recorded a 51% fuel poverty rate, the second bottom band, lower than in 20236. Household type matters too: families recorded 25%, older households 30%, and other households 29%6.
Geography compounds both. Fuel poverty levels in Scotland are higher in remote rural areas at 43% and remote small towns at 34% than in urban areas at 24%7. The Scottish Government found fuel poor households in inefficient homes were more likely to live in remote rural areas, 13% versus 8%22. The 2022 survey put the rural rate at 35% against 30% for urban households23.
Property characteristics add a further layer. Scottish fuel poverty rates generally decrease as council tax bands increase, from band A at 38% to band F at 11%, with bands G to H at 14%17. Urban households recorded a 29% rate by urban-rural classification in 20246.
The energy efficiency of the dwelling is the thread running through all of this. England's LILEE definition makes a band D or worse rating a condition of being fuel poor at all3, so an area with older, solid-walled or off-gas housing will show a higher rate regardless of who lives there. That is also where the household's own independence comes in: a local rate describes the stock and the incomes around you, while the rating of your own home and its running cost are the parts a household can change.
How to find your local authority's figure
For England, the starting point is the sub-regional fuel poverty report published on GOV.UK, which presents the 2024 data at local authority level2. The Office for National Statistics Explore local statistics service carries the same indicator, sourced from the Department for Energy Security and Net Zero and published on 14 May 2026, alongside 108 other local indicators3. The underlying dataset is also catalogued on data.gov.uk9.
For Scotland, the Scottish House Condition Survey local authority tables give a rate for each council area, most recently for 2022 to 20246. Home Energy Scotland provides advice on fuel poverty support for households in Scotland24. For Wales, the Welsh Government's modelled estimates give the national position as at October 202410. For Northern Ireland, the Northern Ireland Sustainable Energy Programme annual report sets out the position and the 10% definition used11.
A household wanting an indication of its own status rather than its area's rate can use the Centre for Sustainable Energy's fuel poverty calculator, which is designed to estimate fuel poverty status25. That is a household-level estimate, not a substitute for the official local authority figure.
The wider statistical context is covered in fuel poverty statistics and fuel poverty statistics by local area, with the national headline in what is the fuel poverty rate in England. The UK home energy statistics pillar sets the local figures against deployment, prices and the rest of the data.
Sources25 cited
- Fuel poverty: devolved policy and measurement, House of Commons Library, 20 September 2026
- Sub-regional fuel poverty report 2026: 2024 data, GOV.UK, 14 May 2026
- Fuel poverty indicator, Office for National Statistics, 20 September 2026
- Join the conversation on fuel poverty, IGEM, November 2025
- Fuel poverty, CIBSE, 17 September 2026
- Scottish House Condition Survey 2024: key findings, Scottish Government, February 2026
- Heat in Buildings Strategy: island communities impact assessment, Scottish Government, 11 November 2021
- Sub-regional fuel poverty report 2025: 2023 data, GOV.UK, 30 April 2025
- Fuel poverty in England: sub-regional, data.gov.uk, 14 May 2026
- Fuel poverty modelled estimates for Wales, October 2024, Welsh Government, 16 October 2025
- NISEP Annual Report 2024-25, Utility Regulator Northern Ireland, July 2026
- Annual fuel poverty statistics report: 2026, GOV.UK, 26 March 2026
- Home energy and fuel poverty, Scottish Government, 17 September 2026
- Fuel poverty scenario modelling based on Ofgem energy price caps to April to June 2026, Scottish Government, 2026
- Fuel poverty targets across the UK, Energy and Climate Change Committee, 20 September 2026
- Fuel poverty in England, House of Commons Library, 17 September 2026
- Scottish House Condition Survey 2021: fuel poverty, Scottish Government, 2021
- Fuel poverty map of England revealed, End Fuel Poverty Coalition, 3 October 2021
- Fuel poverty risk index reveals areas under greatest energy bills threat, End Fuel Poverty Coalition, 8 November 2022
- Almost total fuel poverty in some areas despite price freeze plan, End Fuel Poverty Coalition, 6 September 2022
- English Fuel Poverty Index 2021, End Fuel Poverty Coalition, 2021
- Tackling fuel poverty in Scotland: a strategic approach, Scottish Government, December 2021
- Scottish House Condition Survey 2022: fuel poverty, Scottish Government, 2022
- How we help people in fuel poverty, Home Energy Scotland
- Fuel poverty calculator, Centre for Sustainable Energy, January 2026
 Local Fuel Poverty StatisticsHow many households in your area struggle to afford their heating?
 Fuel Poverty PolicyWhy does fuel poverty mean something different depending on where in the UK you live?
 Fuel Poverty in the UKWho counts as living in fuel poverty, and why does the number change depending on where in the UK you live?
 Fuel Poverty StatisticsWhy do fuel poverty figures differ across the UK, and why is there no single number for the whole country?
 Fuel PovertyWhy does Northern Ireland have such a high rate of fuel poverty, and how many households are affected?
 Fuel PovertyHow does Scotland decide if a household is in fuel poverty, and how many homes are affected?