

In this guide
Fuel poverty is a devolved policy area, defined and measured differently in different parts of the UK, and the rates produced under each measure are not directly comparable between nations1. That single fact explains most of the confusion around the subject. There is no UK fuel poverty definition. There are four, and each one decides who counts, who qualifies for support, and what the government is obliged to report.
The general idea is shared. Fuel poverty relates to households that must spend a high proportion of their household income to keep their home at a reasonable temperature2. The original test, still used in three nations, set the threshold at more than 10 per cent of income spent on fuel to maintain an adequately heated home3. England abandoned that test in 2013 and now uses the Low Income Low Energy Efficiency framework, which requires both a low income and a poor energy rating4.
The practical consequence is that a household can be fuel poor under one nation's measure and not under another. England's framework excludes homes rated band C or better even where incomes are very low: in 2024, 3.1 million households in England sat in the lowest two income deciles but were not deemed fuel poor because their property was rated C or better2. Scotland's definition, by contrast, is sensitive to changes in fuel prices, which drove a substantial increase in estimated fuel poverty between 2019 and 20232.
What fuel poverty means: a household that cannot heat its home adequately
The core concept is consistent across every official document. A household is in fuel poverty if it needs to spend more than 10 per cent of its income on energy costs6. Northern Ireland's consultation documents put it as households needing to pay more than 10% of full household income to maintain a satisfactory heating regime at an affordable cost11. Wales uses the same structure: households needing to pay more than 10% of their full household income to maintain a satisfactory heating regime12.
The older parliamentary formulation is the one most people recognise: a household is considered to be in fuel poverty if it needs to spend more than 10% of its income to achieve an adequate level of warmth13. Scotland's traditional definition, used in the Warmer Homes Scotland programme, was that a household would be required to spend more than 10% of its income on all household fuel use to maintain a satisfactory heating regime14. The 2017 Scottish consultation stated the same test in identical terms15.
Northern Ireland's definition adds a temperature standard that the others leave implicit: a fuel poor household is one which needs to spend more than 10% of its income on all fuel use to heat its home to an adequate standard of warmth, defined as 21°C in the living room and 18°C in other occupied rooms16.
Three factors drive whether a household falls inside any of these measures: its income, its fuel costs, and its energy consumption1. The definitions differ mainly in how they treat income (before or after housing costs, including or excluding benefits) and in whether they add a second condition about the property itself. That second condition is what makes England's measure structurally different from the rest.
"In general, fuel poverty relates to households that must spend a high proportion of their household income to keep their home at a reasonable temperature"
A devolved policy area: four nations, four definitions
Fuel poverty is a devolved policy area and is defined and measured differently in different parts of the UK2. The Office for National Statistics has published work specifically to help users understand those differences, written in consultation with the producers of fuel poverty statistics17. It was the first article to use published data to explore the differences and similarities in how the UK measures deal with the main influences of fuel poverty17.
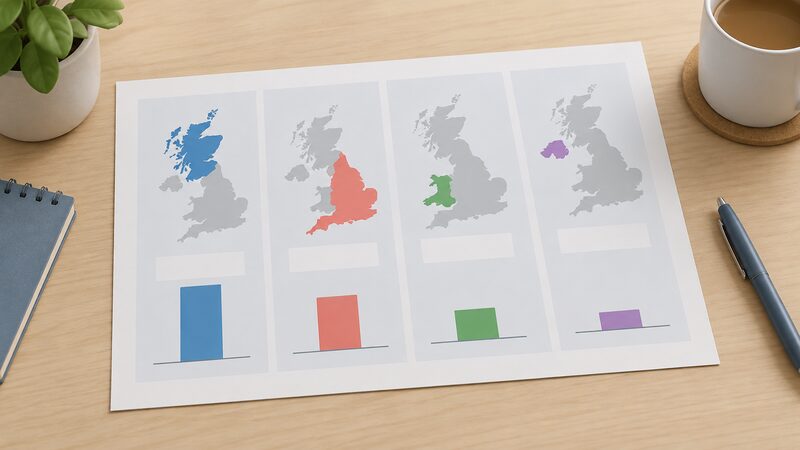
The four measures in outline:
| Nation | Measure | Threshold | Legal basis |
|---|---|---|---|
| England | Low Income Low Energy Efficiency (LILEE) | FPEER band D or below, residual income below poverty line5 | Department for Energy Security and Net Zero statistics18 |
| Scotland | 10% test with income and MIS conditions | More than 10% of adjusted net income after housing costs19 | Section 3, Fuel Poverty (Targets, Definition and Strategy) (Scotland) Act19 |
| Wales | 10% of full income | More than 10% of income including housing related benefits and net of council tax5 | Welsh Government modelled estimates5 |
| Northern Ireland | 10% indicator | More than 10% of full household income11 | Northern Ireland Housing Executive statistics5 |
Scotland's definition is slightly different again from England and Wales in its detail: Scotland uses a higher temperature standard20. Scotland also applies an additional amount for households in remote rural, remote small town and island areas, an uplift that recognises the higher cost of heating in those locations19.
All three devolved administrations have additional, government-funded fuel poverty reduction programmes, focusing on energy efficiency21. That is the practical expression of devolution: separate definitions, separate targets, separate schemes, and separate statistics that cannot be lined up against each other.
England: the Low Income Low Energy Efficiency framework
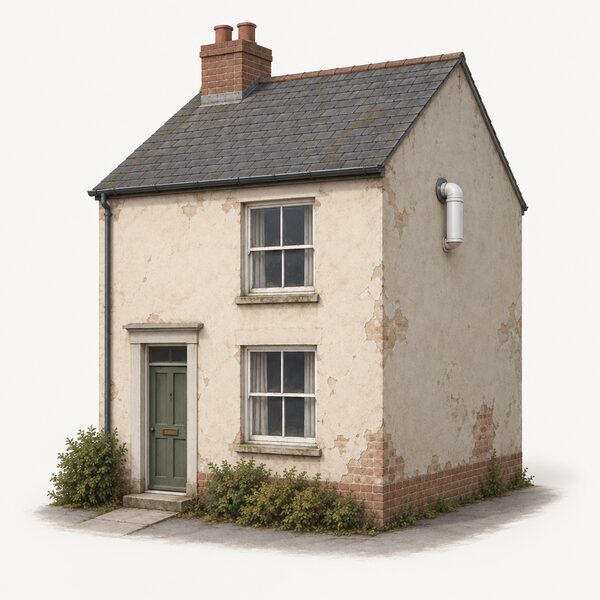
England's measure is the outlier. Fuel poverty in England is measured using the Low Income Low Energy Efficiency method5. A household in England is considered fuel poor if it has a Fuel Poverty Energy Efficiency Rating of band D or below and its residual income is below the official poverty line after modelled energy costs are deducted5.
The definition changed in 20134. Before that, England used the same 10% approach as the other nations. The current framework is sometimes described by its older name, the Low Income High Costs indicator: households in England are now said to be in fuel poverty if they would have to spend more than the median amount on fuel to keep their home at a reasonable temperature, and spending that amount would put their income below the poverty line4.
The effect of the property condition is significant. In England, unlike in the rest of the UK, only those households in homes with lower energy efficiency, bands D to G, who fall below the poverty line after energy costs are considered fuel poor2. In 2024, 3.1 million households in England were in the lowest two income deciles but were not deemed to be fuel poor because their property had a rating of C or better2.
The definition has attracted criticism from the body that scrutinises it. The Committee on Fuel Poverty said it should be reviewed as it no longer captures the full range of households facing unaffordable bills, and the definition has been described as a blunt instrument which leads to an overly skewed policy focus2.
There is a further quirk with consequences for support. In England the definition of fuel poverty means that direct energy rebates, such as the Warm Home Discount, are treated as if they improved the energy efficiency of a dwelling, reducing the numbers deemed fuel poor, but in reality have no impact on improving energy efficiency2. A rebate therefore moves a household out of the statistic without changing the building.
England's criteria: FPEER band D or below and residual income below the poverty line
The Fuel Poverty Energy Efficiency Rating is the energy efficiency rating used in England's measure, and the band that counts is D or below5. A home rated band C or better cannot be fuel poor under the English framework, whatever the household's income.
The income test has two parts. The remaining household income must not be enough to maintain an acceptable standard of living, defined as at least 90% of the UK Minimum Income Standard once childcare costs and disability or care benefits are deducted22. Scotland applies the same 90% of UK Minimum Income Standard test, but on adjusted net income after housing costs rather than on residual income after modelled energy costs5.
The distribution of fuel poverty in England by income band is steep. The fuel poverty rate was 96% for the bottom income band, less than £15,000 annually, which is similar to 202323. It was 51% for the second bottom band, £15,000 to £24,999 annually, lower than 202323. By council tax band, the rate ran from 46% in band A to 21% in band F23.
Fuel type matters as much as income. In 2025, an estimated 7.9% of households with gas central heating were defined as being in fuel poverty, 16.9% of those that used electricity, and 11.5% of those that used other fuels such as LPG, community heating or solid fuels7. The overall rate in England was around 11% of households in the latest estimates2.
The government has estimated that 9.0 million households in England could be classed as fuel poor in 2024 using a version of the 10% definition, almost double its level in 20212. That figure is the clearest illustration of how much the choice of measure, rather than the circumstances of households, determines the headline number.
Scotland, Wales and Northern Ireland: the 10% of income test
The three other nations retained the 10% approach, each with its own adjustments.
In Scotland, total fuel costs necessary for the home must be more than 10% of the household's adjusted net income after housing costs, and the remaining adjusted net income must be at least 90% of the UK Minimum Income Standard19. The statutory definition adds an extreme fuel poverty threshold: more than 10%, or 20% for extreme fuel poverty, of net income is required to pay for reasonable fuel needs after housing costs have been deducted, and the remaining household income is not enough to maintain an acceptable standard of living24. Scotland's measure is set out in section 3 of the Fuel Poverty (Targets, Definition and Strategy) (Scotland) Act19.
Wales uses a full income definition: a household is considered to be in fuel poverty if it needs to spend more than 10% of its income, including housing related benefits and net of council tax, on all household fuel use to maintain a satisfactory heating regime5. Wales also has a band below the threshold: a household needing to spend between 8 and 10% is classed as being at risk of fuel poverty5.
Northern Ireland uses the 10% indicator, where a household is fuel poor if fuel costs required to maintain a satisfactory heating regime are greater than 10% of household income5. The Northern Ireland consultation documents describe fuel poor households as those needing to pay more than 10% of their full household income to maintain a satisfactory heating regime at an affordable cost11.
The Welsh measure is sometimes referred to simply as 10% of income on fuel bills25. The Scottish figures are published through the Scottish House Condition Survey, which reports fuel poverty under the statutory definition and notes that estimates under the new definition cannot be compared with statistics published under the old definition in local authority analyses before 2016-201826.
The fuel poverty gap: £700 in England
The fuel poverty gap measures depth rather than breadth: it is the amount by which a fuel poor household's modelled energy costs fall short of what it would need to spend to reach the threshold. It answers a different question from the headline rate, which is why a nation can have a falling rate and a widening gap at the same time.
In England in 2025, the gap for households using fuels other than mains gas was £7007. A separate official figure puts the gap for households using other fuels at £730, and the two documents disagree; both are official statistics and neither has been reconciled7.
The average fuel poverty gap in England is £353 per year, the amount by which a fuel-poor household's energy bills exceed reasonable costs8. The median gap in 2024 was £1,030 before adjustment, or £770 when adjusted to 2015 prices2.
Scotland's figures show the same pattern by fuel type. In 2024, 42% of households using electricity were in fuel poverty, 27% of those using gas for heating, and 26% of those using other fuels7. Extreme fuel poverty stood at 13% of those using oil7.
The gap matters for policy because it identifies the households furthest from a tolerable position, and it is the figure that efficiency spending is meant to close. A household with a small gap may need a tariff intervention; a household with a large gap usually needs the building improved.
| Measure | England, 2025 | Scotland, 2024 |
|---|---|---|
| Households using gas | 7.9%7 | 27%7 |
| Households using electricity | 16.9%7 | 42%7 |
| Households using other fuels | 11.5%7 | 26%7 |
How the measures differ and why rates are not directly comparable
The differences are structural, not cosmetic, and they run in both directions.
England's property condition removes low-income households in efficient homes from the count. Scotland's income base, adjusted net income after housing costs, and its higher temperature standard, pull in different households from England's residual income test20. Scotland's definition is also more sensitive to fuel prices, which is why estimated fuel poverty rose substantially between 2019 and 2023 under it2. Wales's inclusion of housing related benefits and its treatment of council tax change who crosses the line5. Northern Ireland's full income basis is different again11.
The Office for National Statistics work on measurement exists precisely because these differences make naive comparison misleading17. The Welsh statistics carry an explicit warning that the 2024 modelled estimates cannot be directly compared with previous figures5. The Scottish local authority tables carry a similar note about the change of definition26.
Within nations, the pattern by tenure and payment method is consistent enough to be useful. In Scotland in 2023, overall rates of fuel poverty differed between the social sector at 61% and the private sector at 25%27. In 2021 the split was 34% social against 15% private28. Households on prepayment meters are consistently worse off: in 2021, 33% of prepayment meter households were fuel poor compared with 17% of those without28, and in 2022 the figures were 47% compared with 28%29. In 2019 the rate for households without a prepayment meter was 22%30.
The practical implication for a household is that the definition determines eligibility, not just the statistic. A home rated band C or better in England will not be counted as fuel poor and will not appear in the numbers that drive area-based support, even at a very low income2.
How many households are affected: estimates from 6 million to 13 million
The range across sources is wide because the measures differ and because some figures are estimates rather than statistics.
National Energy Action estimated there are now over six million households in fuel poverty, with energy debt at unprecedented levels9. Six million homes were estimated to be in fuel poverty in 202431. In England, around 13% of households are classified as fuel-poor32. Across the UK, the estimated number of households in fuel poverty ranges from 4.1 million to 7.5 million33.
Scotland's statutory estimate is that from January to March 2026 there will be around 800,000 fuel poor households in Scotland, 31% of all households33. The number of fuel poor households with electric primary heating is projected to fall from 140,000 to 130,000 over the same period33. For context, the 2017 Scottish fuel poverty rate was 23.7%, around 583,000 households34.
Wales's modelled estimates show the effect of the property: 59% of households in EPC bands F or G were in fuel poverty, compared with lower rates in better-rated homes5.
Where to get help: National Energy Action, Consumer Scotland and the End Fuel Poverty Coalition
National Energy Action offers advice and support to help people across England, Wales and Northern Ireland stay warm and manage energy costs10. It provides free advice about energy bills and keeping warm and safe in your home, and can also help with benefits advice and income maximisation35. The phone number is 0800 304 7159, and a British Sign Language interpreter can be requested35.
For Scotland, the statutory framework sits with the Scottish Government under section 3 of the Fuel Poverty (Targets, Definition and Strategy) (Scotland) Act, and the Scottish House Condition Survey provides the household data behind the published rates19. Consumer Scotland is the consumer body for Scotland, and the Energy Ombudsman handles unresolved complaints about suppliers across Great Britain10.
The End Fuel Poverty Coalition is a campaigning body rather than an advice service, bringing together more than 100 charities, health organisations, housing groups, trade unions and consumer bodies9. Its estimates of households in fuel poverty have varied between statements, and the figures have not been reconciled9.
Local authority routes also exist. Councils publish their own energy bill help pages, and the support available varies by area35.
Campaign positions: what the sector is asking government to change
The Fuel Poverty Strategy for England sets out the government's approach to tackling fuel poverty in England, and applies to England only36. Its aim is to deliver progress to the fuel poverty target through 6 priority outcomes36.
The criticism from the scrutiny side is that the English definition no longer captures the households that need help. The Committee on Fuel Poverty said it should be reviewed as it no longer captures the full range of households facing unaffordable bills2. The treatment of the Warm Home Discount as an efficiency improvement is a specific target of that criticism, because it reduces the numbers deemed fuel poor without improving any building2.
The measurement question is the live one. The Office for National Statistics has already published comparative work in consultation with the statistics producers17, and the Welsh and Scottish statistics carry comparability warnings5. The direction of travel in the sector is towards a measure that captures unaffordable bills rather than only the combination of low income and a poor energy rating.
For a household, the practical position is that the definition decides what support is available and what the government must report against. The rules are set out in the UK home energy regulation and policy guide, with the devolved detail in the pages on energy and buildings policy in Scotland and energy and buildings policy in Wales. Northern Ireland's arrangements sit with the Utility Regulator, and the department that owns the English statistics is covered in the page on DESNZ.
Sources36 cited
- Fuel poverty statistics, House of Commons Library, 2018
- Fuel poverty in the UK, House of Commons Library, 2025
- Energy terms explained, Ofgem, 2026
- Fuel poverty statistics, House of Commons Library, 2026
- Fuel poverty modelled estimates for Wales, October 2024, Welsh Government, 2025
- Fuel poverty, Department for Communities (Northern Ireland), 2026
- Fuel poverty statistics, House of Commons Library, 2025
- Warm Home Discount (Amendment) Regulations 2025Regulations2025), Hansard, 2025
- Helping to tackle fuel poverty through smart data, Smart DCC, 2025
- Worried about your energy bills, Energy Ombudsman, 2026
- Warm Healthy Homes Fund consultation, Department for Communities (Northern Ireland), 2026
- Tackling fuel poverty 2021 to 2035, Welsh Government, 2021
- Fuel poverty written evidence, Energy and Climate Change Committee, 2011
- Warmer Homes Scotland annual review 2016-17, Scottish Government, 2018
- Minimum standards for the private rented sector, Scottish Government, 2017
- Affordable Warmth Scheme consultation, Belfast City Council, 2017
- How fuel poverty is measured in the UK, Office for National Statistics, 2023
- Explore local statistics: fuel poverty, Office for National Statistics, 2026
- Scottish House Condition Survey local authority tables 2022-2024: fuel poverty, Scottish Government, 2026
- Fuel poverty written evidence, Energy and Climate Change Committee, 2011
- Good progress in some areas but much more needed, Climate Change Committee, 2013
- Fuel poverty, Scottish Government, 2026
- Scottish House Condition Survey 2024 key findings, Scottish Government, 2026
- Home energy efficiency, Argyll and Bute Council, 2026
- Wales fuel support scheme integrated impact assessment, Welsh Government, 2023
- Scottish House Condition Survey local authority analysis 2017-2019, Scottish Government, 2021
- Scottish House Condition Survey 2023 key findings, Scottish Government, 2023
- Scottish House Condition Survey 2021 key findings: fuel poverty, Scottish Government, 2021
- Scottish House Condition Survey 2022 key findings: fuel poverty, Scottish Government, 2022
- Tackling fuel poverty in Scotland: a strategic approach, Scottish Government, 2019
- Smarter, greener, fairer: maximising the smart meter system to tackle fuel poverty, Smart DCC, 2024
- Smart data: tackling fuel poverty, Smart DCC, 2024
- Scenario modelling on fuel bills and fuel poverty in Scotland, Scottish Government, 2026
- Warmer Homes Scotland programme annual review 2018-19, Scottish Government, 2019
- Getting help with your energy bills, Birmingham City Council, 2026
- Fuel Poverty Strategy for England, Department for Energy Security and Net Zero, 2026
 Fuel Poverty in the UKWho counts as living in fuel poverty, and why does the number change depending on where in the UK you live?
 Fuel Poverty StatisticsWhy do fuel poverty figures differ across the UK, and why is there no single number for the whole country?
 Fuel PovertyHow does Scotland decide if a household is in fuel poverty, and how many homes are affected?
 Local Fuel Poverty StatisticsHow many households in your area struggle to afford their heating?
 Fuel PovertyWhy does Northern Ireland have such a high rate of fuel poverty, and how many households are affected?
 Fuel PovertyHow the Welsh Government defines and measures fuel poverty, the latest modelled estimate of 340,000 households (25%) as at October 2024, who is most affected, and how the Tackling Fuel Poverty Plan and the Warm Homes Nest scheme are meant to bring the figure down.