
In this answer
Short answer
The headline fuel poverty rate in England is around 11% of households. In the latest estimates, around 11% of households in England were classed as fuel poor, and in England alone some 2.7 million households are trapped in fuel poverty1. The figure comes from the Low Income Low Energy Efficiency (LILEE) method, which counts a household as fuel poor only if its home has a Fuel Poverty Energy Efficiency Rating (FPEER) of band D or below and its residual income falls under the official poverty line after modelled energy costs3.
That single number hides a wide spread. The rate is not a measure of how many households struggle to pay a bill; it is a modelled count that combines income, energy cost and the physical efficiency of the home. Change any one of those and the count moves. The government has estimated that 9.0 million households in England could be classed as fuel poor in 2024 using a version of the 10% definition, almost double its level in 20211. Under the 10% definition, 34.1% of English households (8.73 million) were reported as fuel poor in 20234.
The average fuel poverty gap, the amount by which a fuel poor household's required fuel costs exceed the national median, has soared to an alarming £407, a near 60% increase since 2020 in real terms2. The aggregate gap increased by an estimated 47% between 2020 and 2023, before falling by 7% in 20241.
What the 11% figure actually measures
The England rate rests on the LILEE method, and the method is the reason the number sits where it does. A household in England is considered fuel poor if it has a Fuel Poverty Energy Efficiency Rating (FPEER) of band D or below and a residual income below the official poverty line after modelled energy costs3. Both conditions must hold. A low income household in an efficient home is not counted, and an inefficient home occupied by a household with adequate residual income is not counted either.
That produces a specific exclusion. In England, unlike in the rest of the UK, only those households in homes with lower energy efficiency (bands D-G) who fall below the poverty line after energy costs are considered fuel poor1. In 2024, 3.1 million households in England were in the lowest two income deciles but were not deemed to be fuel poor because their property had a rating of C or better1. Those households are, by income, among the poorest in the country; the definition simply does not classify them as fuel poor.
The definition has changed before. The definition in England changed in 20131. Before that, a household was considered to be in fuel poverty if it needed to spend more than 10% of its income to achieve an adequate level of warmth7. Under the earlier Low Income High Costs indicator, households in England were said to be in fuel poverty if they would have to spend more than the median amount on fuel to keep their home at a reasonable temperature, and spending that amount would put their income below the poverty line1. The 2013 change moved England from a 10% of income test to the LIHC test, and the LILEE method followed later.
The practical consequence for a household is that the England rate answers a narrow question: how many low income households live in inefficient homes. It does not answer how many households find their fuel bills unaffordable. For that, the 10% style measures are the closer guide, and they give a much larger number.
Who the England rate covers
The Fuel Poverty Strategy for England applies to England8. The sub-regional fuel poverty report also applies to England9, and the fuel poverty indicator published through the ONS explore-local-statistics service notes that it only includes data for 202410. There is no single UK fuel poverty rate, because each nation defines and measures it differently.
The contrast with the other nations is stark. In the latest estimates, around 11% of households in England were classed as fuel poor, 34% in Scotland, 14% in Wales11. Scotland's figure follows from its own statutory definition: total fuel costs necessary for the home are more than 10% of the household's adjusted net income (after housing costs)12. If more than 20% of net income is needed, the household is defined as being in extreme fuel poverty12. Wales publishes modelled estimates on a comparable 10% basis3.
Within England, the rate varies by how the home is heated, and this is where the household-level picture becomes clearer. In 2025, an estimated 7.9% of households with gas central heating were defined as being in fuel poverty, compared with 16.9% that used electricity, 16.2% that used oil and 11.5% that used other fuels5. Households with oil-fired heating carried an estimated fuel poverty gap of around £7005.
| Heating fuel | Fuel poverty rate, England 2025 |
|---|---|
| Mains gas central heating | 7.9%5 |
| Electricity | 16.9%5 |
| Heating oil | 16.2%5 |
| Other fuels (LPG, community heating, solid fuel) | 11.5%5 |
Off the gas grid, the rate roughly doubles. That is the dependence the statistic exposes: a household that cannot connect to mains gas is exposed to a fuel whose price it cannot hedge, and the modelled gap for oil heating, around £700, is well above the England average of £4072.
Conditions, exclusions and the statutory target
The statutory fuel poverty target for England is to improve as many fuel poor homes as is reasonably practicable to achieve a minimum energy efficiency rating of Band C by 20306. That target is about the fabric of the home, not the bill. It commits government to raising the efficiency of the homes it has already counted as fuel poor, rather than to reducing the number of households in fuel poverty by income.
An earlier target has closed. The statutory target was for the eradication of fuel poverty, as far as reasonably practicable, in vulnerable households, with a target that by 22 November 2016, as far as is reasonably practicable, no person in England should have to live in fuel poverty7. That date has passed.
The Fuel Poverty Strategy for England sets out the government's approach to tackling fuel poverty in England, and its aim is to deliver progress to the fuel poverty target through 6 priority outcomes8. Separately, the Labour Warm Homes Plan commitment is to ensure fuel poor homes in England are brought up to a reasonable standard of energy efficiency by the end of this decade13.
The conditions matter for anyone reading the number as a measure of hardship. The LILEE method excludes homes rated band C or better, which removed 3.1 million low income households from the count in 20241. It also depends on modelled energy costs rather than actual bills, so a household that underheats its home to keep the bill down is still modelled at the cost of adequate warmth.
How the England rate is produced
The England rate is produced by the Department for Energy Security and Net Zero, and the sub-regional report carries the status of Official Statistics9. The method combines three inputs: the energy efficiency of the dwelling, expressed as a Fuel Poverty Energy Efficiency Rating; the modelled cost of heating that dwelling to an adequate standard; and household income after housing and energy costs.
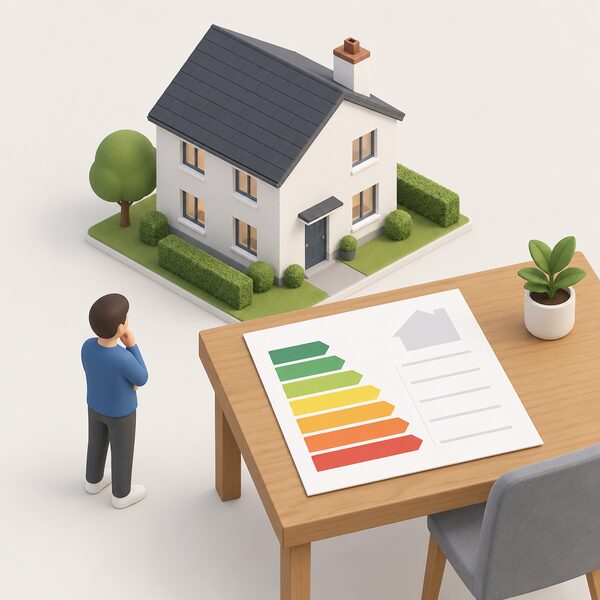
A household in England is considered fuel poor if it has a Fuel Poverty Energy Efficiency Rating (FPEER) of band D or below and a residual income below the official poverty line after modelled energy costs3. The FPEER band is the gate. Homes at band C or above are excluded from the count regardless of income, which is why the England rate sits below the rates produced by 10% of income definitions.
The modelled nature of the figure is the main caveat. The government has estimated that 9.0 million households in England could be classed as fuel poor in 2024 using a version of the 10% definition, almost double its level in 20211. That estimate uses the same underlying data as the 11% figure but a different threshold, and the two are not in competition: they answer different questions.
For a household, the useful reading is that the England rate tracks the intersection of low income and poor housing stock. It is a housing and income statistic, and it moves when the housing stock improves or when energy prices shift the modelled cost of adequate warmth. The fuel poverty statistics page sets out how the numbers are produced in more detail, and the local fuel poverty statistics page covers how the England figure breaks down by area.
Where the England rate has been
The rate has been remarkably stable over the long run, which is itself informative. Over the past decade fuel poverty rates have remained in the 10 to 12% range, increasing to a peak of 11.9% in 2009 before falling to 10.5% in 2013 and 2014 before rising again in 201614. In 2016 an estimated 2.55 million households in England were defined as fuel poor, which was 11.1% of households14.
Earlier data points show the same band. 10.4% of all households in England (2.35 million households) were in fuel poverty in 2013 using the LIHC definition1. In 2018 around one in ten households in Leeds were living in fuel poverty (10%), the same as the average for England15. In 2017, 10.9% of households in England were in fuel poverty16.
The stability is a feature of the definition as much as of the underlying conditions. Because the LILEE method ties the count to the energy efficiency of the dwelling and to income relative to the poverty line, it moves slowly. A sharp rise in prices raises the modelled cost of adequate warmth, but it also raises the median against which the fuel poverty gap is measured, and the two effects partly offset.
The gap, by contrast, has moved sharply. The average fuel poverty gap has soared to an alarming £407, a near 60% increase since 2020 in real terms2. The aggregate gap increased by an estimated 47% between 2020 and 2023, before falling by 7% in 20241. The 'fuel poverty gap' has grown by 66% since 202013. Both are stated here as published.
What the rate means for a household's independence
The England rate is a measure of dependence as much as of poverty. A household counted as fuel poor is, by definition, in a home that is inefficient enough to need more energy than it should to reach an adequate temperature, and on an income that leaves too little after housing and energy costs. The two together describe a household with little room to absorb a price rise and little control over the cost of keeping warm.
The fuel-by-fuel breakdown shows where that dependence bites hardest. Households on mains gas had a fuel poverty rate of 7.9% in 2025, while those using electricity were at 16.9% and those using oil at 16.2%5. A household off the gas grid is exposed to a fuel it buys in batches, at a price it cannot fix on a standard tariff, and the estimated fuel poverty gap for oil-fired heating, around £700, reflects that5.
The statutory target addresses the fabric rather than the fuel: improve as many fuel poor homes as is reasonably practicable to achieve a minimum energy efficiency rating of Band C by 20306. Raising the efficiency of a dwelling reduces the modelled cost of adequate warmth, which is the mechanism by which the target is meant to work. It does not change the household's income, and it does not change the price of the fuel.
For the wider picture of how the England rate sits alongside prices, consumption and deployment data, the UK home energy statistics pillar is the starting point. The energy debt and arrears statistics page covers the arrears side, which the fuel poverty rate does not measure, and the EPC statistics page covers the efficiency bands that gate the England count.
Sources16 cited
- Fuel poverty in England, House of Commons Library, 2025
- Warm Home Discount (Amendment) Regulations 2025Regulations2025), UK Parliament Hansard, 2025-09-03
- Fuel poverty modelled estimates for Wales, Welsh Government, 2024-10
- Energy statistics, Uswitch, 2024
- Fuel poverty statistics research briefing, House of Commons Library, 2025
- Equality impact assessment for the Heat and Buildings Strategy, Department for Energy Security and Net Zero, 2023-03-01
- Fuel poverty, Energy and Climate Change Committee, 2011-12
- Fuel Poverty Strategy for England, Department for Energy Security and Net Zero, 2026-01-21
- Sub-regional fuel poverty report 2025, Department for Energy Security and Net Zero, 2025-04-30
- Fuel poverty indicator, Office for National Statistics, 2026-09-20
- Join the conversation on fuel poverty, Institution of Gas Engineers and Managers, 2025-11
- Tackling fuel poverty in Scotland, Scottish Government, 2021-12
- Fuel poverty in England 2024, National Energy Action, 2024
- Fuel poverty statistics, House of Commons Library, 2016
- Retrofitting energy efficiency in buildings, Leeds City Council, 2018
- Citizens Advice submission to Ofgem on half-hourly settlement, Citizens Advice, 2017
 Fuel Poverty in the UKWho counts as living in fuel poverty, and why does the number change depending on where in the UK you live?
 Local Fuel Poverty StatisticsHow many households in your area struggle to afford their heating?
 Fuel Poverty PolicyWhy does fuel poverty mean something different depending on where in the UK you live?
 Fuel PovertyHow does Scotland decide if a household is in fuel poverty, and how many homes are affected?
 Fuel PovertyHow the Welsh Government defines and measures fuel poverty, the latest modelled estimate of 340,000 households (25%) as at October 2024, who is most affected, and how the Tackling Fuel Poverty Plan and the Warm Homes Nest scheme are meant to bring the figure down.
 Fuel PovertyWhy does Northern Ireland have such a high rate of fuel poverty, and how many households are affected?