

In this answer
Short answer
Around 340,000 households in Wales, 25% of the total, were in fuel poverty as at October 2024, and 63,000 of them (5%) were in severe fuel poverty1. Tenure shapes who those households are. The private rented sector has the highest rate of any tenure at 30%, against 24% for owner occupiers, but owner occupiers are 69% of Welsh tenure and the private rented sector only 13%, so the largest single group of fuel-poor households still sits in owner occupation1.
The mechanism behind the tenure gap is the age and condition of the stock. The private rented sector has the oldest stock and the highest proportion of poor quality housing in Wales, with 43% of stock pre-1919, and 76% of its dwellings are free from Category 1 HHSRS hazards against 82% of all dwellings2. Households in pre-1919 dwellings were fuel poor at 33%, compared with 14% in post-1980 properties1.
What this means for a household's energy independence is straightforward. A renter cannot decide to insulate a solid wall, replace a boiler or fit solar, because the building is not theirs and the payback accrues to the owner. An owner occupier can act, but in Wales' older stock the cost of doing so is highest exactly where the need is greatest. The dependence that remains is on the grid, on a supplier, and, in the private rented sector, on a landlord's willingness to invest.
Fuel poverty in Wales: the headline numbers
The Welsh Government's modelled estimates for October 2024 put around 340,000 households (25%) in fuel poverty, including 63,000 (5%) in severe fuel poverty, with a further 215,000 households (16%) at risk1. The same 340,000 figure was restated in a Welsh Government written statement in February 20263. Within lower income households the rate is far higher: around 195,000 lower income households (83%) were in fuel poverty, with 56,000 (24%) in severe fuel poverty1. Vulnerable households, a category covering those with children, older people and people with a disability or long-term illness, numbered around 304,000 (26%) in fuel poverty, 46,000 (4%) of them severely so1.
The definition matters when comparing these figures with older ones. In Wales, fuel poor households are those needing to pay more than 10% of their full household income to maintain a satisfactory heating regime, and those paying more than 20% are considered to be in severe fuel poverty4. That is a different threshold from the one used in England, where a household would have to spend more than 10% of its income on maintaining a satisfactory heating regime after housing costs, and it is why Welsh and English headline rates are not directly comparable5. Older Welsh figures used the same 10% income test but produced a much lower count: 12% of all households in 2018, and 14% of households in a 2025 restatement of the older series6. The rise to 25% reflects both the income test and the energy price period the 2024 model covers, not a change in the definition alone.
How tenure splits across Wales' 1.4 million homes

Wales has 1.4 million homes8. Owner occupiers account for 69% of tenure and the private rented sector 13%, with the remainder in social housing2. That distribution explains why a tenure with a below-average fuel poverty rate can still hold the largest number of fuel-poor households: 24% of a 69% share is a much bigger count than 30% of a 13% share1.
| Tenure | Share of Welsh tenure | Fuel poverty rate |
|---|---|---|
| Owner occupiers | 69% | 24% |
| Private rented sector | 13% | 30% |
| All households | 100% | 25% |
Rates are from the October 2024 modelled estimates; tenure shares are the Welsh Government's own figures1.
The pattern is not unique to Wales, and the comparison is useful because it shows how much of the Welsh position is about tenure and how much about the wider housing stock. In Scotland, 37% of private rented sector households were fuel poor in 2024, and scenario modelling for October to December 2026 estimates 39% of private rented sector households and 22% of owner-occupied households in fuel poverty9. Energy UK's polling found almost one in four private renters in fuel poverty compared with 9% of owner occupiers11. The direction is consistent across the UK: renting privately raises the risk, and owning reduces it, but does not remove it.
Private rented sector: the oldest, poorest quality stock
The private rented sector in Wales has the oldest stock and the highest proportion of poor quality housing, with 43% of stock pre-19192. Its fuel poverty rate of 30% is the highest of any tenure in the Welsh figures1. Citizens Advice found that nearly half of private renters in Wales (49%) are struggling to pay their energy bills12.
The quality gap shows up in the hazard data. Across Wales, 82% of dwellings are free from Category 1 HHSRS hazards, but only 76% of private rented sector dwellings are2. Category 1 hazards are the most serious risks to health and safety that a local authority can require a landlord to address, so the six percentage point gap is a measure of how much more often private renters live with a serious defect.
The structural problem is the split incentive. The private rental sector has high levels of fuel poverty and presents particular challenges due to the split incentives between landlords and tenants13. A landlord who pays for insulation does not receive the saving; a tenant who pays the bill cannot authorise the work. That is why the sector's poor quality persists even where grant funding exists, and why the Welsh Government's own decarbonisation analysis treats private housing as the difficult part of the stock8.
"The private rental sector has high levels of fuel poverty and presents particular challenges due to the split incentives between landlords and tenants"

Owner occupiers: the largest group, but not the most exposed
Owner occupiers in Wales had a fuel poverty rate of 24%, below the all-household figure of 25% and well below the private rented sector's 30%1. Because owner occupiers are 69% of tenure, they still account for the largest number of fuel-poor households in absolute terms1.
Ownership gives a household something a renter does not have: the ability to decide. Insulation, glazing, heating replacement and microgeneration are all within an owner's gift, subject to planning and building rules, and the payback stays with the person who paid. That is the energy independence advantage of ownership, and it is real. It is also limited by the building. A solid-walled pre-1919 terrace is expensive to improve whoever owns it, and the Welsh figures show the consequence: 33% of households in pre-1919 dwellings were fuel poor, against 14% in post-1980 properties1.
The comparison with Scotland is instructive on the limits of ownership as a protection. In Scotland, 9% of those with a mortgage and 14% of those who own outright were assessed as fuel poor, and owner occupiers were less likely to use electricity as their primary fuel at 8%, while oil was the primary heating fuel in 7% of owner-occupied dwellings14. Ownership lowers the rate but does not eliminate exposure, particularly where the home is off the gas grid or the household income is low.
Housing quality and HHSRS hazards by tenure
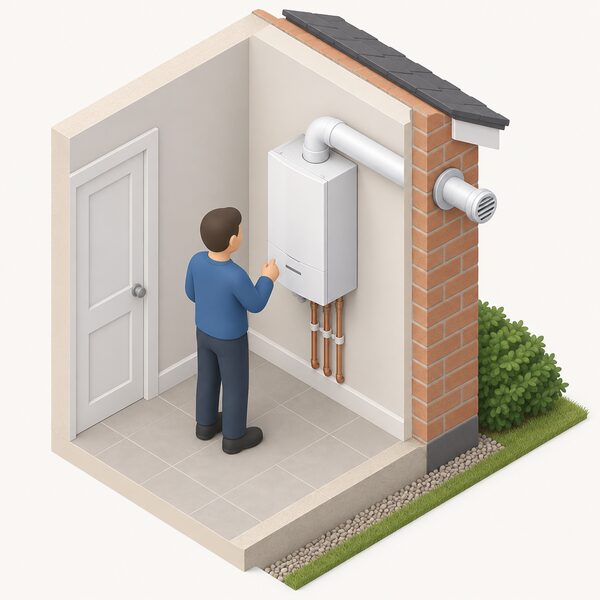
Housing quality and fuel poverty overlap but are not the same measurement. The HHSRS figures describe physical risk; the fuel poverty figures describe the cost of warmth relative to income. Wales scores reasonably on the first and poorly on the second.
| Measure | All Welsh dwellings | Private rented sector |
|---|---|---|
| Free from Category 1 HHSRS hazards | 82% | 76% |
| Pre-1919 stock | Not stated for all dwellings | 43% |
| Fuel poverty rate | 25% | 30% |
Sources: Welsh Government scheme rules and October 2024 modelled estimates2.
The heating fuel a household uses also drives the rate. In Wales, an estimated 22% of households using mains gas for heating were classed as fuel poor, against 30% of those using other types of fuel5. Older Welsh data from 2008 shows how wide that spread can be: 21.0% for mains gas, 53.2% for LPG and bottled gas, 46.8% for heating oil, 48.3% for solid fuel, 39.7% for electric heating and 5.0% for communal heating16. Those 2008 figures are not comparable with the current modelled estimates, but the ordering, gas cheapest and off-gas fuels dearest, has been consistent.
Households without central heating are the most exposed group of all: more than half of households living in dwellings without central heating (59%) were fuel poor1. Rural households were fuel poor at 26% against 24% in urban areas, a small gap that understates the problem because rural homes are more likely to be off the gas grid1.
Why Wales' pre-1919 housing makes fuel poverty harder to fix
Age is the single strongest dwelling characteristic in the Welsh figures. Households in pre-1919 dwellings were fuel poor at 33%, compared with 14% in post-1980 properties1. Households in dwellings with solid walls were more likely to be fuel poor (33%) than those in dwellings with cavity walls, with the detailed section of the same release putting the solid wall figure at 32%1. The two figures come from the same publication and differ by a percentage point between its summary and detailed sections.
The reason is physical. A solid wall cannot be filled from the outside in the way a cavity can, so the improvement options are external or internal insulation, both disruptive and both costly. A pre-1919 terrace also tends to have suspended timber floors, original windows and a heating system sized for a leakier building. Each measure is individually justifiable and collectively expensive, which is why the Welsh Government's own decarbonisation analysis describes the challenge in terms of the whole stock rather than individual measures6.
The Welsh Government has itself acknowledged the scale: despite numerous energy efficiency initiatives, almost a quarter of Welsh households experience fuel poverty6. Earlier statements put the same point in household numbers, noting that 155,000 homes continued to experience fuel poverty even after the estimated level had halved since 200817. The 2018 figures recorded 12% of all households in fuel poverty, with 19,000 vulnerable households in severe fuel poverty, equivalent to 2% of vulnerable households6.
For a household, the practical implication is that the tenure you hold and the age of the building you hold it in together determine how much of your energy future you control. An owner occupier in a post-1980 home has the widest set of options and the lowest risk. A private renter in a pre-1919 terrace has the narrowest, and the split incentive means the decision sits with someone else. The dependence that remains in every case is on the grid and on a supplier; what tenure changes is whether the household can reduce how much of either it needs.
Sources18 cited
- Fuel poverty modelled estimates for Wales: October 2024, Welsh Government, 2024
- Private sector housing renewal and adaptations, Swansea Council, 2026
- Written statement on fuel poverty, Welsh Government, 2026
- New Warm Homes Programme integrated impact assessment, Welsh Government, 2024
- Fuel poverty in the UK, House of Commons Library, 2025
- Homes of today for tomorrow: decarbonising Welsh housing between 2020 and 2050, Welsh Government, 2024
- Fuel poverty modelled estimates for Wales: October 2024, Welsh Government, 2025
- Decarbonising private housing: the net zero elephant in the energy inefficient room, Senedd Research, 2026
- Scottish House Condition Survey 2024: key findings, Scottish Government, 2026
- Fuel poverty scenario modelling based on Ofgem energy price caps to October to December 2026, Scottish Government, 2026
- Energy Efficiency Week 2024 polling report, Energy UK, 2024
- Delivering warmer homes for private renters in Wales, Citizens Advice, 2025
- Understanding barriers to heat pump uptake in the private rental sector, Nesta, 2024
- Scottish House Condition Survey 2021: fuel poverty, Scottish Government, 2021
- Scottish House Condition Survey 2023: key attributes of the Scottish housing stock, Scottish Government, 2023
- Fuel poverty by heating fuel, Wales 2008, UK Parliament, 2008
- Fuel poverty estimates for Wales 2018, Welsh Government, 2018
- Outcome summary: tackling fuel poverty 2020 to 2035, Welsh Government, 2021
 Fuel Poverty in the UKWho counts as living in fuel poverty, and why does the number change depending on where in the UK you live?
 UK Private Rented SectorHow many homes in the UK are rented privately, and how do they compare with homes people own or rent from a council or housing association?
 Fuel PovertyHow the Welsh Government defines and measures fuel poverty, the latest modelled estimate of 340,000 households (25%) as at October 2024, who is most affected, and how the Tackling Fuel Poverty Plan and the Warm Homes Nest scheme are meant to bring the figure down.
 Insulation in Rented HousingWho pays for insulation when you rent, and who has to agree to it?
 Energy Policy in WalesWhat help can you get in Wales to make your home warmer and cheaper to run?
 Fuel PovertyWhy does Northern Ireland have such a high rate of fuel poverty, and how many households are affected?