In this guide
Fuel poverty is the inability of a household to heat and power its home adequately1. In the UK it is not one number but four, because each nation sets its own definition and publishes its own statistics. As of July 2024, approximately 5.6 million households were in fuel poverty in the UK2. In England, around 11% of households were classed as fuel poor in the latest estimates3, and an estimated 13% of households, some 3.17 million, were living in fuel poverty in 2023 under the Low Income Low Energy Efficiency metric4.
The measure matters as much as the count. England uses the Low Income Low Energy Efficiency method, Northern Ireland uses the 10 per cent indicator, and Scotland and Wales publish their own modelled estimates5. The Office for National Statistics has described the differences and similarities in how the UK measures deal with the main influences of fuel poverty: energy efficiency, household income and energy prices6.
What follows sets out the definitions, the published rates and gaps, the household and property characteristics associated with fuel poverty, and the support routes that exist. It is a description of the rules and the evidence, not advice on any individual household's position.
What fuel poverty means and how it is defined
Fuel poverty is affected by three key factors: a household's income, its fuel costs, and its energy consumption8. In general, it relates to households that must spend a high proportion of their household income to keep their home at a reasonable temperature3. The Northern Ireland consultation states it most simply: fuel poverty is the inability of a household to heat and power their home adequately1.
The original UK-wide definition was a ratio test. A household was defined as being in fuel poverty if it would have to spend more than 10% of its income to keep the home at a reasonable temperature, and that definition still applies in Scotland, Wales and Northern Ireland9. Ofgem's glossary describes the same threshold: households who need to spend more than 10 per cent of their annual income on fuel to maintain an adequately heated home1.
England moved away from the ratio test. Households in England are now said to be in fuel poverty if they would have to spend more than the median amount on fuel to keep their home at a reasonable temperature, and spending that amount would put their income below the poverty line, the Low Income High Costs indicator9. The current England test is narrower still: a household is considered fuel poor if it has a Fuel Poverty Energy Efficiency Rating of band D or below and a residual income below the official poverty line after modelled energy costs5.
That combination is why England, unlike the rest of the UK, counts only households in homes with lower energy efficiency, bands D to G, who fall below the poverty line after energy costs3. A low-income household in an efficient home is not counted in England, however high its bills. A household on a modest income in a leaky home is not counted either, unless its residual income falls below the poverty line.
For a household's energy independence, the definition carries a message: the measure is built on the fabric of the home as much as on the bill. Improving the building moves a household out of the England count in a way that a one-off payment does not.
How many UK households are in fuel poverty: around 5.6 million
The headline UK figure is approximately 5.6 million households in fuel poverty as of July 20242. That is a snapshot across four different national measures added together, so it should be read as an order of magnitude rather than a single consistent count.
The England series shows how much the number moves with the measure and the year. In 2009, there were 4 million households in England living in fuel poverty10. By 2011 that had fallen to 2.4 million11, and by 2013, under the Low Income High Costs definition, 10.4% of all households in England, 2.35 million, were fuel poor9. An estimated 2.5 million English households, 11%, were in fuel poverty on 2015 data12, and 11.1% of households in 20168. Over the decade to 2016, fuel poverty rates remained in the 10 to 12% range8.
More recent figures sit higher. Fuel poverty affected 2.36 million households in England in 202513, and in England around 13% of households are classified as fuel-poor14. In England alone, some 2.7 million households are trapped in fuel poverty8. An independent estimate put 6.3 million households in fuel poverty, with millions more at risk9.
The spread between these numbers is not a contradiction so much as a consequence of definition, vintage and geography. A ratio measure counts more households than a measure that also requires a low income and a poor rating. A year with high prices counts more than a year with low ones. Where the figures differ, both stand: the England gap is given as £700 for households using other fuels in one official statistics release and £230 in another, and that conflict is unresolved10.
The Low Income Low Energy Efficiency measure used in England
Fuel poverty in England is measured by the Department for Energy Security and Net Zero using the Low Income Low Energy Efficiency method5. It has two limbs, and a household must satisfy both.
The first is the home. The dwelling must have a Fuel Poverty Energy Efficiency Rating of band D or below5. This is a modelled rating, not the Energy Performance Certificate itself, though the two track closely.
The second is the household's finances. After modelled energy costs are deducted, residual income must fall below the official poverty line5. A household whose income is low before energy costs but adequate after them is not counted. A household in a band D or worse home with a comfortable income is not counted either.
The effect is a measure that deliberately targets the overlap of low income and poor housing. Under it, an estimated 13% of households, 3.17 million, were living in fuel poverty in England in 20234. The latest estimates put around 11% of households in England in fuel poverty3.
The measure also shapes who appears in the statistics. Because the rating is a condition, households in efficient homes are invisible to it even when their bills are high relative to income. That is a deliberate design choice: the England measure is intended to identify homes where an energy efficiency intervention would change the household's position, rather than to count every household under financial pressure from energy costs.
For a household's independence, the practical consequence is that the route out of the England count runs through the fabric of the building. Insulation, glazing and heating efficiency raise the rating; a change in income alone may not. The measure therefore aligns the official definition of fuel poverty with the physical work of retrofit, which is also the work that reduces reliance on bought energy.
The fuel poverty gap: £407 and what it measures
The fuel poverty gap measures depth rather than breadth. It is the difference between what a fuel-poor household actually spends on energy and what it would need to spend to reach an adequate heating regime, so it answers how far short a household falls, not how many households fall short.
In England the average fuel poverty gap has soared to £407, a near 60% increase since 2020 in real terms5. The gap varies sharply by heating fuel. Households using other fuels face a gap of £700, against £230 for the group the same release compares them with, and the two figures are not reconciled10.
Scotland publishes its own gap series, and it is larger. The actual median fuel poverty gap for fuel poor households in 2022 was £1,24015, up from £690 in 202116. Fuel poor households using electricity as their primary heating fuel have a significantly higher median fuel poverty gap, around £2,000 per year, in modelling covering January to March 202617. The Scottish House Condition Survey reports a median fuel poverty gap of £1,030 in 2024, and £770 when adjusted to 2015 prices14.
The two Scottish figures illustrate why the adjustment matters. The £1,030 is the actual amount; the £770 is the same figure expressed in 2015 prices, so it can be compared with earlier years without the effect of inflation. Both are correct, and they answer different questions.
A large gap means a household is not marginally short but substantially short, and that a modest improvement in the home or the tariff will not close it. A small gap means the household is close to the threshold and may move in or out of fuel poverty with prices or a single measure. For energy independence, the gap is the more useful number of the two: it indicates how much bought energy a household would need to displace, through fabric or generation, to reach an adequate standard.
Who is most affected: low incomes, long-term illness and off-gas-grid homes
Fuel poverty concentrates where low income meets poor housing, and the property characteristics are as predictive as the household ones.
The clearest split is the gas grid. Of households living in properties not on the gas grid, 20.1% are fuel poor compared to 12.3% on the gas grid13. In Scotland, rates of extreme fuel poverty for households outwith coverage of the gas network were 14%, higher than the 9% for households within it16. The Scottish House Condition Survey puts extreme fuel poverty at 23% in properties off the gas grid against 13% on it14.
Heating fuel follows the same pattern. In England in 2025, an estimated 7.9% of households with gas central heating were defined as being in fuel poverty, against 11.5% that used other fuels such as LPG, community heating or solid fuels, and 16.2% that used oil18. Households burning oil, in other words, are roughly twice as likely to be fuel poor as households on mains gas.
Energy efficiency is the other strong predictor. In Scotland, 36% of households living in dwellings rated EPC band E were fuel poor, compared to 26% of households living in dwellings rated EPC band C or better14. The Scottish consultation on private rented sector regulations gives the same comparison as 48% against 32%19. The pattern is consistent: the worse the rating, the higher the rate.
Income and efficiency interact. Where 58% of those who are not income poor but live in the least energy efficient properties are in fuel poverty, 94% of those who are income poor and live in EPC D homes are20. Neither condition alone explains the outcome.
There is a regional dimension in England. Households in fuel poverty are disproportionately found in the north of England, one million homes, and the East Midlands, and those regions have the highest proportion of homes below the Government's EPC target21. The Committee on Climate Change has assessed that the policies needed to drive improvements in energy efficiency in homes that are not fuel poor are currently inadequate22.
For independence, the off-gas-grid finding is the sharpest. A household without a mains gas connection is buying delivered fuel at a price it cannot influence, from a supplier it can change only by changing tank or contract, and it faces the highest rates of fuel poverty in the country. Fabric improvements and a change of heating fuel are the levers available; neither is quick.
Children in fuel poverty: 5.1 million in England
Children are counted within the household figures rather than separately in the official statistics, and the England total is the one most often quoted. In England alone, some 2.7 million households are trapped in fuel poverty8, and the England rate under the Low Income Low Energy Efficiency measure was an estimated 13% of households, 3.17 million, in 20234.
The statutory target in England is framed around vulnerable households, defined as the elderly, families with young children and the long term sick and disabled23. That is the group the legislation singles out, and it is the group the Warm Home Discount and similar schemes are designed to reach.
The practical consequences for children are the reason the target exists. Cold homes and the health effects that follow are covered in more detail on cold homes and health, and the support routes for households with medical needs are set out on vulnerable and medically dependent households.
For a household with children, the independence question is usually about control rather than generation. A family in a band E home on a prepayment meter has little ability to shift when it buys energy or how much it uses, because the fabric sets the floor. The measures that change that are the same ones the England definition rewards: insulation, glazing, draught-proofing and an efficient heating system.
Why the four nations measure fuel poverty differently
Fuel poverty is devolved, and each administration has set its own definition, its own statistics and its own targets. The Office for National Statistics has published an article using published data to explore the differences and similarities in how the UK measures deal with the main influences of fuel poverty: energy efficiency, household income and energy prices6.
The definitions in use are:
| Nation | Measure | Basis |
|---|---|---|
| England | Low Income Low Energy Efficiency | FPEER band D or below, and residual income below the poverty line after modelled energy costs5 |
| Northern Ireland | 10% indicator | Fuel costs to maintain a satisfactory heating regime greater than 10% of household income5 |
| Scotland | Own modelled estimates | Published by the Scottish Government, with its own gap series15 |
| Wales | Own modelled estimates | Published by the Welsh Government5 |
The original 10% definition still applies in Scotland, Wales and Northern Ireland9. Northern Ireland's consultation states the principle plainly: fuel poverty is the inability of a household to heat and power their home adequately1.
The consequence is that a household with identical income, bills and building could be counted as fuel poor in Belfast and not in Birmingham, or the reverse. The England measure excludes households in efficient homes regardless of income; the 10% measure excludes households whose fuel costs are a small share of a large income, regardless of the building.
Scotland gathers its evidence through the Scottish Household Survey, which provides robust evidence on the characteristics, attitudes and behaviour of private households and individuals, as well as on the physical condition of Scotland's homes24. A random sample of addresses in Scotland is invited to take part every year, to make sure the results are representative of everyone in Scotland, not just certain groups of people24. The survey covers housing, neighbourhoods, finances, internet, physical activity, local services, environment, volunteering, culture and childcare24.
For a household, the practical point is that the label depends on where it lives. The underlying conditions, a cold home and a bill that strains the income, do not.
The role of the EPC in identifying inefficient homes
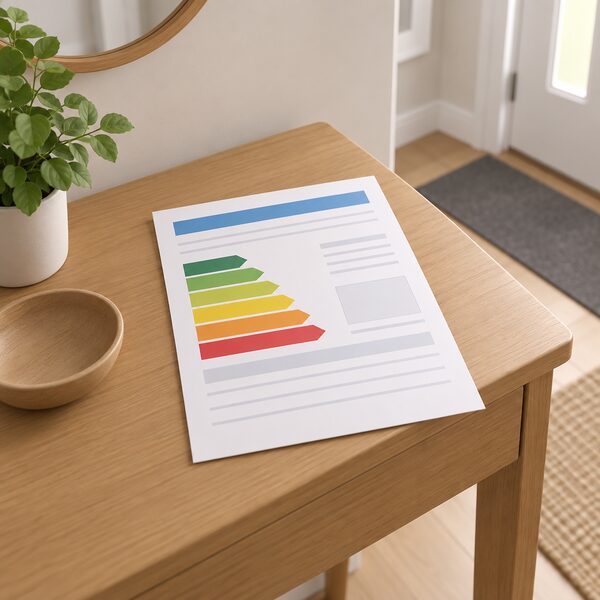
The Energy Performance Certificate is the main instrument for identifying the homes where fuel poverty concentrates, and it is embedded in policy in two ways.
First, it is a target. Government policy includes upgrading fuel poor homes in England to EPC band C "where reasonably practicable"21. In Scotland, the Heat and Buildings Strategy sets out maximising the number of homes with households in fuel poverty achieving a level of energy efficiency equivalent to EPC C by 2030, and EPC B by 204025.
Second, it is a diagnostic. The rates by band are steep: 36% of households living in dwellings rated EPC band E were fuel poor, against 26% in dwellings rated EPC band C or better14. In Scotland the equivalent comparison is 48% against 32%19. The rating is not a perfect proxy for the household's finances, but it is a reliable indicator of the building's contribution to the problem.
The England measure uses a Fuel Poverty Energy Efficiency Rating rather than the EPC itself5. The two are closely related, but the FPEER is calculated for the purposes of the fuel poverty statistics, so a household checking its own EPC is looking at a near neighbour of the official rating rather than the exact figure.
The EPC regime is changing. The Energy Performance of Buildings regime reforms will replace the single efficiency score with four headline metrics from the second half of 202726. That will change how homes are described, though the direction of policy, towards better-performing homes, is unchanged.
For a household's independence, the EPC is the document that determines which grants and obligations apply. It is also the document that tells a household where its heat is going. A low rating is not a moral failing; it is a description of the building, and it is the part of the fuel poverty equation a household can act on.
Targets, campaigns and where support is available
The statutory target in England is for the eradication of fuel poverty, as far as reasonably practicable, in vulnerable households, defined as the elderly, families with young children and the long term sick and disabled23. The Energy Company Obligation supports energy efficiency measures in the homes of those considered to be in fuel poverty, and domestic households in Great Britain are eligible27.
Support is delivered differently in each nation, and the routes below are the published ones.
- England, Wales and Northern Ireland: National Energy Action offers advice and support to help people across England, Wales and Northern Ireland stay warm and manage energy costs, on 0800 304 715928. It provides free advice about energy bills and keeping warm and safe in your home, and can also help with benefits advice and income maximisation29. A British Sign Language interpreter can be requested29.
- Northern Ireland: NI Energy Advice provides free advice on saving energy in your home, energy efficiency grants, and oil buying clubs30. Belfast City Council also publishes cost-of-living and winter support information30.
- England, grants: the Warm Homes: Local Grant is open to low-income households living in the worst quality, privately owned homes, and to all fuel types, including on-gas-grid and off-gas-grid households31. Home Upgrade Grants focused on the worst-quality off-gas-grid homes with low income households in England32.
- Scotland: the Scottish Household Survey publishes the evidence base, and Home Energy Scotland runs free online energy saving webinars24.
- England, statistics: Fuel Poverty in England: sub-regional is published as Official Statistics and was updated on 14 May 202633.
The Energy Ombudsman provides advice for consumers worried about their energy bills28, and Birmingham City Council publishes a getting help with your energy bills page as an example of local authority signposting29.
For a household's energy independence, the support landscape is a partial substitute for the thing that would remove the problem: a home that does not need so much bought energy. Grants and advice reduce the bill; fabric and generation reduce the dependence. The two are complementary, and the published evidence on the fuel poverty gap suggests that for the households furthest short, only the second changes the position durably.
Sources33 cited
- Energy terms explained, Ofgem, 2026
- Final CVS 15042025, Ofgem, 2025-04
- Fuel poverty statistics, House of Commons Library, 2025-04
- Energy security and net zero Committee report, UK Parliament, 2023
- Fuel poverty modelled estimates for Wales, Welsh Government, 2025-10-16
- How fuel poverty is measured in the UK, Office for National Statistics, 2023-03
- Warm Home Discount (Amendment) Regulations 2025Regulations2025), Hansard, 2025-09-03
- Fuel poverty statistics briefing, House of Commons Library, 2016
- Fuel poverty research briefing, House of Commons Library, 2026-09-17
- Fuel poverty inquiry evidence, UK Parliament, 2009
- Fuel poverty inquiry evidence, Scottish Government, 2011
- Vulnerability report 2018, Ofgem, 2015
- Great British Insulation Scheme government response, UK Government, 2023-03
- Scottish House Condition Survey 2024 key findings, Scottish Government, 2026-02
- Scottish House Condition Survey 2022 key findings, Scottish Government, 2022
- Scottish House Condition Survey 2021 key findings, Scottish Government, 2021
- Scenario modelling on fuel poverty in Scotland, Scottish Government, 2026
- Fuel poverty statistics, House of Commons Library, 2025
- Energy efficiency domestic private rented property regulations, Scottish Government, 2025-06-06
- Scotland without fuel poverty, Scottish Government, 2016-10-24
- Fuel poverty and energy efficiency, House of Commons Library, 2022-03
- Taking stock of the UK Government's heat and buildings strategy, Climate Change Committee, 2022-03-09
- Fuel poverty inquiry evidence, UK Parliament, 2026-09-20
- Scottish Household Survey, Scottish Government, 2026-09-17
- Heat and buildings strategy fairer Scotland duty assessment, Scottish Government, 2030
- EPC C meaning, Chameleon Technology, 2027-07
- Heat pump deployment quarterly statistics, UK Government, 2025-09-04
- Worried about your energy bills, Energy Ombudsman, 2026-03-24
- Getting help with your energy bills, Birmingham City Council, 2026-06-24
- Cost of living and winter support, Belfast City Council, 2026-09-20
- Heat pump deployment tables Q2 2026, UK Government, 2026-09-10
- Home Upgrade Grants, UK Parliament, 2021-03-22
- Fuel Poverty in England: sub-regional, data.gov.uk, 2026-05-14
 Local Fuel Poverty StatisticsHow many households in your area struggle to afford their heating?
 Fuel Poverty PolicyWhy does fuel poverty mean something different depending on where in the UK you live?
 Fuel Poverty StatisticsWhy do fuel poverty figures differ across the UK, and why is there no single number for the whole country?
 Fuel PovertyWhy does Northern Ireland have such a high rate of fuel poverty, and how many households are affected?
 The Full Statistics GuideHow many homes in the UK have solar panels, heat pumps or batteries?
 Fuel PovertyHow does Scotland decide if a household is in fuel poverty, and how many homes are affected?