
In this comparison
Fuel poverty in Scotland tracks the energy performance of the home closely, and the published band breakdown makes the relationship plain. In the Scottish House Condition Survey 2023, 32% of households living in dwellings rated EPC band C or better were fuel poor, against 48% of those in bands F or G1. The 2022 survey gave 27% against 41%2. The 2021 survey gave 16% against 43%3. Every year published shows the same direction: the worse the band, the higher the rate.
The absolute levels move with energy prices and incomes rather than with the housing stock alone. The 2022 survey estimated 791,000 households, 31% of all households, in fuel poverty4. The 2023 survey put the rate at 34%1. Scenario modelling for October to December 2026 estimates around 820,000 fuel poor households, 32% of all households, with around 400,000 in extreme fuel poverty, 16% of all households5. The band gradient sits underneath those headline movements.
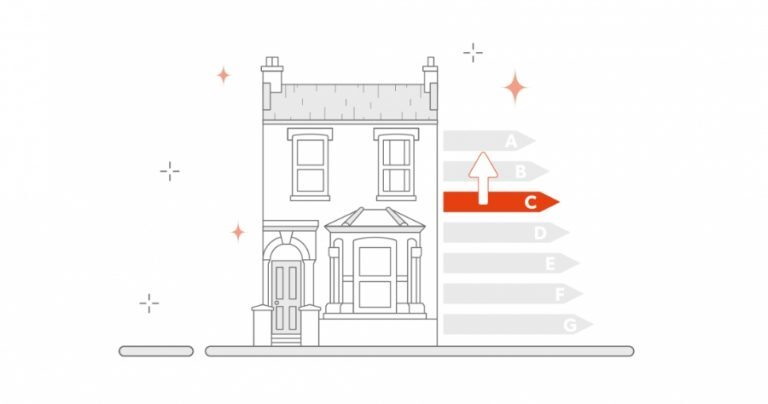
For a household, the practical point is that the EPC band is one of the few variables in fuel poverty that a homeowner or landlord can change directly. Insulation, glazing, heating system and controls all feed the rating. What the band data cannot show is what happens to an individual household that improves its home, because the surveys compare groups of dwellings rather than following the same homes over time.
The gradient: 27% in band C or better against 41% in bands F and G
The clearest single comparison in the Scottish data is the 2022 survey year, which put the fuel poverty rate at 27% for households in dwellings rated EPC band C or better and 41% for those in bands F or G2. That is a gap of 14 percentage points between the best and worst bands in the same survey year, on the same definition and the same sample.
The 2023 survey widened both ends of that comparison: 32% in band C or better and 48% in bands F or G1. The 2021 survey, published under the earlier definition, gave 16% in band C or better against 43% in bands F or G3. The direction is consistent across all three years even though the levels differ, which is what makes the band gradient a more durable finding than any single year's headline rate.
Extreme fuel poverty follows the same shape. In 2022, 12% of households in dwellings rated EPC C or better were in extreme fuel poverty, against 23% in bands F or G2. In 2021 the equivalent figure was 6% in band C or better3.
The stock itself has been improving. The proportion of Scottish properties in the lowest EPC bands, E, F or G, fell from 27% in 2010 to 8% in 2023 under SAP 20091. In 2023, 56% of Scottish homes were rated EPC band C or better using existing EPC ratings7. The Scottish Government classes any home with an EPC rating below C as having poor energy efficiency, which it says means fuel bills may be higher than they need to be8.
Why EPC rating and fuel poverty move together
The EPC band is a modelled estimate of the cost of heating and powering a home to a standard regime, so it is built from the same variables that determine what a household actually spends: the fabric of the building, the efficiency of the heating system, the fuel used and the controls. A home with solid walls, single glazing and an old boiler needs more delivered energy to reach a given temperature, and that shows up both in the rating and in the bill.
The Scottish Government recognises four main drivers of fuel poverty, two of which are explicitly finance-related: energy prices and income9. The other two relate to the home and how it is used. That framing matters because it explains why the band gradient is strong but not absolute. A household in a band C home on a very low income can still be fuel poor, and a household in a band E home on a high income may not be.
Income data bears this out. In 2018, 95% of households in the bottom income band, less than £200 per week, were fuel poor, and 55% in the second bottom band, between £200 and £300 per week9. In 2022, households with annual income under £15,000 had the highest rate of extreme fuel poverty at 72%2. Fuel poor households in homes below EPC band C are more likely to live in the lowest council tax bands A and B, 58% against 27% for other households, and more likely to have a low income below £300 per week10.
Geography adds a further layer. The fuel poverty rate for rural households was 35% in 2022 against 30% for urban households2. Remote rural areas recorded 43% and remote small towns 34%, against 24% in urban areas11. Homes off the gas grid tend to sit in the worse bands and face higher fuel costs, which is why the band gradient is steeper in rural Scotland than the national figures suggest.
What the Scottish House Condition Survey tables show
The Scottish House Condition Survey is the source for the band breakdowns. It is a national survey of the housing stock, and its fuel poverty estimates are published annually in the key findings and periodically in local authority tables. The 2022 survey estimated 791,000 households, 31% of all households, in fuel poverty, higher than the 2019 rate of 24.6%, around 613,000 households4. The 2023 survey put the rate at 34%1.
The local authority tables for 2022 to 2024 were published on 26 May 2026 and show fuel poverty rates ranging from 22% in Stirling to 51% in Orkney Islands, against a Scotland average of 31%12. That spread is wider than the national band gradient and reflects the combination of housing stock, climate, fuel availability and income across the country.
Sector matters too. In 2022, rates in the housing association sector were 47%, local authority 48% and private rented 44%2. The 2025 heat and buildings progress report records 44% of those living in the private rented sector in Scotland in fuel poverty13. The 2023 survey found households in the social sector more likely to be in extreme fuel poverty, 32%, than those in the private sector1.
"These are a best estimate of fuel poverty under the new definition of fuel poverty and therefore cannot be compared to statistics published under the old definition in local authority analyses prior to 2016-2018"
The Scottish Government's statutory target is that no more than 5% of households are fuel poor, with under 1% in extreme fuel poverty, in 204015. Progress is monitored by the statutory Scottish Fuel Poverty Advisory Panel16. The Fuel Poverty (Targets, Definition and Strategy) (Scotland) Act 2019 is the legal basis for the measurement17.
How Scotland compares with the rest of the UK
The four nations do not measure fuel poverty on the same basis, so headline rates are not directly comparable. Scotland uses a higher temperature standard than England and Wales18. The Scottish definition, set out in section 3 of the 2019 Act, treats a household as fuel poor if total fuel costs necessary for the home exceed 10% of adjusted net income after housing costs, and if the remaining income after fuel costs, care or disability benefits and childcare costs is insufficient for an acceptable standard of living17. Extreme fuel poverty applies the same test at more than 20%19.
Wales published modelled estimates as at October 2024 putting around 340,000 households, 25%, in fuel poverty. Within that, 15% of households in dwellings rated bands A to C were fuel poor, against 59% in bands F or G20. The Welsh band gradient is therefore steeper than Scotland's, though the definitions and the modelling differ.
England's statutory target is to improve as many fuel poor homes as is reasonably practicable to a minimum energy efficiency rating of band C by 203021. The English fuel poverty energy efficiency rating treats a property at band D or below as a factor in the low income low energy efficiency measure22. Sub-regional fuel poverty statistics for England covering 2024 were published on 14 May 202623.
Scotland's modelled rate for January to March 2026 was 31% of all households, around 800,000, with around 400,000 in extreme fuel poverty, 16%6. Scenario modelling for October to December 2026 estimates around 820,000 fuel poor households, 32%5. For April to June 2026 the estimate was around 680,000, a decrease of around 30,000 from the previous quarter24. These are modelled figures under the current definition and are not comparable with pre-2016 local authority analyses.
| Nation | Measure | Rate | Period |
|---|---|---|---|
| Scotland | Modelled fuel poverty | 31%6 | Jan to Mar 2026 |
| Scotland | Modelled fuel poverty | 32%5 | Oct to Dec 2026 |
| Wales | Modelled fuel poverty | 25%20 | October 2024 |
| Wales | Bands A to C | 15%20 | October 2024 |
| Wales | Bands F or G | 59%20 | October 2024 |
What a better EPC band means for household bills
The band data shows a lower fuel poverty rate in better-rated homes, but it does not translate directly into a bill saving for a given household. What it does show is the scale of the gap between the best and worst bands. In the 2023 survey, 26% of households in dwellings rated EPC band C or better were fuel poor, against 36% in band E and 48% in bands F or G1. Extreme fuel poverty was 10% in band C or better, 27% in band E and 23% in bands F to G1.
The Scottish Government's position is that the current EPC system helps prevent running costs increasing for the householder and therefore provides some protection for those in fuel poverty8. It has also committed to reforming the EPC assessment process so that it includes three indicators compatible with both fuel poverty and climate change targets25.
For households using electricity as their primary heating fuel, the fuel poverty gap is much larger than for gas. Modelled for January to March 2026, fuel poor households using electricity had a median fuel poverty gap of around £2,000 per year before the modelled reduction, falling by £300 to £1,7006. The actual median fuel poverty gap for fuel poor households in 2021 was £690 per year3. The gap is the amount by which a household's fuel costs would need to fall for it to be out of fuel poverty, so it is a measure of distance rather than of the bill itself.
Improving the band: the main routes to a higher rating
The routes to a higher EPC band are the fabric and the heating system. Insulation, glazing, draught-proofing, heating controls and the efficiency of the heat source all feed the rating. The Scottish Government classes any home with an EPC rating below C as having poor energy efficiency8, and the stock has been moving in that direction: the share of properties in bands E, F or G fell from 27% in 2010 to 8% in 20231, and 56% of Scottish homes were rated band C or better in 20237.
The private rented sector has its own minimum standards. In 2015, 28% of private rented dwellings, 95,000, fell into EPC bands E, F and G, and 9%, 30,000 dwellings, were in bands F and G26. Of dwellings with an EPC of F or G, 63% were in rural areas, as were 39% with an EPC of E, F or G27. The Scottish Government has consulted on minimum energy efficiency standards for the private rented sector, and the 2026 regulations are the subject of a regulatory impact assessment7.
For fuel poor households specifically, the Scottish Government estimated approximately 385,000 households on average over 2017 to 2019 living in homes below EPC band C10. The 2021 strategic approach set out the case for improving those homes, and the current EPC system is described as providing some protection for those in fuel poverty by preventing running costs increasing8.
Sources27 cited
- Scottish House Condition Survey 2023: Key Findings Summary, Scottish Government, 2023
- Scottish House Condition Survey 2022: Fuel Poverty, Scottish Government, 2022
- Scottish House Condition Survey 2021: Fuel Poverty, Scottish Government, 2021
- Scottish House Condition Survey 2022: Key Findings Summary, Scottish Government, 2022
- Fuel Poverty Scenario Modelling Based on Ofgem Energy Price Caps up to October to December 2026, Scottish Government, 2026
- Scenario Modelling: Impact of the Reduction of the Renewables Obligation and Ending ECO on Fuel Poverty in Scotland, Scottish Government, 2026
- Energy Efficiency of Domestic Private Rented Property (Scotland) Regulations 2026: Regulatory Impact Assessment, Scottish Government, 2026
- Tackling Fuel Poverty in Scotland: A Strategic Approach, Scottish Government, 2021
- Research: Lived Experience of Fuel Poverty in Scotland, Scottish Government, 2020
- Tackling Fuel Poverty in Scotland: A Strategic Approach, Scottish Government, 2021
- Heat in Buildings Strategy: Island Communities Impact Assessment, Scottish Government, 2021
- Scottish House Condition Survey Local Authority Tables 2022 to 2024: Fuel Poverty, Scottish Government, 2026
- Heat in Buildings Progress Report 2025, Scottish Government, 2025
- Scottish House Condition Survey: Local Authority Analysis 2017 to 2019, Scottish Government, 2021
- Heat in Buildings Progress Report 2024, Scottish Government, 2024
- Fuel Poverty, Scottish Government, 2026
- Scenario Modelling: 2023 Fuel Poverty Levels Under 2019 Fuel Prices, Scottish Government, 2025
- Fuel Poverty Definition in Scotland, UK Parliament, 2011
- Fuel Poverty Statistics, House of Commons Library, 2026
- Fuel Poverty Modelled Estimates for Wales, October 2024, Welsh Government, 2025
- Annual Fuel Poverty Statistics Report 2026, House of Commons Library, 2026
- Fuel Poverty England 2024, National Energy Action, 2024
- Fuel Poverty Indicator, Office for National Statistics, 2026
- Fuel Poverty Scenario Modelling Based on Ofgem Energy Price Caps up to April to June 2026, Scottish Government, 2026
- Tackling Fuel Poverty in Scotland: A Strategic Approach, Scottish Government, 2021
- Minimum Standards for Energy Efficiency in the Private Rented Sector, Scottish Government, 2015
- Minimum Standards for Energy Efficiency in the Private Rented Sector: Consultation, Scottish Government, 2017
 Fuel PovertyHow does Scotland decide if a household is in fuel poverty, and how many homes are affected?
 Fuel Poverty in the UKWho counts as living in fuel poverty, and why does the number change depending on where in the UK you live?
 Housing Stock and EPCsHow energy efficient are Scottish homes, and how many reach a good rating?
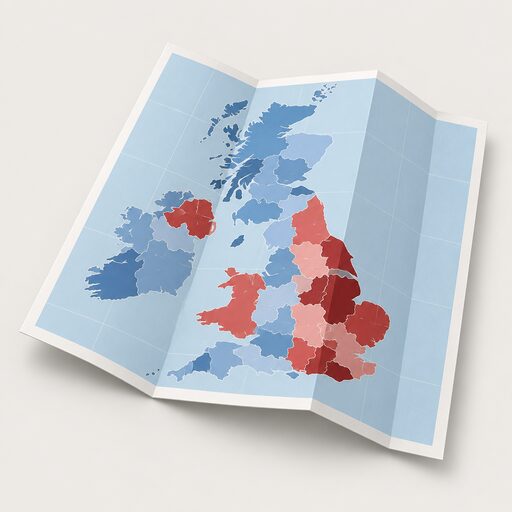 Local Fuel Poverty StatisticsHow many households in your area struggle to afford their heating?
 Fuel Poverty PolicyWhy does fuel poverty mean something different depending on where in the UK you live?
 Housing Stock Data for ScotlandScotland's housing is measured differently from England's, so the numbers you see may not compare directly.