
In this answer
Short answer
Fuel poverty in Scotland is not evenly spread. The Scottish House Condition Survey local authority tables for 2022 to 2024 put the national rate at 31%, with local authority figures ranging from 22% in Stirling to 51% in Orkney Islands1. The worst areas are the islands and the rural north and west: Orkney, Na h-Eileanan Siar, Shetland, Highland and Argyll and Bute. The best-performing areas on the same tables sit at the other end, with Stirling lowest and Midlothian and Moray also named among the strongest performers on low carbon uptake1.
The gap between those two ends is roughly 29 percentage points, and it is not explained by income alone. It tracks the heating fuel a household can get, the age and construction of the housing stock, and how far the home sits from a mains gas connection. Scotland's statutory target requires that by 2040 no more than 5% of households are in fuel poverty and no more than 1% in extreme fuel poverty, and it must be met within each of the 32 local council areas rather than across Scotland as a whole3. On the 2022 to 2024 tables, no council area is close.
What counts as fuel poverty in Scotland: the 10% definition and the three legal targets
Scotland's definition is set in section 3 of the Fuel Poverty (Targets, Definition and Strategy) (Scotland) Act 20195. A household is in fuel poverty if, to maintain a satisfactory heating regime, total fuel costs are more than 10% of adjusted net income after housing costs, and if after deducting fuel costs, benefits received for a care need or disability and childcare costs, the remaining adjusted net income is insufficient to maintain an acceptable standard of living6. Extreme fuel poverty uses a 20% threshold on the same calculation7.
That second limb matters. It is not a pure ratio test: a household can spend well over 10% of income on fuel and still not be counted if the money left over clears the acceptable standard of living test, which is benchmarked against at least 90% of the UK Minimum Income Standard after childcare and disability or care benefit adjustments7.
The Act sets three targets for 2040: no more than 5% of households in fuel poverty, no more than 1% in extreme fuel poverty, and a median fuel poverty gap of no more than £250 adjusted for 2015 prices8. The 5% and 1% figures appear across the strategy documents9. The territorial condition is the one that bites hardest on this page: the targets must be achieved within each of the 32 local council areas and not just in Scotland as a whole3. A national average of 5% would not satisfy the Act if Orkney sat at 20%.
The Fuel Poverty Strategy commits to reporting every three years, with the final report published no later than 204211.
Where fuel poverty is worst: what the local authority tables show
The Scottish House Condition Survey is the official source for fuel poverty figures in Scotland, published by the Scottish Government12. The local authority tables covering 2022 to 2024 were published on 26 May 2026, showing rates from 22% in Stirling to 51% in Orkney Islands against a Scotland average of 31%1.
The pattern is consistent across years and across measures. In the 2018 to 2019 period, extreme fuel poverty ran at 24% in Na h-Eileanan Siar, 22% in Orkney Islands, 22% in Shetland Islands, 22% in Highland and 19% in Argyll and Bute13. Those are extreme fuel poverty rates, the 20% threshold, not the headline 10% measure, which makes them starker still.
| Area | Measure | Rate | Period |
|---|---|---|---|
| Orkney Islands | Fuel poverty | 51% | 2022 to 20241 |
| Scotland | Fuel poverty | 31% | 2022 to 20241 |
| Stirling | Fuel poverty | 22% | 2022 to 20241 |
| Na h-Eileanan Siar | Extreme fuel poverty | 24% | 2018 to 201913 |
| Orkney Islands | Extreme fuel poverty | 22% | 2018 to 201913 |
| Shetland Islands | Extreme fuel poverty | 22% | 2018 to 201913 |
| Highland | Extreme fuel poverty | 22% | 2018 to 201913 |
| Argyll and Bute | Extreme fuel poverty | 19% | 2018 to 201913 |
Tenure and deprivation cut across geography. In 2024, 49% of social sector households were in fuel poverty against 22% in the private sector, and 22% of social sector households were in extreme fuel poverty against a lower private sector figure6. A higher proportion of households in the 15% most deprived areas were in fuel poverty compared with other areas of Scotland6. In 2022, rates in housing association (47%), local authority (48%) and private rented (44%) sectors were similar14. Detached houses had the lowest rates of fuel poverty, at 24%14.
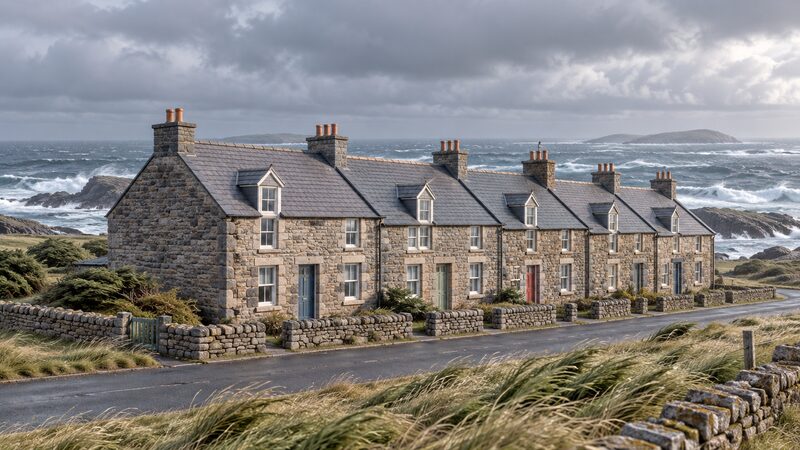
Where fuel poverty is lowest: Na h-Eileanan Siar, Midlothian and Moray among the best performers
The lowest rates on the 2022 to 2024 local authority tables sit in the central belt and the north east. Stirling records 22% against the 31% Scotland average1. Na h-Eileanan Siar, Midlothian and Moray are reported as the best-performing local authorities in terms of uptake for the year2.
Those two statements measure different things and should not be read as one. The 22% figure is a fuel poverty rate. The best-performing list is about uptake of low carbon measures, which reflects how quickly households in an area have taken up installations, not how few of them are fuel poor. Na h-Eileanan Siar appears on both sides of the picture: named among the best performers on uptake, and carrying 24% extreme fuel poverty in the 2018 to 2019 data13. A high uptake rate in an area with a severe underlying problem is a sign of need being met, not of the problem being absent.
The national trend has been downward. The 2024 key findings record a decrease of 127,000 households, or five percentage points, in the number of households in fuel poverty6. Scenario modelling for the January to March 2026 price cap period estimated around 800,000 fuel poor households in Scotland, 31% of all households, with around 400,000 in extreme fuel poverty, 16% of all households15. That is a reduction of around 60,000 households, 2.5 percentage points, in the number of fuel poor households15.
Scenario modelling for the October to December 2026 price cap period estimates around 820,000 fuel poor households, 32% of all households16, while the January to March 2026 modelling gives around 800,000 at 31%15. Both are official estimates for different price cap periods, and the difference reflects the cap assumption rather than a change in the housing stock.
Why some areas fare worse: off-gas-grid homes, rural costs and the fuel mix
The single strongest predictor of area-level fuel poverty in Scotland is whether the home can get mains gas. In 2021, extreme fuel poverty ran at 14% for households outwith coverage of the gas network against 9% for households within it4. Fuel poverty rates were highest for remote rural households at 21% and lowest for other urban households at 8%4. Remote rural fuel poverty stood at 43% and remote small towns at 34%, against 24% in urban areas13.
The fuel a household burns changes the arithmetic. Households using electricity as their primary heating fuel have a significantly higher median fuel poverty gap, around £2,000 per year15. Fuel poverty rates for households using gas as their primary heating fuel ran at 29% and for oil at 28%14. In 2024, 13% of households using oil were in extreme fuel poverty17.
"Fuel poverty levels are higher in remote rural (43%) and remote small towns (34%) than in urban areas (24%)"
The mechanism is straightforward. A home off the gas grid heats with electricity, oil, LPG or solid fuel, all of which cost more per unit of delivered heat than mains gas in most of Scotland, and rural homes tend to be older, larger, detached and harder to insulate. Rural households also face longer supply chains for oil and higher standing charges. The result is that the same income buys less warmth in Orkney than in Glasgow.
Independent guidance puts the Scottish rate at around 34% of households, against 11% in England, 14% in Wales and 14% in Northern Ireland18. That comparison is not a like-for-like measure across the four nations, because Scotland's definition includes the income-adequacy test and the others do not, but it reflects the underlying cost position.
The Scottish support system: Warmer Homes Scotland, Home Energy Scotland and area schemes
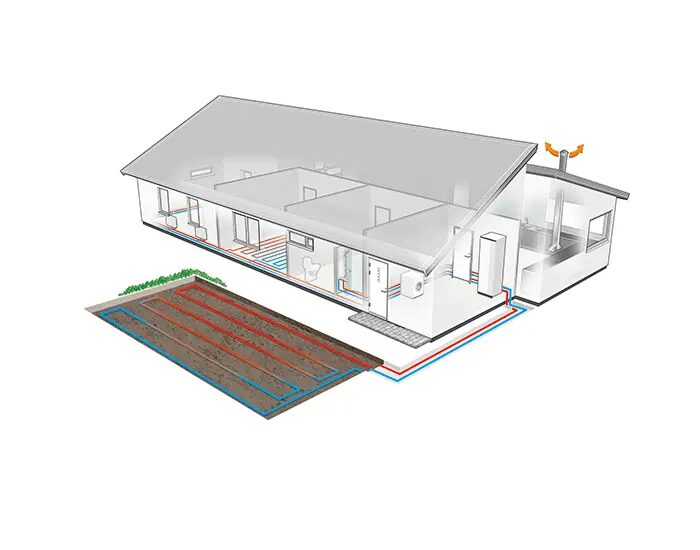
Warmer Homes Scotland helps households in, or at risk of, fuel poverty improve their heating and energy efficiency, through installing insulation and heating measures into individual properties19. It is the national scheme for individual homes, and it is the route most often cited for a household in an island or rural area with no gas connection.
Area Based Schemes work at street and block level rather than house by house. Areas in need of energy efficiency upgrades are identified through data analysis and engagement with local communities, including EPC ratings, fuel poverty statistics, community feedback and the Scottish Index of Multiple Deprivation17. That is why two neighbouring streets can have different eligibility: the scheme targets areas, not individual applicants.
Home Energy Scotland provides advice and runs events, including free water-saving webinars with Scottish Water explaining how saving water can reduce energy use and household bills, with free water-saving devices available afterwards subject to eligibility and availability21.
For a household in a worst-affected area, the practical position is that support exists but is targeted, means-tested and often area-based. The dependence that remains is on the grid connection, on a supplier, and in rural Scotland on delivered fuel. Insulation and a heating upgrade reduce the bill; they do not remove the standing charge, the network cost or the exposure to a price cap set for Great Britain as a whole.
Sources21 cited
- SHCS local authority fuel poverty tables 2022 to 2024, Scottish Government, 2026
- Low Carbon Landscape 2026, MCS Certified, 2026
- Fuel poverty policy in Scotland, Scottish Government, 2026
- Scottish House Condition Survey 2021: fuel poverty, Scottish Government, 2021
- Fuel poverty statistics briefing, House of Commons Library, 2026
- Scottish House Condition Survey 2024 key findings, Scottish Government, 2026
- Fuel poverty, CIPHE, 2026
- Heat in Buildings Strategy, Scottish Government, 2021
- Tackling fuel poverty: periodic report engagement responses, Scottish Government, 2025
- Heat in Buildings Strategy summary, Scottish Government, 2021
- Tackling fuel poverty: periodic report 2021 to 2024, Scottish Government, 2025
- Initial response on Scottish Budget 2024 to 2025, Fuel Poverty Advisory Panel, 2023
- Heat in Buildings Strategy: island communities impact assessment, Scottish Government, 2021
- Scottish House Condition Survey 2022: fuel poverty, Scottish Government, 2022
- Scenario modelling: Renewables Obligation reduction and ending ECO, Scottish Government, 2026
- Fuel poverty scenario modelling, October to December 2026 price cap, Scottish Government, 2026
- Energy Efficient Scotland Area Based Schemes, West Lothian Council, 2026
- Join the conversation on fuel poverty, IGEM, 2025
- Warmer Homes Scotland scheme headline data, Scottish Government, 2026
- Scottish Government response to the Green Heat Finance Taskforce, Scottish Government, 2025
- Water: is it really worth saving?, Home Energy Scotland, 2026
 Fuel PovertyHow does Scotland decide if a household is in fuel poverty, and how many homes are affected?
 Fuel PovertyWhy does Northern Ireland have such a high rate of fuel poverty, and how many households are affected?
 Fuel Poverty PolicyWhy does fuel poverty mean something different depending on where in the UK you live?
 Local Fuel Poverty StatisticsHow many households in your area struggle to afford their heating?
 Fuel PovertyHow the Welsh Government defines and measures fuel poverty, the latest modelled estimate of 340,000 households (25%) as at October 2024, who is most affected, and how the Tackling Fuel Poverty Plan and the Warm Homes Nest scheme are meant to bring the figure down.
 Energy Policy in ScotlandWho decides how your home in Scotland is heated and improved?