

In this guide
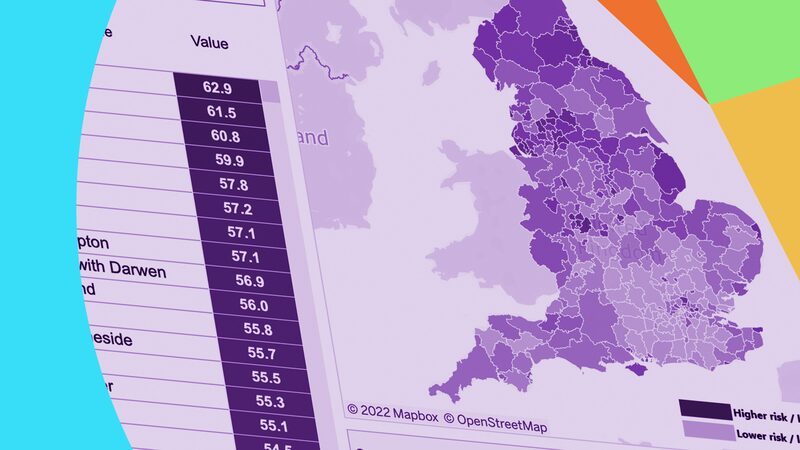
Fuel poverty in England is measured at local authority level through the sub-regional fuel poverty statistics, published by the Department for Energy Security and Net Zero. The most recent release, on 14 May 2026, carries 2024 data and is classed as official statistics in development1. The figures are modelled estimates built from the English Housing Survey rather than a count of every household, and they are constrained to regional totals2.
The national context matters because it sets the benchmark against which any single area is read. Fuel poverty affected 2.36 million households in England in 2025, representing 9.4 per cent of all households3. An earlier estimate put 13 per cent of households, or 3.17 million, in fuel poverty in England in 2023 under the Low Income Low Energy Efficiency metric4. The two figures use different years and different bases, so both are given here.
For Scotland, the equivalent local picture comes from the Scottish House Condition Survey local authority tables, published on 26 May 2026 for 2022 to 2024. Those tables show rates ranging from 22 per cent in Stirling to 51 per cent in Orkney Islands, against a Scotland average of 31 per cent5. Fuel poverty is a devolved policy area, defined and measured differently in different parts of the UK, so an English local authority rate and a Scottish council area rate are not directly comparable6.
What fuel poverty means and how it is measured
The definition is not one thing across the UK, and that is the single most important fact for anyone reading a local rate. In England, households are said to be in fuel poverty if they would have to spend more than the median amount on fuel to keep their home at a reasonable temperature, and spending that amount would put their income below the poverty line8. That is the Low Income High Costs approach, and the definition in England changed in 20138.
Scotland, Wales and Northern Ireland work from a different starting point. Originally, a household was defined as being in fuel poverty if it would have to spend more than 10 per cent of its income to keep the home at a reasonable temperature8. Scotland now defines it under the Fuel Poverty (Targets, Definition and Strategy) (Scotland) Act 2019, where a household has to spend more than 10 per cent of its income on fuel costs to maintain a satisfactory heating regime9. The Scottish Government also records that more than 10 per cent, and 20 per cent for extreme fuel poverty, of net income is required to pay for reasonable fuel needs after housing costs have been deducted9.
Wales uses a threshold of more than 10 per cent of full household income to maintain a satisfactory heating regime10. Northern Ireland's guidance states that a household is in fuel poverty if it needs to spend more than 10 per cent of its income on energy costs11. Ofgem's own glossary describes the same 10 per cent threshold12.
| Nation | Definition in use | Threshold |
|---|---|---|
| England | Low Income Low Energy Efficiency, changed in 2013 | Above median fuel spend, pushing income below the poverty line8 |
| Scotland | Fuel Poverty (Targets, Definition and Strategy) (Scotland) Act 2019 | More than 10 per cent of income; 20 per cent for extreme fuel poverty9 |
| Wales | Full household income threshold | More than 10 per cent of income10 |
| Northern Ireland | Income threshold | More than 10 per cent of income11 |
The practical consequence is that a rate published for an English local authority and a rate published for a Scottish council area are measuring different things. A household reading a "fuel poverty map" needs to know which definition sits behind the shading before drawing any conclusion about its own area.
Fuel poverty by local authority: what the sub-national statistics show

The England sub-regional dataset is published as Official Statistics and covers England only13. The estimates are modelled, not counted: the ONS records that the figures are modelled estimates for England based on data from the English Housing Survey, and that estimates at the sub-regional level are official statistics in development and are modelled and constrained to regional totals2. That constraint matters. It means local authority figures are produced by distributing a known regional total, not by independently measuring each area.
The release cycle is annual and the data lags. The 2026 report, published 14 May 2026, carries 2024 data1. The 2025 report carried 2023 data14. The 2024 report, published 25 April 2024, carried 2022 data15. Each of these is described as official statistics in development1. The annual fuel poverty statistics report, by contrast, is classed as Accredited official statistics and covers 2024 and 2025 data, with projections for the number of households in fuel poverty in 2025 and 202616.
For Scotland, the local authority tables come from the Scottish House Condition Survey rather than a modelled distribution of a regional total. The 2022 to 2024 tables were published on 26 May 2026 and give a rate for each council area5. A separate Fuel Poverty Index for Scotland rates each Scottish local authority on a score from 1 to 10017.
England: 3.17 million households and a rate of about 13 per cent
The headline numbers for England have moved between releases and between metrics, and the differences are large enough to state plainly. The Environmental Audit Committee recorded that an estimated 13 per cent of households, or 3.17 million, in England were living in fuel poverty in 2023 under the Low Income Low Energy Efficiency metric4. The 2025 provisional figure in the DESNZ annual report is 2.36 million households, or 9.4 per cent18. A separate DESNZ document states that fuel poverty affected 2.36 million households in England in 2025, representing 9.4 per cent of all households3.
These are not measurements of the same thing. They span different years, different metrics and different stages of revision. The 2023 figure of 3.17 million uses the Low Income Low Energy Efficiency metric4, while the 2025 figure of 2.36 million is provisional and subject to revision18. A household counted in one year and on one metric may not be counted in another, so a fall between releases is not by itself evidence that fewer homes are cold.
The annual fuel poverty statistics report for 2026 was first published on 26 March 2026 and republished on 7 August 2026 to correct a calculation error on benefit receipt and the description of the median affordability indicator16. That correction is worth knowing about, because it means any figure quoted from the first version of that report may not match the current one.
For a household trying to place itself, the useful comparison is the rate rather than the count. A rate of 9.4 per cent in 202518 and a rate of around 13 per cent in 20234 describe the same country two years apart under two different metrics. The direction of travel between them is not a simple fall, because the metric changed.
Scotland: local authority tables from the Scottish House Condition Survey
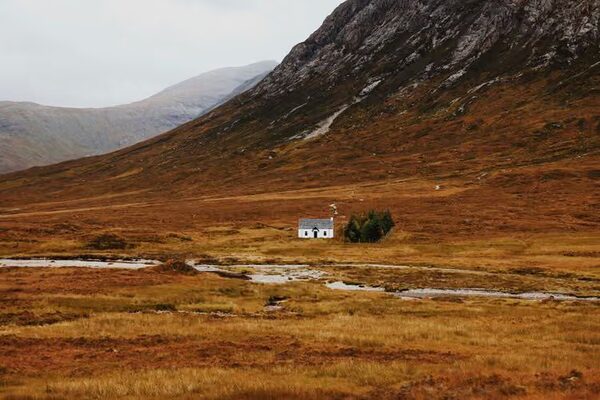
Scotland publishes a rate for each council area, and the spread is wide. The Scottish House Condition Survey local authority tables for 2022 to 2024, published on 26 May 2026, show fuel poverty rates ranging from 22 per cent in Stirling to 51 per cent in Orkney Islands, against a Scotland average of 31 per cent5. That is a range of 29 percentage points between the lowest and highest council areas.
The drivers show up clearly in the tenure and fuel-type breakdowns. In 2021, 37 per cent of households renting from a local authority and 30 per cent of households renting from a housing association were fuel poor19. Households in the 15 per cent most deprived areas ran at 30 per cent against 18 per cent elsewhere19. Rates also differ by heating fuel: an estimated 27 per cent of households using gas for heating were classed as being in fuel poverty, compared with 23 per cent of those using heating oil and 26 per cent using other fuels20.
Tenure matters as much as geography. The Scottish Government has recorded that 44 per cent of those living in the private rented sector in Scotland are in fuel poverty21, a rate well above the national average and one that a tenant has little power to change, since the fabric of the home and the heating system are the landlord's to replace. That is the practical limit on independence for renters: the measures that would cut a bill are capital works on someone else's asset.
Geography compounds all of it. The rate of fuel poverty for remote rural households was 47 per cent in 2022, higher than for all other areas, and extreme fuel poverty was highest for remote rural households at 35 per cent20. In 2021, fuel poverty rates were highest for remote rural households at 29 per cent and lowest for other urban and accessible small towns at 8 per cent19. The Scottish Government has also noted that fuel poor households in inefficient homes are more likely to live in remote rural areas, at 13 per cent versus 8 per cent22.
"the rate of fuel poverty for remote rural households (47%) is higher than for all other areas"
Where the data comes from: DESNZ sub-national statistics and source data
The England sub-national series is produced by the Department for Energy Security and Net Zero. The ONS Explore local statistics service names DESNZ as the data source for the fuel poverty indicator2, and the underlying DESNZ source data for that indicator was published on 14 May 20262. The dataset itself is held on data.gov.uk as Fuel Poverty in England: sub-regional, marked Official Statistics and England only, updated 14 May 202613.
The modelling chain runs from the English Housing Survey to local authority estimates. The ONS states that the figures are modelled estimates for England based on data from the English Housing Survey, and that household and fuel poverty numbers at region level come from the national fuel poverty statistics, 20242. Sub-regional estimates are then constrained to those regional totals2.
For Scotland, the source is the Scottish House Condition Survey, which underpins both the local authority tables and the key findings reports5. The Fuel Poverty Index for Scotland provides a separate local authority scoring from 1 to 10017.
Northern Ireland's fuel poverty material sits with the Department for Communities11. DESNZ also runs a Public Attitudes Tracker covering public awareness, attitudes and behaviours relating to its policies, including energy and climate change23.
The distinction between an Accredited official statistics release and one in development is not cosmetic. The annual fuel poverty statistics report carries Accredited status16; the sub-regional releases carry development status1. A figure from a development series can be revised as the methodology settles.
How your local area compares: reading the figures for your authority

There are two practical routes to a single area's rate. The first is the DESNZ sub-regional release itself, which presents the England figures down to local authority level1. The second is the ONS Explore local statistics service, where fuel poverty in England is one of 109 local indicators, sourced from DESNZ2. That service is the quicker route for a household that wants one number rather than a dataset.
For Scotland, the Scottish House Condition Survey local authority tables give a rate per council area directly5. For Northern Ireland, the Department for Communities publishes the fuel poverty material11.
Reading a local rate well means holding three things in mind:
- The year. The England sub-regional figures currently available carry 2024 data1, so they describe a period that has already passed.
- The metric. An English rate uses the Low Income Low Energy Efficiency approach, a Scottish rate uses the 10 per cent threshold, and they are not interchangeable8.
- The modelling. Sub-regional estimates are constrained to regional totals, so a small area's figure carries more uncertainty than the regional figure it sits within2.
A household comparing its own area against the national average should also check whether the comparison is like for like on tenure and fuel type. In 2021, 37 per cent of households renting from a local authority and 30 per cent of households renting from a housing association were fuel poor19. An area with a large social housing stock will show a higher rate for reasons that have nothing to do with its geography.
Why rates differ so much between local areas
The variation between areas is driven by a small number of measurable factors, and the Scottish data breaks them down most fully.
Tenure is the strongest single signal. In 2021, 37 per cent of households renting from a local authority and 30 per cent of households renting from a housing association were fuel poor19. Households in the 15 per cent most deprived areas ran at 30 per cent against 18 per cent elsewhere19. Rates also differ by heating fuel: an estimated 27 per cent of households using gas for heating were classed as being in fuel poverty, compared with 23 per cent of those using heating oil and 26 per cent using other fuels20.
Geography matters too. Fuel poverty levels are higher in remote rural areas at 43 per cent and remote small towns at 34 per cent than in urban areas at 24 per cent24. Rates of fuel poverty increased in remote rural areas from 33 per cent to 43 per cent24.
Deprivation and geography overlap. In 2021, the fuel poverty rate in the 15 per cent most deprived areas of Scotland was 30 per cent against 18 per cent elsewhere19. By urban-rural classification, the rate of fuel poverty for remote rural households was 47 per cent, higher than for all other areas, and rates of extreme fuel poverty were also highest for remote rural households, at 35 per cent20. In 2021 the equivalent extreme fuel poverty figures were 15 per cent in rural areas against 9 per cent in urban areas19. Remote rural homes tend to be off the gas grid, harder to insulate and more exposed to weather, so the same income buys less warmth.
Fuel type completes the picture. In Scotland in 2023, 26 per cent of households using oil were in fuel poverty25. Households off the mains gas network buy heating oil or LPG in bulk, at prices outside the default tariff cap, which applies to electricity and gas supplied by licensed suppliers. That leaves those households dependent on a delivered fuel market with no capped unit rate, and it is one reason local rates diverge so sharply between areas on and off the gas grid.
What the national picture tells us: around 6 million UK households

The UK-wide estimates come from National Energy Action rather than from a single official series, because fuel poverty is devolved and no one government publishes a UK total. The charity estimated that 4.5 million households were in fuel poverty in the UK in October 20256. A separate estimate from National Energy Action puts the figure at over six million households, with energy debt rising21. Chris Lovatt, cited in the same release, stated that across the UK there are more than 6 million homes in or approaching levels of fuel poverty21.
The two figures, 4.5 million and over six million, come from the same charity in the same period and are not reconciled. The wider figure includes homes approaching fuel poverty, not only those inside the definition, which goes some way to explaining the gap.
The national estimates sit alongside a set of pressures that local data captures only indirectly. The End Fuel Poverty Coalition has published research showing 31 per cent of UK adults are in energy debt or worried about falling behind, with a median debt of £75026. Projections cited by the same coalition show average energy bills rising to £1,973 from 1 July 2026, a 20 per cent increase including a £332 element attributed to the conflict26.
For a household, the national figure is context rather than a target. What determines a home's exposure is its own tenure, fuel type, building fabric and income, which is exactly what the local breakdowns measure. The fuel poverty statistics page covers how the national numbers are produced, and the UK home energy statistics pillar sets them alongside deployment and price data.
Help if you cannot afford to heat your home: National Energy Action's free advice line
National Energy Action runs a free advice line on 0800 304 71597. The charity offers advice and support to help people across England, Wales and Northern Ireland stay warm and manage energy costs7. The service provides free advice about energy bills and keeping warm and safe in your home, and can also help with benefits advice and income maximisation7. A British Sign Language interpreter can be requested7.
The Energy Ombudsman also offers advice for consumers worried about their energy bills27. At local authority level, some councils publish their own guidance on getting help with energy bills; Birmingham City Council, for example, maintains a page on the subject28.
The limits of what statistics can do are worth stating. A local authority rate is a modelled estimate of an area, not a statement about any individual household, and it cannot tell a resident whether they personally qualify for support. What it can do is show whether the area they live in runs above or below the national figure, and on which of the underlying factors, tenure, fuel type, rurality or deprivation, that difference rests.
Sources28 cited
- Sub-regional fuel poverty report 2026 (2024 data), Department for Energy Security and Net Zero, 14 May 2026
- Fuel poverty indicator, Office for National Statistics, 20 September 2026
- Clean heat and fuel poverty report, Department for Energy Security and Net Zero, 2025
- Energy security and net zero Committee report, House of Commons Environmental Audit Committee, 2023
- Scottish House Condition Survey local authority tables 2022 to 2024: fuel poverty, Scottish Government, 26 May 2026
- Fuel poverty in the UK, House of Commons Library, April 2025
- Energy advice and support service, National Energy Action
- Fuel poverty: an overview, House of Commons Library, 2026
- Home energy and fuel poverty, Scottish Government
- Tackling fuel poverty 2021 to 2035, Welsh Government, April 2021
- Fuel poverty, Department for Communities (Northern Ireland)
- Energy terms explained, Ofgem, 2026
- Fuel Poverty in England: sub-regional, data.gov.uk, 14 May 2026
- Sub-regional fuel poverty report 2025 (2023 data), Department for Energy Security and Net Zero, 30 April 2025
- Sub-regional fuel poverty report 2024 (2022 data), Department for Energy Security and Net Zero, 25 April 2024
- Annual fuel poverty statistics report: 2026, Department for Energy Security and Net Zero, 26 March 2026
- Fuel Poverty Index Scotland, data.gov.uk, 10 November 2023
- DESNZ annual report and accounts 2025 to 2026: performance report, Department for Energy Security and Net Zero, 2025
- Scottish House Condition Survey 2021: key findings, fuel poverty, Scottish Government, 2021
- Scottish House Condition Survey 2022: key findings, fuel poverty, Scottish Government, 2022
- Heat in buildings progress report 2025, Scottish Government, 2 October 2025
- Tackling fuel poverty in Scotland: a strategic approach, Scottish Government, December 2021
- DESNZ Public Attitudes Tracker: winter 2025, Department for Energy Security and Net Zero, 12 March 2026
- Fuel poverty in Scotland, House of Commons Library, 2024
- Smart data: tackling fuel poverty, Smart DCC, 2025
- What will Ofgem's winter price cap show?, End Fuel Poverty Coalition
- Worried about your energy bills, Energy Ombudsman
- Getting help with your energy bills, Birmingham City Council, 24 June 2026
 Fuel Poverty in the UKWho counts as living in fuel poverty, and why does the number change depending on where in the UK you live?
 The Full Statistics GuideHow many homes in the UK have solar panels, heat pumps or batteries?
 Fuel Poverty StatisticsWhy do fuel poverty figures differ across the UK, and why is there no single number for the whole country?
 Fuel Poverty PolicyWhy does fuel poverty mean something different depending on where in the UK you live?
 Fuel PovertyWhy does Northern Ireland have such a high rate of fuel poverty, and how many households are affected?
 Fuel PovertyHow does Scotland decide if a household is in fuel poverty, and how many homes are affected?