

In this guide
Most UK home energy figures a household will meet come from one of three kinds of source: an accredited official statistic, an official statistic still in development, or an industry or survey estimate. The label is printed on the release and it decides how much weight a number carries. The English Housing Survey is an Accredited Official statistic, previously known as a National statistic1. So are the National Energy Efficiency Data-Framework (NEED) outputs, Energy Consumption in the UK, UK Energy in Brief and the local authority greenhouse gas emissions series2. The Energy Performance of Buildings Certificates release, by contrast, is published as Official Statistics in development, formerly called Experimental Official Statistics3.
The second thing that moves a headline is the sample and the method behind it. The English Housing Survey is described as an annual survey of 13,000 face-to-face interviews and 6,000 physical surveys of homes in England4. The Scottish Household Survey invites a random sample of addresses every year, so that results are representative of everyone in Scotland rather than certain groups5. Ofgem's consumer survey work runs at roughly 3,500 to 4,000 domestic consumers across Great Britain per wave6. Those are different populations, different questions and different fieldwork, and they will not agree with each other even when they appear to measure the same thing.
The third is the break in the series. The 2020 and 2021 Scottish Household Survey rounds were carried out by telephone because of Covid limitations, published as experimental statistics and are not directly comparable with other years7. EPC quarterly data has a seasonal pattern and should only be compared between the same quarters across years3. And a series can simply stop: the Office for National Statistics decided to discontinue its Energy Efficiency of Housing statistics8.
What "accredited" actually means on a release
Accredited Official Statistics status means the statistics meet the highest standards of trustworthiness, quality and value2. It is awarded after assessment against the Code of Practice for Statistics, and that assessment has a date on it. The Household Energy Efficiency Statistical Release recorded that its statistics last underwent a full assessment against the Code of Practice for Statistics on 12 June 201410. An accreditation is therefore a statement about a production process at a point in time, not a guarantee that every number in the latest table is final.
Three tiers appear in practice across home energy data:
| Status | Example release | What it signals |
|---|---|---|
| Accredited official statistics | Energy Consumption in the UK 202511; UK Energy in Brief 202612; UK local authority and regional greenhouse gas emissions 2005 to 202413; NEED impact of measures data tables 202514 | Assessed against the Code of Practice |
| Official statistics | Energy Performance of Building Certificates, April to June 202515 | Produced to official standards, not accredited |
| Official statistics in development | Energy Performance of Buildings Certificates, England and Wales16; energy efficiency characteristics of new dwellings17 | New or changing method, may be revised |
The EPC series shows how a release can move between tiers. The July to December 2020 publication was described as experimental statistics18, later releases as Official Statistics in development19, and the 2025 quarterly release simply as Official Statistics15. None of that means the underlying certificates changed. It means the statistical producer's confidence in the method changed, and a household comparing a 2020 EPC figure with a 2025 one is comparing outputs produced under different labels.
Statistics in development also carry an explicit warning about their own future. The new dwellings dataset states that the statistics are new and may be subject to refinement in light of user feedback, while also being consistent with the Energy Performance of Buildings Certificates release17. Consistency with a sibling release is useful: it is the reason two datasets can be read together without double counting.
The main surveys a householder will meet

The English Housing Survey is a national survey of people's housing circumstances and of the condition and energy efficiency of housing in England. It is a repeated cross-sectional survey that pairs a household interview with a physical inspection of the home, first run in 19671. That pairing matters: the interview captures tenure, payment method and attitudes, while the inspection records what is physically present. Its energy reports cover the presence of different heating systems, and whether households had changed fuel supplier or tariff and how they pay for energy20. A separate fact sheet examines the prevalence and preparedness of English homes for low carbon technologies such as heat pumps and electric vehicle charge points21.
The Scottish Household Survey provides evidence on the characteristics, attitudes and behaviour of private households and individuals, as well as on the physical condition of Scotland's homes5. Its topics include housing, neighbourhoods, finances, internet, physical activity, local services, environment, volunteering, culture and childcare5, and its Data Explorer divides results into eleven topics, adding trust in public institutions7. Scotland also runs the Scottish House Condition Survey, the source for statements such as more than 2 million homes using mains gas or oil as their primary heating fuel22.
Northern Ireland is served differently again. NISRA's CT0062 table presents Census 2021 estimates that classify households in Northern Ireland by EPC band and by various household characteristics23. A census-based classification is not a sample survey, so it does not carry sampling error, but it is tied to a single census date.
For the consumer side of the market, Ofgem and Citizens Advice commission the Energy Consumer Satisfaction Survey of domestic energy consumers in England, Scotland and Wales24.
Sample sizes and what they support
Sample size sets what a statistic can be cut by. A national total is robust at a few thousand responses; a figure for owner-occupied detached homes with a heat pump in one region usually is not.
| Survey | Sample | Coverage |
|---|---|---|
| English Housing Survey | 13,000 interviews, 6,000 physical surveys a year4 | England |
| Energy Consumer Satisfaction Survey, January 2025 | 3,854 domestic consumers24 | Great Britain |
| Energy Consumer Satisfaction Survey, Aug to Sep 2023 | 3,742 domestic consumers25 | Great Britain |
| Understanding Consumers' Energy Tariff Choices, Mar to Apr 2024 | 3,235 bill-paying adults26 | England, Scotland and Wales |
| Flexibility and Net Zero Survey, June 2025 | 4,385 domestic consumers27 | Great Britain |
| Energy Efficient Scotland Transition Programme evaluation | 490 households, eight local authority areas28 | Scotland |
Method matters as much as size. The Scottish Household Survey uses a random sample of addresses5, while the Energy Consumer Satisfaction Survey uses a quota-based approach to sampling29 and the 2025 flexibility survey was an online, random probability survey27. A random probability sample and a quota sample answer questions about the same population with different assumptions, and results from the two should not be spliced into one trend line.
Scale also bounds what a percentage represents. With around 2.45 million homes in Scotland9, a single percentage point is roughly 24,500 homes, and a local finding drawn from 490 households28 is an evaluation of a programme, not a national estimate.
Revisions, breaks and series that stop
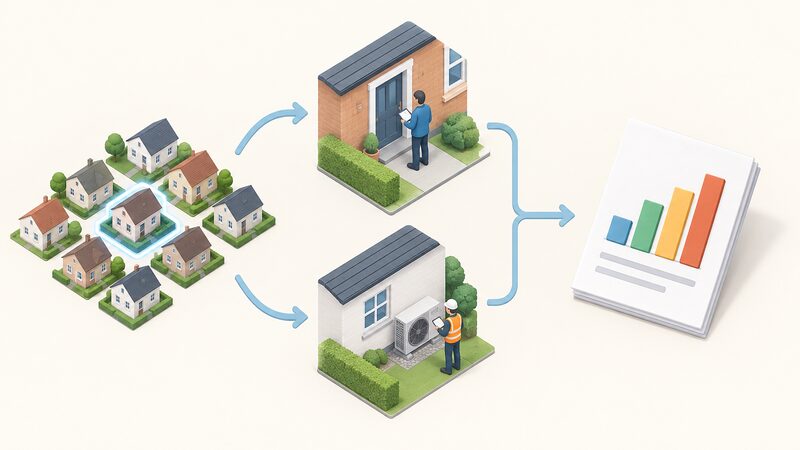
Three things break comparability, and all three occur in UK home energy data.
- A change of fieldwork method. The 2020 and 2021 Scottish Household Survey rounds moved to telephone interviewing, were published as experimental statistics, and are not directly comparable with other years7.
- Seasonality and quarter matching. EPC data has a seasonal pattern and is not seasonally adjusted, so it should only be compared between the same quarters across years3.
- Discontinuation. The ONS reviewed its outputs and decided to discontinue the Energy Efficiency of Housing statistics8.
Underlying rules move too. The Energy Performance of Buildings (England and Wales) Regulations 2012 revoked the 2007, 2008, 2009 and 2012 amendment regulations30, and later amendments in 2022 and 2024 changed the framework again, with the 2024 instrument defining assessment data as any data held that was collected during an energy assessment, whether or not it has been entered onto a register31. When the legal definition of what is recorded changes, the statistics built on that record change with it, even if nothing about the housing stock has changed.
Consumer tracking data shows the same problem from the other direction. Ofgem's 2023 supplier satisfaction findings recorded that both measures are now well below the tracking peaks recorded in 2019 and 202025. Read without the peak years in view, a single wave says very little.
Modelled, measured and administrative: three different numbers
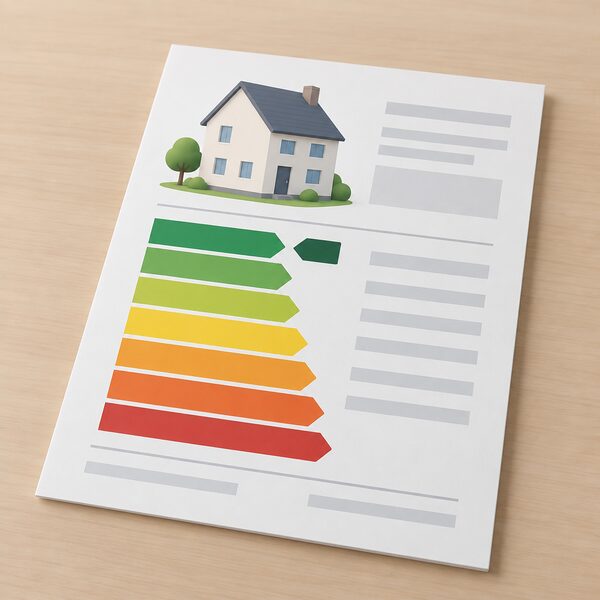
A great deal of UK home energy data is modelled rather than measured. The domestic EPC calculation is based on standard assumptions of occupancy and use, and does not take into account variations in occupant behaviour or state of repair, using a UK-wide calculation methodology managed by the UK Government with input from devolved administrations32. That is why an EPC band describes a building, not a bill.
Administrative data is different again: it counts transactions rather than homes. Ofgem publishes monthly reports on how energy suppliers are progressing towards their Energy Company Obligation targets and the number and types of measures installed33. NEED links consumption to property attributes, and heat pump deployment statistics are published quarterly for the UK with property type recorded as domestic34.
Measured consumption sits in a third category and moves with weather and behaviour. In 2024 UK consumption per household increased by 2.9 per cent, as consumption increased more sharply than the number of households35. In Scotland, domestic gas consumption fell 13% and electricity 12% since 20212. Modelled ratings, administrative counts and measured consumption will not tell the same story about the same year, and none of them is the corrected version of the others. The distinctions are set out further in measured versus modelled home energy performance and in SAP, RdSAP and the assumptions behind home energy ratings.
Reading a percentage: what the denominator covers
A percentage is only as useful as the population underneath it. The two main household surveys count different things: the English Housing Survey, first run in 1967, adds a physical inspection of a subsample of approximately 6200 of the respondents' dwellings, while the Scottish Household Survey invites a random sample of addresses in Scotland every year to build evidence on the characteristics, attitudes and behaviours of private households and individuals, and on the physical condition of Scotland's homes. A share of "homes" from one is not the same population as a share of "households" from the other.
| Measure | Figure | Population |
|---|---|---|
| Properties with an EPC, March 2025 | 1.4% England, 1.5% Wales8 | Certificated properties only |
| Detached properties, March 2025 | 3.2% England8 | Highest of any property type |
| New dwellings, March 2025 | 4.2% England8 | New build |
| Existing dwellings, March 2025 | 0.8% England8 | Existing stock |
| All UK homes | around 1%36 | Whole housing stock |
Every one of those is correct for its own denominator. A figure drawn from EPC records covers only properties that have a certificate; a new dwellings figure describes recent construction, not the stock a household actually lives in. Against these, the Climate Change Committee has said approximately 10% of existing UK homes will need to be heated by a heat pump by 2030, compared with approximately 1% today37, and evidence to Parliament notes 90% of UK homes have sufficient insulation and electrical capacity to operate a heat pump36.
The same discipline applies to scheme coverage. Energy Company Obligation delivery has been described as representing just over 9% of homes in Great Britain38, while in December 2020 Scotland saw an average of 118 measures per 1000 households, compared with 81 in Wales and 77 in England39. And on affordability, 36.4% of English households (8.91m) were spending more than 10% of income on domestic energy after housing costs in 2023, up from 20.5% (4.93m) in 202136: a measure defined by a threshold, which is not the same as the statutory fuel poverty definition used in fuel poverty statistics.
Where the data is published, and the documents behind it
The path from headline to source is usually short if the release is official. The Scottish Household Survey collection publishes questionnaires from 2003 to 2019, annual methodology and fieldwork outcomes reports, and a privacy notice, and the team can be contacted at shs@gov.scot5. The English Housing Survey live tables are updated each year and accompany the annual reports20.
For UK-level energy, the Digest of United Kingdom Energy Statistics is the annual energy statistics publication, with the 2016 edition published on 27 July 201740, and Energy Trends carries special feature articles, including experimental statistics on whole UK energy flow incorporating end use energy efficiency, published on 27 June 2019 as an eight-page PDF with accompanying data tables41. Postcode level domestic gas and electricity consumption data is published with its own guidance on what the data covers42. The local authority emissions statistics draw on the UK National Atmospheric Emissions Inventory and DESNZ statistics on energy consumption for local authority areas, and offer an interactive map where users can zoom in to any UK local authority, see area emissions, identify significant point sources such as iron and steel plants, and filter by sector and across the time series13.
Territorial extent is stated on the release and is easily missed. The Household Energy Efficiency Statistics headline release of June 2026 applies to England, Scotland and Wales43, while the English Housing Survey energy reports apply to England only20. Northern Ireland is frequently outside a "UK" home energy series and has to be picked up separately from NISRA23. A fuller map of producers is set out in who publishes UK home energy data and in official UK energy statistics publications.

Placing your own home in the data
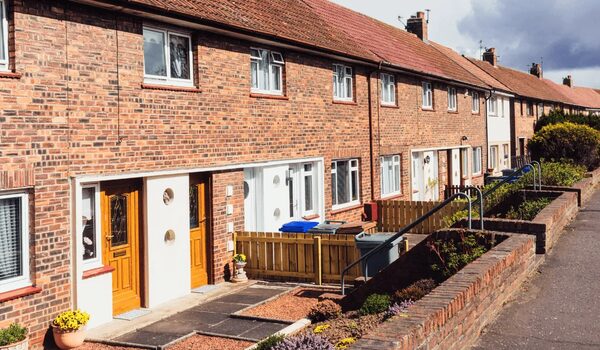
Statistics describe stock, not a specific house, but they give a household a position. The most useful cuts are by tenure, by dwelling type and by fuel. NEED analysis finds that around two-thirds of council or housing association houses have the highest EPC ratings A to C, compared with around 40% of houses in other tenure types2. ONS datasets cover energy efficiency, carbon dioxide emissions and central heating main fuel type for new and existing homes by property type, tenure and property age across national and subnational geographies44, with a five-year rolling version grouping dwellings by five-year periods45. Those sit behind pages such as EPC ratings: new build homes compared with older homes and social rent versus private homes.
Tenure also shapes what households know and what they can act on. In summer 2025, 48% of people living in owner-occupied homes were aware of the need to change home heating for net zero, against 32% in rented accommodation, with private renters at 40%46. For the private rented sector in England and Wales, a 2025 update proposed raising the minimum standard to the equivalent of EPC C by 2030, with a cost cap of £10,000 and a ten-year validity period for exemptions; the page was last updated on 21 January 202647.
Modelling also fills gaps that surveys cannot. MHCLG commissioned the Building Research Establishment to analyse English Housing Survey physical survey data from 2019 to estimate whether dwellings would pass or fail an updated Decent Homes Standard and the potential cost of bringing homes up to the revised standard48. That is a modelled cost built on measured inspections, and it should be quoted as an estimate rather than an observed figure.
What this means for a household's independence
Reading statistics well is itself a form of independence: it is the difference between accepting a supplier's or an installer's framing of a number and checking the release it came from. But the data itself records how dependent the housing stock remains. More than 2 million Scottish homes use mains gas or oil as their primary heating fuel22. Around 1% of UK homes have a heat pump36, against approximately 10% of existing homes needing one by 2030 on the Climate Change Committee's assessment37. Efficiency delivery reaches a minority of homes: just over 9% of homes in Great Britain through the Energy Company Obligation38.
There is a further dependence in the data itself. Almost every figure on this page comes from a government or regulator publication, and those can be discontinued, as the ONS energy efficiency housing statistics were8, or re-based when regulations change31. A household tracking its own position against national statistics is relying on a publication schedule it does not control, which is an argument for recording your own metered consumption alongside the published averages in average household gas and electricity consumption statistics and the wider market data collection.
Sources48 cited
- English Housing Survey 2024 to 2025: introduction and key findings, GOV.UK, 2026-01-29
- National Energy Efficiency Data-Framework report, summary of analysis 2026, GOV.UK, 2026-06-11
- EPC statistical release, July to September 2023, GOV.UK, 2023-10-26
- Equality impact assessment for the Heat and Buildings Strategy, GOV.UK, 2023-03-01
- Scottish Household Survey collection, Scottish Government, 2026-09-17
- Energy Consumer Satisfaction Survey summary report, January 2026, Ofgem, 2026-03
- Scottish Household Survey publications, Scottish Government, 2026-09-17
- Energy efficiency of housing in England and Wales: 2025, ONS, 2026-04-23
- Energy efficiency in homes, Scottish Government, 2026-09-17
- Household Energy Efficiency Statistical Release, March 2023, GOV.UK, 2023-03-30
- Energy Consumption in the UK 2025, GOV.UK, 2025-09-25
- UK Energy in Brief 2026, GOV.UK, 2026-07-30
- UK local authority and regional greenhouse gas emissions statistics, 2005 to 2024, GOV.UK, 2026-06-25
- NEED impact of measures data tables 2025, GOV.UK, 2025-06-26
- EPC statistics, England and Wales, April to June 2025, GOV.UK, 2025-07-31
- EPC statistics, England and Wales, January to March 2024, GOV.UK, 2024-04-25
- Energy efficiency characteristics of new dwellings, GOV.UK, 2026-02-04
- EPC statistics, England and Wales, July to December 2020, GOV.UK, 2021-04-01
- EPC statistics, England and Wales, July to September 2023, GOV.UK, 2023-10-26
- English Housing Survey 2021 to 2022: energy, GOV.UK, 2023-07-13
- English Housing Survey 2023 to 2024: low carbon technologies fact sheet, GOV.UK, 2025-05-15
- Tenements working group report: energy efficiency and zero emissions heating, Scottish Government, 2023-11-28
- CT0062: EPC band by household characteristics, Northern Ireland, NISRA, 2024-12-13
- Customers' satisfaction with their supplier, January 2025, Ofgem, 2025-05-13
- Customers' satisfaction with their supplier, supplier level findings, Ofgem, 2023-08-30
- Understanding consumers' energy tariff choices research report, Ofgem, 2024-03-29
- Tracking energy consumers' use of low carbon and flexible products and services 2025, Ofgem, 2025-06
- Energy Efficient Scotland Transition Programme survey evaluation, Scottish Government, 2022-08-08
- Customers' satisfaction with their supplier, July to August 2025, Ofgem, 2025-12-02
- Energy Performance of Buildings (England and Wales) Regulations 2012, schedules, legislation.gov.uk, 2012
- Energy Performance of Buildings (England and Wales) (Amendment) Regulations 2024, legislation.gov.uk, 2024-05-14
- Domestic EPC reform consultation, Scottish Government, 2021-07-23
- Energy Company Obligation contacts, guidance and resources, Ofgem, 2026-09-17
- Heat pump deployment quarterly statistics, UK, 2026 Q1, GOV.UK, 2026-06-11
- Energy Consumption in the UK (ECUK) 2025, GOV.UK, 2026-04-20
- Heating our homes, House of Commons committee report, UK Parliament, 2025-05-09
- UK off track for net zero, say country's climate advisors, Climate Change Committee, 2024-07-18
- ECO4 and Great British Insulation Scheme mid-scheme changes consultation, GOV.UK, 2024-11-14
- Tackling fuel poverty in Scotland: a strategic approach, Scottish Government, 2020-12
- Digest of UK Energy Statistics 2016, GOV.UK, 2017-07-27
- Experimental statistics on whole UK energy flow incorporating end use energy efficiency, GOV.UK, 2019-06-27
- Postcode level domestic gas and electricity consumption: about the data, GOV.UK, 2017-03-30
- Household Energy Efficiency Statistics, headline release June 2026, GOV.UK, 2026-06-25
- Energy efficiency of housing in England and Wales: 2025 release, ONS, 2025-10-28
- Energy efficiency of housing, England and Wales, five years rolling, ONS, 2025-10-28
- DESNZ Public Attitudes Tracker: heat and energy use in the home, summer 2025, GOV.UK, 2025
- Improving the energy performance of privately rented homes: 2025 update, GOV.UK, 2026-01-21
- EHS briefing: modelling a revised Decent Homes Standard, GOV.UK, 2025-07-02
 Official Energy StatisticsWhere can you find the government's official figures on UK energy prices and how much gas and electricity the country uses?
 Renewable Generation by NationHow much of our electricity comes from renewables, and why do the figures keep changing?
 Paid and Restricted Energy DataWhere can you actually read the numbers behind a news story about heat pumps or solar?
 Temperature Records and DatasetsWhen a headline says the world has hit a new temperature record, which numbers is it using, and why do different datasets disagree by a fraction of a degree?
 Fuel Poverty StatisticsWhy do fuel poverty figures differ across the UK, and why is there no single number for the whole country?
 Who Publishes Home Energy DataA directory of the organisations producing household energy numbers, from government departments and regulators to certification bodies, trade associations and charities.