

In this guide
CIBSE weather data is the set of weather files published by the Chartered Institution of Building Services Engineers for use in building performance and overheating assessment. The current data set is based on the more recent weather projections produced by the Met Office, produced in collaboration with the University of Exeter, and was announced alongside a revision of TM59, the methodology for assessing homes for overheating1. Both updates were planned for launch at the CIBSE Build2Perform Live event1.
The files matter to a household because they sit behind the calculations that decide whether a new or refurbished home is judged to overheat, how much heating and cooling energy a design is assumed to need, and which locations are treated as representative. CIBSE supports the use of local weather files rather than a single location, but has said the proposed application is far too limited because the local weather file would also be applied to the notional building2.
This page explains what the data is, who produces it, where it is used, how it relates to national energy statistics, and what it does not do. It also sets out the limits: the weather files are a commercial publication, they are not a live feed, and they are not the same thing as the weather correction applied to gas consumption data.
What CIBSE weather data is
CIBSE weather data is a published file set rather than a service. It supplies the hourly weather conditions that a dynamic simulation needs in order to model how a building behaves over a year: temperature, solar gain and the other variables that drive overheating risk and energy demand. It is one part of a wider family of CIBSE technical publications, which includes TM23 on testing buildings for air leakage, TM59 on overheating risk in homes and TM65 on embodied carbon in building services6.
The distinction that matters is between a weather file and a weather record. A weather record tells you what happened. A weather file used in assessment is a constructed year, assembled so that a design can be tested against a consistent set of conditions. That is why the provenance of the file, and its date, matter as much as the numbers inside it.
CIBSE's technical output is authored and reviewed by named practitioners. TM23, published in January 2022 and listed as active, is authored by Julie Godefroy of CIBSE6. TM65.1, published in December 2021, lists contributors from Feilden Clegg Bradley Studios, Julie Godefroy Sustainability, the Resource Efficient Built Environment Lab at Edinburgh Napier University, Elementa Consulting and Cundall7. The same editorial model applies across the technical memoranda, and it is the reason official guidance is willing to name CIBSE methods directly.
For a household, the practical consequence is that the weather file is not something a resident chooses. It is chosen by the assessor or designer, and it determines whether a home is modelled as comfortable or as overheating. The file is an input to a judgement about the building, not a measurement of the building.

Who CIBSE is: a professional engineering institution licensed by the Engineering Council

CIBSE is the Chartered Institution of Building Services Engineers, a professional engineering institution rather than a government department or a regulator. It publishes technical memoranda, responds to government consultations and issues policy positions. Its authority in assessment comes from that technical output being adopted by official guidance, not from any statutory power.
That adoption is explicit. The London Plan energy assessment guidance states that overheating modelling should use CIBSE guidance, and specifies dynamic overheating modelling3. The Scottish Government's consultation on building regulations energy standards states that the dynamic thermal analysis method uses CIBSE TM59, "Design methodology for the assessment of overheating risk in homes"4. When a planning authority or a building standards body needs a defensible method, it points at CIBSE.
CIBSE also takes positions on policy. It supports demand reduction and management measures, and it supports the approach that reliance on off-site carbon reductions should be minimised, with reductions demonstrated to be truly additional8. It recommends that members request Environmental Product Declarations for key items of plant when liaising with suppliers and manufacturers8. It supports the intent to improve handover procedures and information, including the Home User Guide2. None of these are regulatory requirements; they are the institution's stated positions.
The institution also publishes on embodied carbon. TM65.1 exists to help engineers understand the embodied carbon impact of heating and hot water equipment, at product level and at system level, so that informed design decisions can be made early in the design process, and its calculations follow the CIBSE TM65 methodology7. That is a different dataset from the weather files, but it comes from the same publisher and the same editorial process.
"CIBSE strongly supports the use of local weather files, rather than a single location (East Pennines) currently used f"
The Met Office basis: how the data set was produced and with whom
The current CIBSE Weather Data set is built on Met Office projections. CIBSE states that the new data set will be based on the more recent weather projections produced by the Met Office, and that it is produced in collaboration with the University of Exeter1. The announcement was made in July 2024, at the same time as the TM59 revision1.
That combination is significant. TM59 is the methodology used to assess homes for overheating, and CIBSE said it was revising it to ensure it reflects the latest advancements and insights1. A revised method paired with revised weather projections means the two inputs to an overheating assessment were being updated together, which is the sensible order of events: a method tested against outdated weather would produce conclusions that no longer hold.
The Met Office connection also places the data within a wider family of official climate and weather products. National statistics on average temperatures, heating degree days, wind speeds, sun hours and rainfall are published with data up to the end of December 20259. Those are observed statistics, not projections, and they serve a different purpose: they describe the recent past rather than constructing a year for design.
The Committee on Climate Change has identified the gap this work addresses. In its monitoring framework for a well-adapted energy system, it notes that some standards also use historical weather data and may need updating considering climate change5. That is the case for updating the projections: a design tested against a historical year may pass an assessment it would fail against a year that reflects the climate it will actually experience.
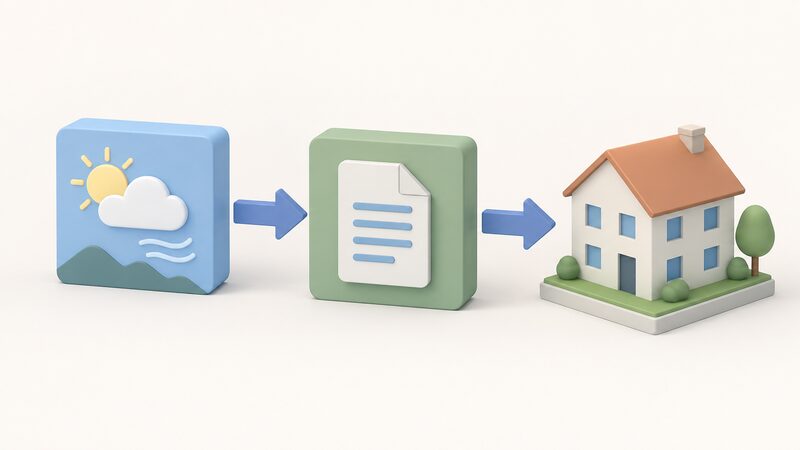
Why building design needs weather data
Weather is a load on a building, and design has to resist it. The Welsh Government's guidance on constructing a new roof, for example, requires the roof to resist weather10. That is the simplest expression of the principle: a building element is specified against the conditions it will meet.
Overheating is the other side of the same coin. CIBSE was prominently featured on BBC News discussing overheating homes amid high temperatures in England, and its Technical Research Manager, Zoe De Grussa, provided advice on keeping homes cool in an energy-efficient manner1. CIBSE published six suggestions for zero energy tips to keep cool, one of which is to keep windows closed during the hottest part of the day if it is hotter outside than inside1. Advice of that kind only makes sense if the assessment behind the building anticipated the hot conditions in the first place.
The regulatory direction of travel increases the weight on weather data. The New Build Heat Standard requires new buildings to install climate-friendly heating systems instead of oil and gas boilers11. CIBSE strongly supports the proposal to increase requirements on homes created by material change of use2. As the heating system changes, the balance between heating demand and cooling risk shifts, and the weather file becomes more, not less, important to getting the design right.
There is also a measurement dimension. CIBSE's TM23 covers testing buildings for air leakage, and it is listed as active6. Air tightness and weather interact: a dwelling that performs well in a mild modelled year may behave differently under sustained heat. The weather file is what allows a designer to test that, rather than assume it.
For a household, the point is that weather data is not an abstraction. It is the reason a home with large glazing on a south elevation may be required to include shading, and the reason a ventilation strategy is specified rather than left to the occupant.
Where the data is used in practice
The most direct use is overheating assessment. The Scottish Government's consultation states that the dynamic thermal analysis method uses CIBSE TM594, and the London Plan energy assessment guidance directs overheating modelling to CIBSE guidance3. Both are official documents, and both name the method rather than describing it loosely.
The second use is energy assessment more broadly. The Simplified Building Energy Model, or SBEM, is the national calculation method for non-domestic buildings, and official guidance states that SBEM assessors may utilise data held within the Product Characteristics Database for assessments as necessary12. The PCDB holds product performance data; the weather file supplies the conditions against which that performance is tested.
The third use is in the assessment data that sits behind certificates. The Energy Performance of Buildings (England and Wales) Regulations 2012, Schedule B1, Paragraph 2, sets out the data items from which an energy performance certificate for a residential building may be produced, and the list is long: address including postcode, energy rating and potential energy rating, building type and built form, inspection date, local authority area, constituency and county, date entered onto the register, transaction type, current and potential environmental impact ratings, primary energy use, CO2 emissions and emissions per floor area, lighting, heating and hot water costs, total floor area, energy tariff, gas network connection, floor level, glazing, extensions, rooms, fuel type, heating systems and controls, insulation, lighting, wind turbines, ventilation, solar water heating, unique property reference number, construction age band, tenure type, air permeability, and further building and heating detail items13. Weather conditions are an input to producing those ratings, even though they are not themselves a listed data item.
The fourth use is in local authority and regional emissions accounting. The UK local authority and regional greenhouse gas emissions statistics for 2005 to 2024 are compiled using nationally available datasets, with the main data sources being the UK National Atmospheric Emissions Inventory and the DESNZ Official Statistics on energy consumption for local authority areas14. Weather correction feeds into consumption statistics of that kind, which is why the two are often confused.

How the data relates to UK energy projections

Weather data and national energy statistics are related but distinct. The statistics describe what the country consumed; the weather file describes the conditions a design is tested against. Confusing the two leads to wrong conclusions about what a weather file can tell you.
The official statistics are published on a regular cycle. Energy consumption in the UK 2025 is accredited official statistics, last updated on 20 April 202615. UK energy in brief 2026 was last updated on 3 August 202616. The Energy Trends and Prices statistical release of 29 January 2026 covers average temperatures, heating degree days, wind speeds, sun hours and rainfall with data up to the end of December 20259. Those are the observed series that show how the recent past actually behaved.
Weather correction is applied in specific places. Ofgem's gas TDCV consultation states that the gas data is weather corrected at source17. The National Energy Efficiency Data Framework summary notes that electricity consumption is less affected by the weather, so that data has not been weather corrected18. The two fuels are treated differently, and the reason given is the sensitivity of each to temperature.
The projections that sit alongside these statistics are policy targets rather than weather files. The British Energy Security Strategy confirmed a revised target of 50 GW of offshore wind by 2030, including a sub-target of 5 GW of floating offshore wind19. That is a generation target, not a climate projection, and it does not feed into a building simulation.
Where the two do meet is in the assumptions behind policy. The Carbon Budget and Growth Delivery Plan heat and buildings factsheet notes that the factsheets are intended to summarise and prioritise current policy for investors and do not include previously unannounced policy20. That is a reminder that published figures carry a stated scope, and a weather file carries one too.
Limitations and what the data is not
The weather files are a commercial publication. No published price is given for them, so costs are quoted by the publisher or its distributors at the point of order, and no range should be assumed. That is a real constraint for a household trying to understand what sits behind an assessment: the input is not openly inspectable in the way that a national statistic is.
The data is not a live feed and it is not updated on a published annual cycle. The most recent revision was announced in July 20241. By contrast, official statistics carry explicit update dates: the Great British Insulation Scheme statistical release was updated at 09:30am on Friday 24 January 202521, and the August 2024 release is described as provisional and subject to future revisions22. A weather file carries no equivalent revision notice in the material available, so the publication date of the file set in use is the only guide.
The data is not a benchmark. Ofgem's price cap documentation states that outputs may not be used as a benchmark within the meaning of the EU Benchmark Regulation or the UK Benchmark Regulation23, and the same restriction appears in the default tariff cap documentation24. Weather files are not financial instruments, but the principle is worth stating: a published dataset often carries a restriction on what it may be used to claim.
The data is not the same as assessment data in the legal sense. The Energy Performance of Buildings (England and Wales) (Amendment) Regulations 2024 define assessment data as any data held that was collected during an energy assessment, whether or not that data has been entered onto a register, excluding green deal information and the name of an individual25. A weather file is an input to an assessment, not data collected during one.
Finally, the data is not a substitute for local judgement. CIBSE's own position is that local weather files should be used rather than a single location, and that applying one local file to the notional building as well as the actual building is far too limited2. That is a limitation of the proposed application, not of the file itself, but it affects what an assessment result means.

Using CIBSE weather data in household energy assessments
For a household, the weather file enters the process through the assessor. The choice of location is the first decision. For London, guidance points to London Weather Centre data for the Central Activity Zone and other high density urban areas3. Elsewhere, the principle CIBSE supports is a local file rather than a single national location2.
The second decision is the method. Overheating assessment uses dynamic thermal analysis with CIBSE TM594, and London guidance specifies dynamic overheating modelling using CIBSE guidance3. A household commissioning an assessment is therefore buying a method as well as a result.
The third consideration is what the assessment is for. If it supports a planning application, the local authority's guidance governs. If it supports an energy performance certificate, the data items in Schedule B1 govern what is recorded13. If it supports a retrofit decision, the relevant scheme rules apply: the Home Energy Team at the Centre for Sustainable Energy provides impartial energy advice to residents of Bristol and will check ECO Flex eligibility27.
The limits on independence are worth stating plainly. A household cannot choose its own weather file, cannot inspect the projections behind it without buying the publication, and cannot verify the result without access to the same method. What a household can do is ask which weather file was used, which location it represents, and when it was published. Those three questions establish whether the assessment rests on current projections or on a historical year that the Committee on Climate Change has already flagged as a gap in some standards5.
The wider context is that household energy data is becoming more granular. The National Energy Efficiency Data Framework summary of analysis for 2026 is one example of official work at dwelling level18. As that trend continues, the weather assumptions behind assessments will matter more to households, not less, because they will increasingly be the difference between a modelled result and a measured one.
Sources27 cited
- BBC News highlights CIBSE's expertise on managing overheating in homes, CIBSE, 31 July 2024
- The Future Homes and Buildings Standards, CIBSE
- Energy assessment guidance, Greater London Authority, June 2022
- Scottish building regulations: proposed changes to energy standards, Scottish Government, 23 July 2021
- Well-adapted energy system, Climate Change Committee, 19 September 2026
- TM23: Testing buildings for air leakage (2022), CIBSE, January 2022
- TM65.1 Embodied carbon in building services: residential heating, CIBSE, December 2021
- CIBSE guidance to deliver net zero carbon buildings and how it relates to LETI, CIBSE
- Energy Trends and Prices statistical release: 29 January 2026, DESNZ, 29 January 2026
- Building regulations: constructing a new roof, eg extension, Welsh Government
- New Build Heat Standard factsheet, Scottish Government, 1 January 2025
- National Calculation Method Product Characteristics Database, NCM PCDB
- The Energy Performance of Buildings (England and Wales) Regulations 2012, Schedule B1, Paragraph 2, legislation.gov.uk, 25 April 2024
- UK local authority and regional greenhouse gas emissions statistics, 2005 to 2024, DESNZ, 25 June 2026
- Energy consumption in the UK 2025, DESNZ, 20 April 2026
- UK energy in brief 2026, DESNZ, 3 August 2026
- TDCV 2023: Call for Input, Ofgem, February 2023
- National Energy Efficiency Data Framework: need report summary of analysis 2026, DESNZ, 11 June 2026
- Energy generation in Wales 2021, Welsh Government, December 2022
- Carbon Budget and Growth Delivery Plan: heat and buildings factsheet, DESNZ, 23 June 2026
- Great British Insulation Scheme release: January 2025, DESNZ, 24 January 2025
- Great British Insulation Scheme release: August 2024, DESNZ, 22 August 2024
- Energy price cap levels: 1 July to 30 September 2026, Ofgem, May 2026
- Default tariff cap level: 1 April 2024 to 30 June 2024, Ofgem, February 2024
- The Energy Performance of Buildings (England and Wales) (Amendment) Regulations 2024, legislation.gov.uk, 14 May 2024
- The Energy Performance of Buildings (England and Wales) (Amendment) Regulations 2024 (PDF), legislation.gov.uk, 14 May 2024
- Energy Companies Obligation, Bristol City Council
 CIBSE TM59 OverheatingWill your new home get too hot in summer?
 Future Weather and Climate DataHow hot will British summers get, and will your home cope?
 UK Cooling DemandPublished data on air conditioning ownership and home overheating, with projections for summer temperatures in each UK nation, and what rising cooling demand means for summer electricity use.
 Overheating and Hot WeatherIs your home getting uncomfortably hot in summer, and is there anything you can do about it?
 Part O OverheatingHow will your new home stay cool in summer?
 Temperature Records and DatasetsWhen a headline says the world has hit a new temperature record, which numbers is it using, and why do different datasets disagree by a fraction of a degree?