

In this answer
Short answer
HeatpumpMonitor.org is the public face of the Heat Pump Monitor platform, an open-source project run by the OpenEnergyMonitor community. It collects measured performance data from real UK heat pumps, self-reported by owners using Open Energy Monitor equipment, and publishes it alongside details of the building and the system. The platform dataset covered 383 systems as of May 20261.
The headline finding is that monitored systems perform well. Systems on the Heat Pump Monitor platform operate, on average, at 39% higher efficiency than systems installed under the Electrification of Heat programme1. An SPF of 4.0 means that for every 1 kWh of electricity consumed, the heat pump delivers 4 kWh of heat1. That is well above the 3.1 SPF that heat pumps tend to run at in general use2.
The value of the site is that it replaces modelled performance with measured performance. It shows the measured efficiency alongside information about the heat pump being used, the age and type of building, insulation levels, and so on3. For a household trying to judge what a heat pump might actually deliver, that is a different kind of evidence from a laboratory rating.
What HeatpumpMonitor.org is, and who runs it
HeatpumpMonitor.org is not a government service, a regulator's database or a manufacturer's marketing tool. It is an open-source project from the OpenEnergyMonitor community, the same group behind the heatloss.js heat loss tool, which is open source and free to use4. Systems are contributed by their owners, who install Open Energy Monitor equipment and share the resulting data.
That ownership model shapes what the data is. It is a self-selected sample: households who monitor their heat pumps are, by definition, interested in how they perform, and the systems in the dataset are those their owners chose to instrument. The platform dataset covered 383 systems as of May 20261. That is a meaningful body of measured evidence, but it is not a random sample of UK installations.
The wider policy context matters here. The public's interest in and understanding of heat pumps is low, according to a parliamentary research briefing5. Independent work has recommended improving the measurement of building performance rather than using estimations, monitoring the performance of installed heat pumps, and sharing the results through a database of case studies3. HeatpumpMonitor.org is one answer to that recommendation, built by the community rather than commissioned by government.
For a household's energy independence, the significance is informational rather than physical. The site does not reduce dependence on the grid or on a supplier. What it does is let a household see what a heat pump of a given type, in a building of a given age and insulation level, has actually achieved in someone else's home. That is a check on the claims made in a sales visit.

What the data shows: measured efficiency alongside building and system details
Each entry on the platform pairs a performance figure with the context that produced it. It shows the measured efficiency alongside information about the heat pump being used, the age and type of building, insulation levels, and so on3. That pairing is the point: an efficiency number on its own says little, because the same heat pump in a poorly insulated solid-wall house and in a modern cavity-walled house will not deliver the same result.
The comparison with the Electrification of Heat Demonstration Project is the most striking figure in the dataset. Systems on the Heat Pump Monitor platform operate, on average, at 39% higher efficiency than systems installed under that programme1. The two datasets are not identical in method or population, so the gap reflects both installation quality and the fact that monitored owners tend to tune their systems.
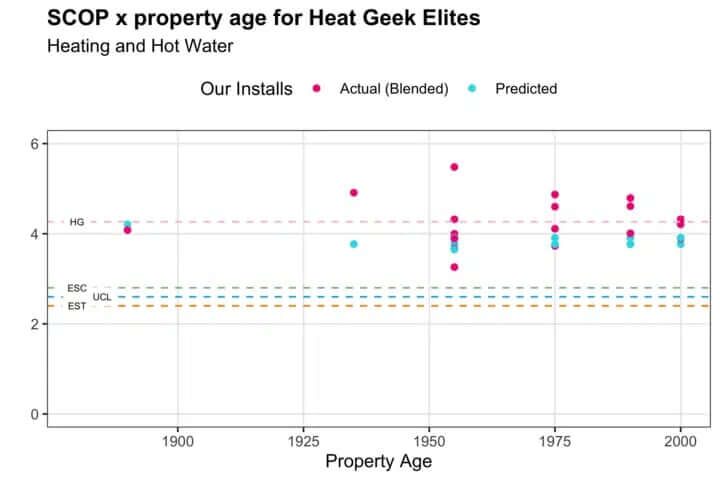
The spread within the data is wide. Indicative SPF values recorded from systems' own monitoring ranged from 1.3 to 5.81. That range is the honest headline: a heat pump can perform poorly or very well, and the difference is largely down to design, commissioning and control rather than the box on the wall.
Independent guidance supports that reading. A good quality heat pump installation that is managed well and controlled appropriately can get an SPF significantly higher than 3.1, sometimes more than 42. The monitored dataset is where those higher figures can be seen in the field rather than asserted in a brochure.
How efficiency is measured: SPF at the SEPEMO H4 boundary
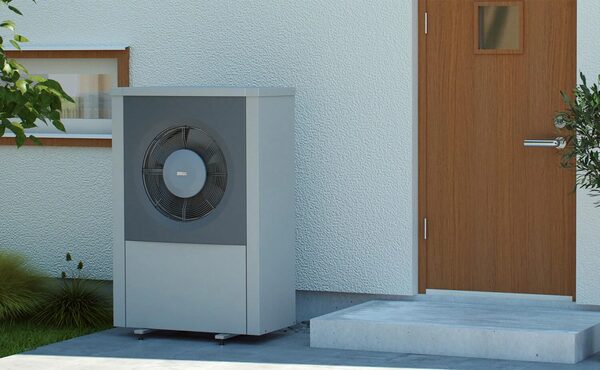
The platform reports seasonal performance, not instantaneous efficiency. Independent guidance describes the Seasonal Coefficient of Performance (SCoP) or Seasonal Performance Factor (SPF) as showing efficiency averaged across the whole year6. That is the right measure for a heating system, because a heat pump's efficiency varies with outdoor temperature and flow temperature across the season.
The boundary matters as much as the number. Because SPF can be calculated using different boundary definitions, performance values are only comparable when boundaries match7. The SEPEMO boundaries run from H1, covering the heat pump unit alone, through to H4, which extends the boundary to include the circulation pumps and other system components that a real installation needs. An H4 figure is therefore lower than an H2 figure for the same system, because it accounts for more of the electricity actually consumed.
This is why a household comparing a manufacturer's quoted COP with a monitored SPF is comparing two different things. The manufacturer's figure is typically a laboratory rating at a fixed condition; the monitored figure is a seasonal average across a real building. The H4 boundary is the more honest basis for a running cost estimate, because it captures the pumps and controls that run alongside the compressor.
Official methodology for heat pump performance uses EN 14825 test data in combination with calculations from BS EN 15316-4-2:20178. That is the regulatory route to a performance figure. Monitoring at the H4 boundary is the field route, and the two will not agree exactly.
"Because SPF can be calculated using different boundary definitions, performance values are only comparable when boundaries match."
What the results show so far: a mean SPF of 4.0
The central result is that a well-monitored, well-run system can reach a mean SPF around 4.0. An SPF of 4.0 means that for every 1 kWh of electricity consumed, the heat pump delivers 4 kWh of heat1. Against a general expectation of 3.1 SPF2, that is a substantial difference in running cost for the same heat output.
The range across the dataset is the caveat. Indicative SPF values recorded from systems' own monitoring ranged from 1.3 to 5.81. A system at 1.3 is performing worse than a resistive heater would in some conditions; a system at 5.8 is performing exceptionally. The mean sits between those extremes, and the distribution matters more than the average for any individual household.
Ground source systems sit at the upper end of what is achievable. A typical ground source heat pump can generate 3.5 to 4.5 units of heat for each unit of electricity it uses9. That is a manufacturer-independent range for the technology, and it aligns with the better-performing monitored systems.
What drives the difference between a 3.1 and a 4.0 is not the refrigerant or the brand. It is the design of the system, the flow temperature it runs at, the quality of commissioning, and how the household controls it. Independent guidance is explicit that running costs depend on how the heat pump is designed, how it is controlled, and the electricity tariff10. The monitored data is the evidence base for that claim.
What it takes to join: meters, a data logger and 10-second logging
Contributing to the platform means instrumenting the system properly. The monitoring hardware is Open Energy Monitor equipment, logging at 10-second intervals3. That resolution is what allows the platform to separate the heat pump's electricity consumption from the rest of the house and to calculate a seasonal figure rather than a spot reading.
The metering requirements follow the pattern set by official monitoring schemes. A heat meter must include a flow sensor, a matched pair of temperature sensors and a digital calculator7. A metering and monitoring package includes, as a minimum, high specification heat meters, electricity meters and temperature sensors7. The electricity metering is not always a single unit: one electricity meter is needed where the heat pump is incorporated into a single unit, two where the heat pump is composed of two units, plus one for immersion heating where domestic hot water is supplied by the heat pump, with a minimum of one electricity meter always required7.
The regulatory background is worth knowing even for a voluntary platform. Metering for performance is required for all heat pump installations accredited from 22 May 20187. Applicants who applied on or after that date with a heat pump are required to be metered for performance and can apply for the Metering and Monitoring Service Package to fulfil that criterion11. A household's heat pump must be metered for performance if it was installed on or after 22 May 2018 under those scheme rules12.
For a household joining HeatpumpMonitor.org, the practical requirement is a heat meter on the heating circuit, electricity metering on the heat pump supply, temperature sensors, and a data logger that can publish to the platform. The cost of that hardware is not published by the platform, and prices are installer-quoted.
Privacy and open data: private dashboards, public sharing, open licence
Owners control what is shared. A system can be kept private on its own dashboard and made public later, which matters for households who want to see their own data before deciding whether to publish it. The underlying tools are open source and free to use4, so there is no licence fee and no vendor lock-in on the software side.
Where a scheme does publish data, the scope is usually narrow. The only heat pump information that will be made publicly available is on the first tab of the spreadsheet, A1_Summary13. That is a useful contrast: a public monitoring platform can publish far more than a grant scheme does, because the owner chooses to.
Transparency in energy data has a track record of changing behaviour. Billing transparency has been identified as a major user need, building trust in the system and enabling consumers to potentially reduce their costs14. The same logic applies to heat pump monitoring: a household that can see its own seasonal performance can see the effect of a change in flow temperature or scheduling.
The limits are real. The platform depends on the OpenEnergyMonitor community, on owners continuing to log, and on hardware that a household has to buy and maintain. It is not a substitute for a manufacturer's warranty record or a service history. And the dataset is self-selected, so it should be read as evidence of what is achievable rather than as a national average.

Where the data sits against the rest of the evidence
HeatpumpMonitor.org is one of several sources a household can use, and it is worth knowing how they differ. Government deployment statistics run on a quarterly cycle: the June 2026 release presents the latest statistics up to the end of June 2026, with the next release in December 202615. Those statistics are published to inform users about the levels of heat pump deployment and to enable user feedback, as well as further methodological development, and their status is under regular review and may be subject to change16.
Coverage differs between datasets. The MCS Data Dashboard covers around 60% of heat pumps used in residential space heating installations17. That is a large share of the market but not all of it, and it is a different kind of coverage from a monitored platform's 383 systems.
Independent consumer guidance gives the general expectation: at current energy prices, running costs for heat pumps are around the same as for a new gas boiler18. Upfront, running and installation cost make up approximately 15 to 20%, 55 to 65% and 20% respectively of the total cost of a heat pump over its lifetime19. That split is why measured performance matters more than purchase price over the life of the system.
For a household's energy independence, the honest position is this. A heat pump moves a home off gas and onto electricity, which reduces dependence on the gas network and on imported gas, but it increases dependence on the electricity grid and on a supplier. Monitoring does not change that. What it does is give the household the measured evidence to run the system well, and to know whether it is running well. That is a form of independence over the running cost, if not over the supply.

Sources19 cited
- Monitoring your heat pump's performance, Centre for Alternative Technology, 2025-06-29
- Heat pump questions answered, Energy Saving Trust, 2026-05-27
- Monitoring and metering, iDM Energie, 2026-07-06
- heatloss.js, OpenEnergyMonitor, 2026-09-17
- Research briefing: heat pumps, UK Parliament, 2026-09-19
- In-depth guide to heat pumps, Energy Saving Trust, 2026-07-16
- Domestic RHI: Guide to metering, Ofgem, 2022-03
- Heat pump methodology, Department for Energy Security and Net Zero, 2026-01
- Ground source heat pump costs and savings, Which?, 2026-05-08
- Ground source heat pumps, Energy Saving Trust, 2026-07-16
- Installers and optional monitoring, Ofgem, 2026-09-17
- Eligible heating systems, Ofgem, 2026-09-17
- Connecting electric vehicles and heat pumps to the networks, Energy Networks Association, 2026-09-17
- Domestic consumer views on heat networks, Ofgem, 2026-06-25
- Heat pump deployment statistics: June 2026, Department for Energy Security and Net Zero, 2026-09-10
- Heat pump deployment statistics: March 2026, Department for Energy Security and Net Zero, 2026-06-11
- From Carbon to Competitiveness, Heat Pump Association, 2026-03
- Heat pump fact check, Energy Saving Trust, 2026-07-01
- EINAS 2025: heat and buildings, Department for Energy Security and Net Zero, 2025-06
 How They Perform in UK HomesHow well do heat pumps really work in UK homes, and why do some run far better than others?
 Which Homes Suit a Heat PumpMost UK homes can have a heat pump fitted, so the real question is whether yours makes it easy or expensive.
 Heat Pump Install StatisticsHow many heat pumps are actually being fitted in the UK each year, and is that number going up?
 The Full Statistics GuideHow many homes in the UK have solar panels, heat pumps or batteries?
 Demonstration and Test HomesBefore new heating systems reach your home, they get tested in real houses with real people living in them.
 Public Attitudes to Home EnergyWhat do people in the UK really think about heat pumps, solar panels and smart meters?