

In this guide
Heat pumps in UK homes deliver a seasonal performance factor (SPF) of around 3.1 in typical operation, according to Energy Saving Trust, and a good quality installation that is managed and controlled well can reach significantly higher than that, sometimes more than 41. That single range is the answer to most questions about real world heat pump performance in the UK, but it hides a spread that matters more than the average. Monitored systems in one government-commissioned study recorded SPF values from 1.3 to 5.82.
The gap between those two numbers is not explained by the technology. It is explained by design, commissioning and control. Parliamentary research states plainly that heat pumps are technically suitable for most UK homes if installed appropriately3, and the monitored evidence supports that: the installations that perform well are the ones where the system was sized correctly, the emitters were upgraded where needed, and the controls were set up to run at low flow temperatures.
This page sets out what the monitored data actually shows, what the performance figures mean, how the Electrification of Heat demonstration project performed across 742 installations, and where the evidence on running costs and suitability is weaker than the headline numbers suggest.
What real-world data exists on UK heat pump performance
The UK has three main bodies of monitored evidence on how heat pumps actually perform in homes, and they measure different things.
The first is the government's quarterly heat pump deployment statistics, which count hydronic heat pumps with a capacity up to 45kW installed in the United Kingdom7. These are published as Official Statistics in development, meaning the methodology is still being refined8. They cover retrofit installations in existing properties that are MCS certified, and they are a count of installations rather than a measure of performance9. In 2026 Q2, England recorded 8,527 installations9.
The second is the Electrification of Heat demonstration project, run by Energy Systems Catapult, which installed 742 heat pumps across three regions of Great Britain in a wide range of house types5. This is the closest thing the UK has to a controlled field trial, and it is the source of most of the detailed performance data quoted in policy documents.
The third is the secondary analysis of monitored heat pump performance data from over 1,100 UK heat pump installations, cited in government guidance on the heat pump transition2. This is the largest monitored dataset referenced in official publications, and it is where the 1.3 to 5.8 SPF range comes from.
Each of these has a different purpose. The deployment statistics tell you how many units are going in. The Electrification of Heat project tells you what happened when a representative sample was installed and monitored. The secondary analysis tells you what the installed base looks like when you pool monitoring data from systems that householders and installers have chosen to meter.
Seasonal performance factor: what the numbers mean

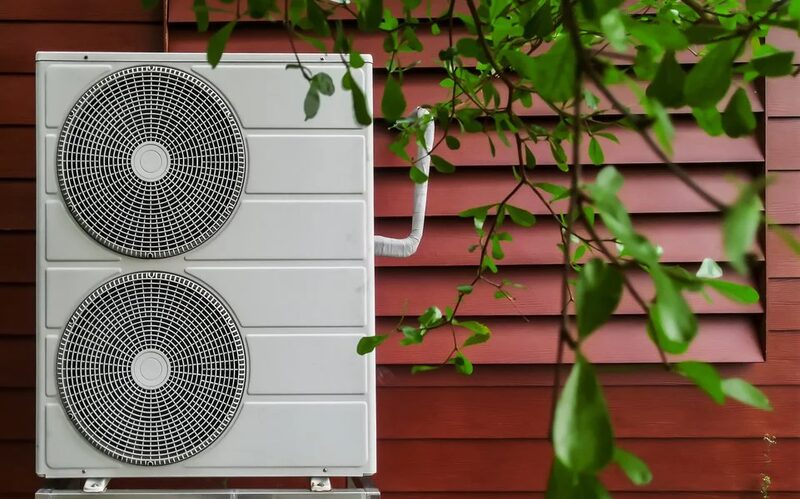
SPF is the ratio of heat delivered to total electrical energy supplied over a year. A heat pump with an SPF of 2.5 delivers on average 2.5 kWh of heat for every 1 kWh of electricity it uses11. An SPF of 4.0 means that for every 1 kWh of electricity consumed, the heat pump delivers 4 kWh of heat2. The definition is simple; the measurement is not.
Since 25 March 2016, installers have calculated the SPF using the SCOP value from the MCS website, entered directly into the MCS database11. That means the SPF figure on a certificate is a modelled value derived from standard test conditions, not a metered figure from the installed system. The distinction matters when comparing sources: a modelled SPF and a monitored SPF are not the same quantity, and a system that performs at its modelled SPF in practice is doing well.
The test basis for the modelled figure is EN 14825 test data used in combination with calculations from BS EN 15316-4-2:2017 to calculate the performance of heat pumps providing space heating12. This is a European standard method, and it produces a figure that is comparable between products but not necessarily representative of any individual installation.
For scheme eligibility, the minimum has been an SPF of 2.5. The Domestic RHI required all heat pumps to have a minimum SPF value of 2.513, and the Boiler Upgrade Scheme guidance states heat pumps must have a minimum Seasonal Performance Factor of 2.515. The Heat Pump Ready Programme Round 2 innovation funding competition set a higher bar for projects affecting energy performance: a seasonal performance factor of at least 3.5 in a real-world home environment by the end of the project16.
That progression, from a 2.5 eligibility floor to a 3.5 real-world requirement for funded innovation, is the clearest signal in the official documents about what is considered achievable rather than merely acceptable.
Measured efficiency: SPF 3 to 4 for air source, above 4 for ground source
The distribution of measured performance across the installed base is more informative than any single average, and the Domestic RHI quarterly data gives the clearest picture.
For air source heat pumps, 37% of installations registered SPF levels in the 3.4 to 3.6 range4. For ground source heat pumps, 53% of installations registered SPF levels between 3.7 and 4.34, and 21.5% of ground source installations registered an SPF of 4.14. Ground source systems therefore cluster higher, which is consistent with the more stable source temperature of the ground.
| Technology | Concentration of installations | SPF band |
|---|---|---|
| Air source | 37% of installations | 3.4 to 3.64 |
| Ground source | 53% of installations | 3.7 to 4.34 |
| Ground source | 21.5% of installations | 4.14 |
Energy Saving Trust's guidance sits alongside this data: heat pumps tend to run with an SPF of 3.1, but a good quality installation that is managed well and controlled appropriately can get an SPF significantly higher than 3.1, sometimes more than 41. The two sources are not in conflict. The 3.1 is a central tendency across the installed base; the RHI distribution shows where the mass of installations sits for each technology; and the higher figures describe what well-commissioned systems achieve.
The practical reading is that an air source heat pump delivering an SPF in the mid threes is performing as the bulk of the installed base does, and a ground source system delivering above 4 is likewise typical of its category rather than exceptional. A system below 3 is underperforming relative to the distribution, and the monitored range down to 1.3 shows that underperformance is real and not rare2.
The Electrification of Heat Demonstration Project: 742 installations across Britain
The Electrification of Heat demonstration project is the most detailed UK field trial of heat pump performance, and its design is worth understanding because it shapes what the results can and cannot tell you.
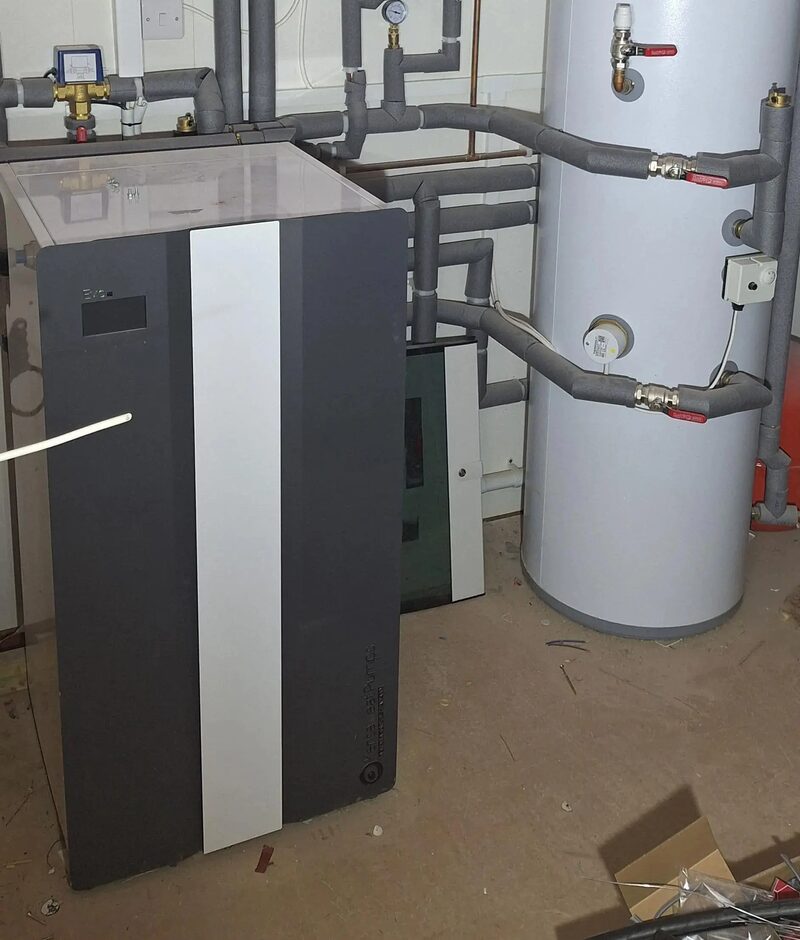
The project aimed to install up to 750 heat pumps in three regions across Great Britain, and 742 heat pumps were installed across those regions in a wide range of house types5. The target was up to 750 homes, the majority on the gas grid, in a representative range of housing6. Of the installed heat pumps, 21% were hybrid heat pumps6.
The representative sampling matters. Because the project deliberately covered a range of house types and drew most of its homes from the gas grid, its results describe what happens when heat pumps are fitted to ordinary gas-heated housing rather than to a self-selected group of early adopters with favourable properties. That is a harder test than a trial run on new-build or extensively retrofitted homes, and it is the reason the project is cited so heavily in policy documents.
The project also produced the finding that 163 heat pumps were successfully installed in pre-1945 properties, showing that the challenges of older housing can be overcome17. That figure is the direct answer to the question of whether older homes can take a heat pump: they can, and the project demonstrated it at scale rather than in isolated cases.
The hybrid share is a reminder that not every installation in the trial was a full heat pump replacement. A hybrid system pairs a heat pump with a boiler, and the performance of a hybrid is not directly comparable with a full heat pump because the boiler carries part of the load. When comparing SPF figures between studies, the proportion of hybrids in the sample is one of the variables that explains divergence.
Performance in older and harder-to-heat homes
Older housing is the case most householders want answered, and the evidence is more encouraging than the reputation of pre-1945 stock suggests.
Parliamentary research states that heat pumps are technically suitable for most UK homes if installed appropriately3. The Electrification of Heat project installed 163 heat pumps in pre-1945 properties, showing that the challenges these homes present can be overcome17. Energy Saving Trust's guidance on property types makes the same point from the installation side: heat pumps are suitable across property types from flats to terraced houses17.
What older homes require is more attention in three areas. The first is fabric: a less insulated home needs more heat, which means a larger heat pump and larger emitters. The second is emitters: radiators sized for a gas boiler running at a high flow temperature are often too small for a heat pump running at a lower one, and the historical installation problems identified by Energy Saving Trust include installers failing to upgrade radiators1. The third is pipework: the same guidance identifies failure to replace narrow bore pipework and failure to properly insulate pipework as recurring issues1.
Energy Saving Trust notes that these issues are much less common as standards have tightened1. That is an important qualification. The poor installations that drag the monitored average down are largely historical, and the direction of travel in the standards is toward the design and commissioning practices that produce the higher SPF figures.
The policy context reinforces why older homes matter. The Climate Change Committee's Balanced Pathway has 52% of existing homes in the UK needing to be heated using a heat pump in 2040, compared to around 1% in 202316. Since most of the existing stock is older housing, that pathway cannot be met without heat pumps working in pre-1945 homes at scale.
Running costs: what a typical SPF means for bills

The relationship between SPF and bills is arithmetic, but the arithmetic depends on the price of electricity relative to gas, and that ratio is where the running cost case is decided.
Government guidance is direct on the point: reducing the price of electricity relative to gas would make heat pumps more competitive3. That statement is an acknowledgement that at current price ratios, a heat pump's running cost advantage is not automatic, even at a good SPF. A heat pump delivering an SPF of 3.1 uses roughly one unit of electricity for every three units of heat, so its running cost relative to a gas boiler depends on whether electricity costs less than about three times the price of gas per unit of delivered heat.
The monitored spread changes the picture for individual households. A system at the top of the observed range, near 5.8, will cost substantially less to run than one at the bottom near 1.3, on the same tariff2. That is why the design and commissioning factors matter for bills and not just for performance figures: the difference between a well-commissioned system and a poorly commissioned one is a running cost difference, not a rounding error.
On carbon, the position is clearer than on cost. Heat pump technology currently offers a carbon saving of up to 65% compared with a gas boiler18, and Welsh Government guidance puts the potential reduction in a home's heating carbon footprint at up to 70%19. These are carbon figures, not bill figures, and they hold regardless of the electricity to gas price ratio.
For households weighing the decision, the honest summary is that the performance evidence supports heat pumps delivering three to four units of heat per unit of electricity in typical UK installations, and that whether that translates into lower bills depends on the tariff and the price ratio rather than on the heat pump alone.
Where heat pumps fall short: insulation, flow temperatures and suitability
The limits are real and worth stating as firmly as the benefits, because they determine whether a heat pump is the right answer for a particular home.
The first limit is installation quality. Energy Saving Trust identifies the historical problems directly: poor quality installations where installers do not size systems correctly, upgrade radiators, replace narrow bore pipework, or properly insulate pipework1. These are not faults of the technology, but they are faults that occur, and they are the main reason monitored performance spans 1.3 to 5.8 rather than clustering tightly2.
The second limit is awareness and understanding. Government guidance states that the public's interest in and understanding of heat pumps is low3. That is a market condition rather than a technical one, but it affects outcomes: a household that does not understand how to run a heat pump at low flow temperatures will not get the performance the design intended.
The third limit is the pace of the market itself. The number of heat pump units installed in the UK is just 7% of that in France20, and the UK currently has a limited domestic heat pump manufacturing sector, meeting just over 30% of UK demand20. A household installing a heat pump today is therefore buying into a market that is still small by European standards, with the supply chain and installer base still developing.
The suitability question is separate from the performance question. Parliamentary research states heat pumps are technically suitable for most UK homes if installed appropriately3, and the Electrification of Heat project demonstrated this in 163 pre-1945 properties17. The limits are therefore about the quality of the installation and the readiness of the household to run the system well, not about whether the technology can work in a given building.
How to check performance yourself: HeatpumpMonitor.org and metering
A household that wants to know how its own system is performing, rather than how the average performs, needs metering, and the UK has both an open monitoring community and a formal metering requirement in the grant schemes.
The formal requirement sits in the scheme rules. For heat pumps installed on or after 22 May 2018, the heat pump must be metered for performance13. That requirement exists because the schemes pay on measured or modelled performance, and metering is how the figure is verified.
The open data side is the monitored dataset of over 1,100 UK heat pump installations, which is the basis for the secondary analysis cited in government guidance2. That dataset is drawn from systems whose owners have chosen to monitor them, and it is the source of the 1.3 to 5.8 range. It is not a random sample of the installed base, so it should be read as evidence of what is achievable and what can go wrong rather than as a national average.
For a householder, the practical steps are to check the SPF figure recorded for the installation, to understand whether it is a modelled SCOP-derived figure or a metered one, and to compare it against the distribution rather than against a single number. A system in the mid threes is performing as the bulk of air source installations do4. A system below 3 is worth investigating, because the monitored evidence shows that the causes are usually identifiable: sizing, emitters, pipework or controls1.
The government's own check service compares the cost and carbon emission savings available and what is needed to install a heat pump21, and Manchester City Council directs residents to the Clean Energy website to find out whether they can get a grant22. These are suitability and funding checks rather than performance checks, but they are the starting point for a household assessing its own position.
Who produces the evidence: Nesta and Energy Systems Catapult
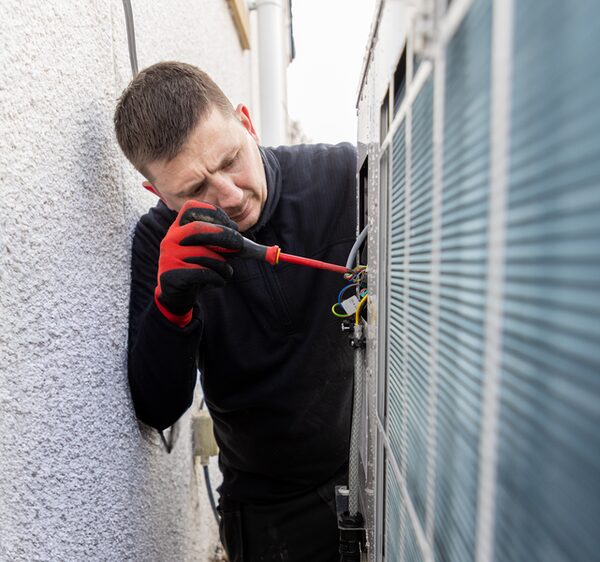
The UK's heat pump evidence base is produced by a small number of organisations, and knowing who they are helps in weighing what each figure means.
Energy Systems Catapult ran the Electrification of Heat demonstration project, which installed 742 heat pumps across three regions of Great Britain5. The organisation's consultation responses set out its position on how the market should be regulated: it argues that clear and adaptable definitions that can evolve with new technologies are critical to reduce regulatory uncertainty and support innovation, and that regulation must be proportionate and risk-based, because high fixed compliance costs risk excluding smaller and innovative providers23. It supports graduated or threshold-based requirements that scale with customer numbers, controllable load and system impact, alongside lighter-touch approaches for low-risk actors23. On consumer protection, it states that transparency, consent, user control, safety and fair exit must be guaranteed23.
Nesta is a registered charity in England and Wales, number 1144091, and in Scotland, SC04283324. Its mission is to reduce home carbon emissions in the UK by 30% by 203024, and in 2024 it worked on developing and testing innovations addressing the opportunities and challenges facing networked heat pumps24. Its relevance to performance evidence is that it works on the market and policy conditions that determine whether well-performing installations become the norm.
The Heat Pump Ready Programme is the government's innovation funding route, and its Round 2 competition required projects affecting energy performance to achieve a seasonal performance factor of at least 3.5 in a real-world home environment by the end of the project16. One funded project, on the role of measured building performance in heat pump specification, system design and management, is led by Build Test Solutions with Veritherm UK and Elmhurst Energy Services Ltd as partners25. That project addresses the measurement gap directly: better measured building performance data feeding into specification and design is the mechanism by which the spread between best and worst installations narrows.
The overall picture from these bodies is consistent. The technology performs well when the system around it is designed and commissioned properly, the evidence base is growing but still smaller than the market needs, and the main lever on performance is installation quality rather than the heat pump itself.
Sources25 cited
- Heat pump questions answered, Energy Saving Trust, 2026
- Carbon footprint report: heat pump transition, GOV.UK, 2026
- Heat pumps and the transition to net zero, UK Parliament POST, 2025
- Domestic Renewable Heat Incentive Quarterly Report Issue 36, Ofgem, 2023
- From flats to terraced houses, heat pumps are suitable for all property types, Energy Saving Trust, 2024
- Electrification of Heat: home surveys and install report, Energy Systems Catapult, 2022
- Heat pump deployment statistics: June 2026, GOV.UK, 2026
- Heat pump deployment quarterly statistics UK Q2 2026, GOV.UK, 2026
- Heat pump deployment statistics: March 2026, GOV.UK, 2026
- How to ensure a successful transition to heat pumps for households at risk of fuel poverty, GOV.UK, 2026
- Domestic RHI Essential guide, Ofgem, 2022
- HEM-TP-12 heat pump methodology, GOV.UK, 2026
- Domestic RHI: eligible heating systems, Ofgem, 2026
- Domestic RHI Essential Guide, Ofgem, 2024
- Boiler Upgrade Scheme guidance, Ofgem, 2023
- Heat Pump Ready Programme Round 2 innovation funding competition, GOV.UK, 2026
- Heat pump deployment statistics: March 2025, GOV.UK, 2025
- Boiler Upgrade Scheme launch, Ofgem, 2026
- Your essential guide to heat pumps, Welsh Government, 2025
- Energy in buildings 2025: heat and buildings, GOV.UK, 2025
- Check if a heat pump could be suitable for you, GOV.UK, 2026
- Zero carbon and climate change: action for residents, Manchester City Council, 2026
- Response to DESNZ SSES first phase energy smart appliances regulations, Energy Systems Catapult, 2026
- A networked approach to low carbon heat, Nesta, 2026
- Heat Pump Ready Programme Stream 2 projects, GOV.UK, 2026
 Which Homes Suit a Heat PumpMost UK homes can have a heat pump fitted, so the real question is whether yours makes it easy or expensive.
 Heat Pump Install StatisticsHow many heat pumps are actually being fitted in the UK each year, and is that number going up?
 The Full Heat Pumps GuideWill a heat pump keep my house warm in winter, and what does one cost to buy and run?
 Policy, Targets and Coming RulesHeat pumps are central to the government's plans for greener home heating.
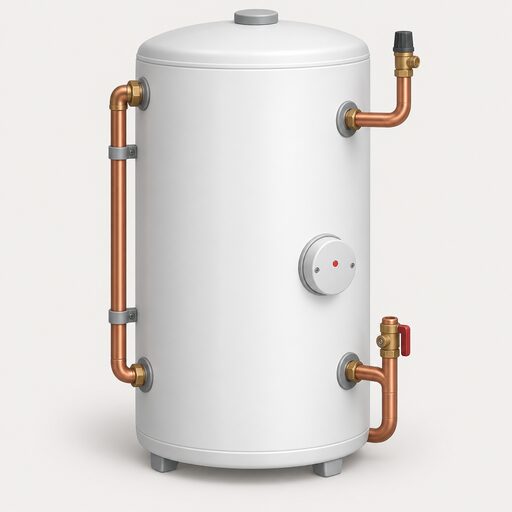 Air-to-Water Wet SystemsAir-to-water heat pumps feed radiators, underfloor heating and a hot water cylinder, and are the most common domestic heat pump in the UK.
 Demonstration and Test HomesBefore new heating systems reach your home, they get tested in real houses with real people living in them.