
In this guide
The English Housing Survey (EHS) is the national survey of people's housing circumstances and the condition and energy efficiency of housing in England. It is a repeated cross-sectional survey that pairs a household interview with a physical inspection of the home, and it is an Accredited Official statistic, previously known as a National statistic1. It is one of the longest standing government surveys, first run in 19671.
Its energy findings are published in stages rather than as one annual report. The 2024 to 2025 headline findings on housing quality and energy efficiency were published on 29 January 2026, and the home insulation fact sheet followed on 14 May 20261. The 2023 to 2024 low carbon technologies fact sheet was published on 15 May 20253. The survey applies to England, so its figures describe the English stock and not the UK as a whole2.
For a household thinking about energy independence, the survey is the closest thing to a census of what English homes actually have: how they are heated, how well they are insulated, how many have a heat pump, and what it would cost to bring the worst of them up to standard. It measures the stock; it does not measure what any individual home uses, and it does not tell a household what to install.
What the English Housing Survey is and what it covers
The EHS is a national survey of people's housing circumstances and the condition and energy efficiency of housing in England1. Its structure is what distinguishes it from a pure energy dataset: a household interview captures who lives there, tenure and household characteristics, while a physical inspection records the fabric and services of the dwelling itself. The two halves are what allow the survey to connect a household's circumstances to the building it occupies.
The energy reporting has a defined scope. The 2021 to 2022 energy report gives an overview of the energy efficiency of the English housing stock between 2011 and 2021, then explores energy efficiency in 2021 by dwelling and household characteristics4. It reports on the presence of different heating systems, and it focuses on the cost of improving homes that have an energy efficiency rating of band D or lower to at least band C, identifying the more common improvement measures within the English stock4.
Territorial extent matters here. The EHS applies to England, and the fact sheets carry that restriction explicitly2. The Housing Energy Fact File, by contrast, aims to draw together the important data about energy use in homes in Great Britain, so it is wider in scope but older8. For Scotland, Wales and Northern Ireland, separate housing condition and dwelling stock sources apply, and the four UK nations are covered by four separate surveys9.
The survey is also used beyond its own publications. The Committee on Climate Change's work on overheating risk uses data from the English Housing Survey to assess the profile of English dwellings at risk10. That reuse is a useful signal of what the survey is good for: a consistent, repeatable description of the stock that other analysts can build on.

An Accredited Official statistic, running since 1967
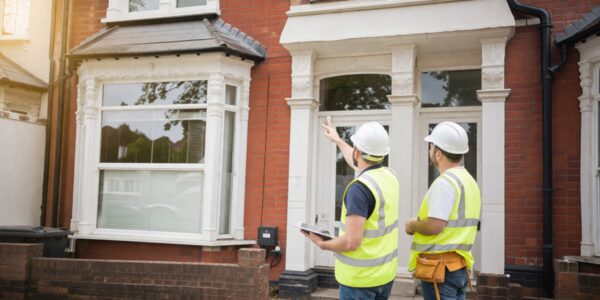
The EHS is an Accredited Official statistic, previously known as a National statistic, and it is one of the longest standing government surveys, first run in 19671. That status is not decorative. It signals that the statistics are produced to a published code of practice, and it distinguishes them from outputs that carry weaker labels.
The distinction is worth understanding because the housing and energy field mixes several statuses, as the table below sets out.
| Output | Statistical status | Source |
|---|---|---|
| EHS 2024 to 2025 home insulation fact sheet | Accredited Official statistics release | 2 |
| EHS 2023 to 2024 low carbon technologies fact sheet | Accredited Official statistics release | 3 |
| EHS 2021 to 2022 energy report | Accredited Official statistics release | 4 |
| EHS 2021 to 2022 private rented sector report | Accredited Official statistics release | 11 |
| National Energy Efficiency Data-Framework | Accredited Official statistics release | 12 |
| Household Energy Efficiency Statistics, June 2026 | Accredited Official statistics release, provisional | 13 |
| Dwelling stock estimates for England | Accredited Official statistics | 14 |
| Energy Performance of Building Certificates statistics | Official Statistics | 15 |
| Energy efficiency characteristics of new dwellings | Official Statistics in Development | 6 |
| Energy Rating of Housing in Northern Ireland | Official Statistics in Development | 16 |
Accreditation does not mean final. The Household Energy Efficiency Statistics headline release for June 2026 states that the statistics are provisional and are subject to future revisions13, and the October 2022 release carried the same caveat17. The EHS itself is not immune to timing effects: the physical survey data for 2024 to 2025 was collected from March 2023 to March 2025 and weighted to a midpoint of April 2024, so a single year's release rests on a two-year fieldwork window1.
For a household reading these numbers, the practical implication is that a figure quoted from an Accredited Official statistic is the best available description of the stock at a point in time, but it is a description of the stock, not a live reading of any one home.
How the survey works: sample sizes and who runs it
The EHS is run by the Department for Communities and Local Government, now the Ministry of Housing, Communities and Local Government9. The department also commissions the Building Research Establishment to analyse EHS physical survey data, including work using 2019 physical survey data to estimate whether dwellings would pass or fail an updated Decent Homes Standard and the potential cost of bringing homes up to the revised standard18.
The survey's findings are reported on a full household sample11. The physical survey element runs over a longer window than the interview element: for 2024 to 2025, physical survey data was collected from March 2023 to March 2025 and weighted to a midpoint of April 20241. That design is deliberate, spreading inspection work across a longer period to build a usable sample of dwellings.
The EHS also feeds follow-up work. The Energy Follow-Up Survey 2011 consisted of follow-up interviews with a sub-set of households that formed part of the much larger 2010/2011 English Housing Survey19. That pattern, a large main survey with a smaller intensive follow-up, is how detailed energy use behaviour gets measured without inspecting every home in the main sample.
Sample sizes in this field vary widely by purpose, which is worth knowing when comparing surveys:
- Ofgem Consumer Survey 2021: 4,037 energy consumers in Great Britain solely or jointly responsible for their household's energy bills20
- Energy Consumer Satisfaction Survey: fieldwork between 5 January and 3 February 2026, with 3,911 domestic energy consumers taking part21
- Scottish occupant behaviour study: a survey of 200 homes22
- English Housing Survey: reported on a full household sample, with physical survey data collected over a two-year window1
The EHS sits at the larger end of this range, which is what allows it to break results down by tenure and dwelling characteristic.

The English housing stock: tenure and dwelling numbers
The dwelling stock estimates for England are the companion dataset to the EHS, and they set the totals that the survey's percentages describe. The statistics use the Census as a baseline and apply annual net changes to the dwelling stock as measured by the related Housing supply: net additional dwellings statistics14. The release also includes figures on dwelling density, represented by dwellings per hectare of land area14.
| Measure, England, 31 March 2025 | Figure | Change on 31 March 2024 | Source |
|---|---|---|---|
| Owner-occupied share of dwelling stock | 64.1% | down from 64.2% | 5 |
| Owner-occupied dwellings | 16.6 million | up 131,000 | 5 |
| Total dwelling stock growth | 208,600 dwellings, 0.81% | 5 | |
| Vacant dwellings | 2.9% of the dwelling stock | 5 | |
| Long-term vacant dwellings | 1.2% of the dwelling stock | 5 |
Tenure breakdowns in the dwelling stock estimates draw on local authority returns, registered social landlord returns and estimates from the Annual Population Survey23. That mix of sources is why the tenure figures carry a different character from the physical survey data: they are administrative and modelled counts rather than inspections.
The devolved picture differs, and the Welsh figures show how much uncertainty sits around tenure estimates. In Wales, owner-occupied dwellings were estimated at 1,059,300 as at 31 March 2025, with a lower confidence interval of 1,051,300 and an upper of 1,070,700; privately rented dwellings were estimated at 184,900, with a range of 175,200 to 194,60023. For 2023 to 2024, the revised estimate of owner-occupied dwellings in Wales increased by 16,100 (2%) and the number of privately rented dwellings decreased by 16,100 (8%)23. Revisions of that size are a reminder that tenure estimates move as methods and returns change.
Energy efficiency of the stock: what the survey measures
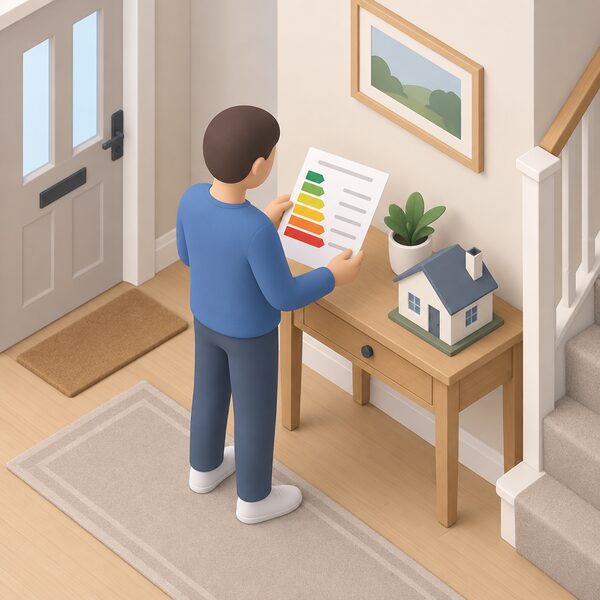
The EHS energy reporting is built around energy efficiency ratings and the measures that move them. The 2021 to 2022 energy report gives an overview of the energy efficiency of the English housing stock between 2011 and 2021, then explores energy efficiency in 2021 by dwelling and household characteristics4. It reports on the presence of different heating systems and focuses on the cost of improving homes rated band D or lower to at least band C, identifying the more common improvement measures within the English stock4.
The survey's energy findings sit alongside a separate but related data stream. Energy Performance Certificates cover around 60% of the housing stock in England and around 55% in Wales, based on Census 2021 analysis by the Office for National Statistics15. The same coverage figure of around 60% for England appears in earlier EPC statistical releases24. EPC data is used to evaluate trends in the energy performance of buildings that have had a certificate, to assess changes between the same quarter across years, and as an early indication of new housing supply24.
The two sources answer different questions:
- EPC data describes the subset of homes that have had a certificate, which skews towards homes that have been sold, let or improved, and covers around 60% of the English stock15.
- The EHS inspects a sample designed to represent the whole stock, including homes that have never had a certificate1.
That is why the survey is the better source for statements about the stock as a whole, and why EPC coverage of around 60% is a limit on what certificate data alone can say.
New build performance is tracked separately. The energy efficiency characteristics of new dwellings statistics are consistent with the Energy Performance of Buildings Certificates statistics release, and they are published as Official Statistics in Development6. The Office for National Statistics also produced a five-year rolling energy efficiency of housing dataset for England and Wales, with a release date of 28 October 2025 and editions covering March 2025, March 2024, March 2023 and March 202225. That dataset was delayed by three weeks from 6 October to 28 October 2025 because of a data quality issue found during quality assurance25.
One output has been withdrawn. The Office for National Statistics reviewed its outputs and decided to discontinue its Energy Efficiency of Housing statistics26. Households and analysts relying on that series need to move to the five-year rolling dataset or the EHS instead.
Heat pumps: 0.8% of existing English dwellings
Heat pumps remain a small share of the existing English stock, and the survey and related sources agree on the order of magnitude. In England, 0.8% of existing dwellings have heat pumps, compared with 4.2% of new dwellings, as of March 20256. Across the UK, around 1% of homes have a heat pump installed27.
| Measure | Figure | Date | Source |
|---|---|---|---|
| Existing English dwellings with heat pumps | 0.8% | March 2025 | 6 |
| New English dwellings with heat pumps | 4.2% | March 2025 | 6 |
| UK homes with a heat pump installed | around 1% | 2025 | 27 |
| UK homes with sufficient insulation and electrical capacity for a heat pump | 90% | 2025 | 27 |
| Existing UK homes needing a heat pump by 2030 | approximately 10% | 18 July 2024 | 28 |
| Existing UK homes on a heat pump in the balanced pathway, 2040 | 52% | 2023 baseline | 29 |
| Scottish domestic properties with heat pumps | 36,000, around 1.4% of all dwellings | 2022 | 30 |
The gap between new and existing dwellings is the striking part of the English figures. New build is installing heat pumps at roughly five times the rate of the existing stock, but even there the share is 4.2%, so gas and other heating still dominate new construction6. The EHS low carbon technologies fact sheet examines the prevalence and preparedness of English homes for low carbon technologies such as heat pumps and electric vehicle charge points, which is the survey's route into this question3.
The Climate Change Committee has set out how far the stock has to move. Approximately 10% of existing homes in the UK will need to be heated by a heat pump by 2030, compared with only approximately 1% today, in its assessment published on 18 July 202428. Its balanced pathway has 52% of existing homes in the UK heated using a heat pump in 2040, compared to around 1% in 202329.
Readiness is not the binding constraint, according to the same official guidance. This is despite 90% of UK homes having sufficient insulation and electrical capacity to operate a heat pump27. The gap between 90% technical readiness and around 1% installation is therefore about cost, disruption, supply chain and decision making rather than physical suitability alone.
The devolved picture is thinner. In Scotland, there were 36,000 domestic properties with heat pumps, around 1.4% of all dwellings, in 202230. That is a higher share than England's existing-dwelling figure, but it is drawn from a different survey and a different year, so the two are not directly comparable.
How households keep cool: open windows for 89.7%, air conditioning for 3%
Cooling in UK homes is overwhelmingly passive. The most common method of keeping cool reported in England in 2024 was opening the windows, at 89.7% of coping methods, followed by closing shutters, curtains or blinds at 74.7%1. A separate survey of all households found people were most likely to report simply opening windows or doors (80%), with closing curtains or blinds at 45% and air conditioning at 5%2.
| Cooling method | Share reporting it | Source |
|---|---|---|
| Opening windows | 89.7% of coping methods, England, 2024 | 1 |
| Closing shutters, curtains or blinds | 74.7% of coping methods, England, 2024 | 1 |
| Opening windows or doors | 80% of households | 2 |
| Closing curtains or blinds | 45% of households | 2 |
| Air conditioning | 5% of households | 2 |
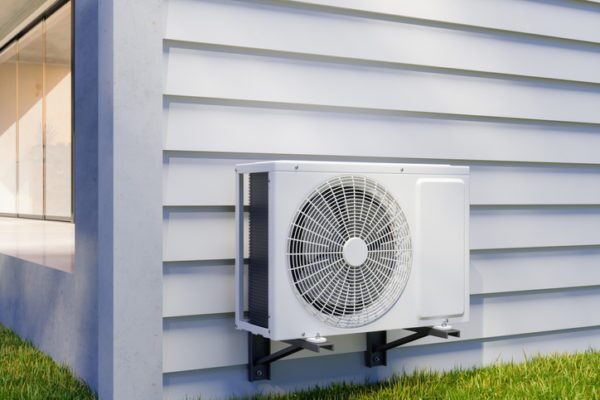
Air conditioning remains rare: it is estimated that 3% of UK homes currently have air conditioning, with 4% household penetration in England3. Where mechanical cooling is absent, the building fabric does the work. Insulation keeps homes cool in the summer, warm in the winter and means people use less energy because less of it is wasted through draughty windows, walls and roofs5.
Demand for cooling is nonetheless rising. 36% of people reported using more energy compared to previous summers to keep their home cool this summer6. For a household's energy independence, passive cooling costs nothing to run and depends on no supplier, while air conditioning adds a summer electrical load and a further reliance on the grid.
Cooling is measured differently from heating, and the survey and tracker data show how heavily English households rely on passive methods. In the Department for Energy Security and Net Zero public attitudes tracker for winter 2025, people were most likely to report simply opening windows or doors (80%), with 45% closing curtains or blinds and 5% saying they used air conditioning31.
The overheating evidence base uses the EHS itself. The Committee on Climate Change's work on the risks to housing from overheating uses data from the English Housing Survey to assess the profile of English dwellings at risk10. That is the mechanism by which the survey supports analysis of summer comfort as well as winter warmth.
The home insulation fact sheet frames the survey's interest in comfort on the cold side. It aims to provide insight into what insulation is used in English homes and the profile of households living in homes with low levels of insulation, alongside household reports of condensation and inability to keep warm2. Condensation and inability to keep warm are self-reported measures, which is a different kind of evidence from the physical inspection of insulation.
For a household, the practical point is that cooling in England is overwhelmingly behavioural rather than mechanical. Opening windows and closing blinds cost nothing and depend on the building's orientation, shading and ventilation, not on a fuel supply. Air conditioning, at 5% of households, is the minority route and the one that adds an electricity load.
What it would cost to upgrade homes: £7,480 on average
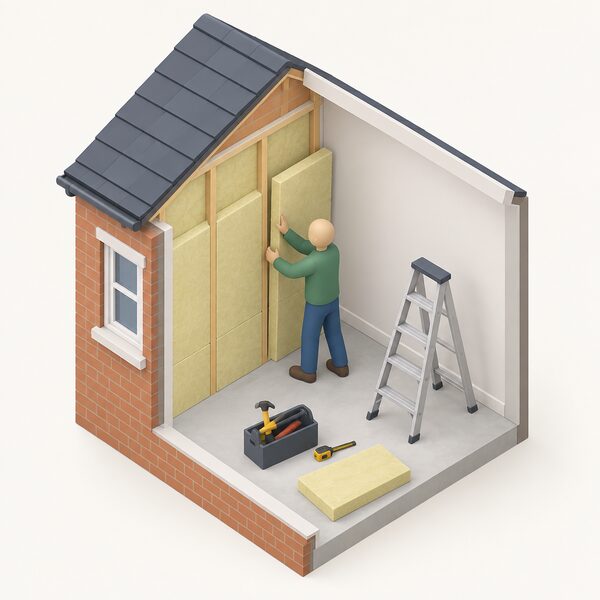
The cost of improving the stock is where the survey's energy reporting becomes most concrete. In 2024, the estimated average cost to improve dwellings to at least an energy efficiency band C was £7,480 across all tenures1. The 2021 to 2022 energy report focuses on the cost of improving homes that have an energy efficiency rating of band D or lower to at least band C, and identifies the more common improvement measures within the English stock4.
The regulatory backdrop for privately rented homes has been moving. The government has proposed to raise the minimum energy efficiency standard required of privately rented homes in England and Wales to the equivalent of Energy Performance Certificate C by 2030, with a single compliance date of 1 October 2030 for the new standard7. The same consultation set out raising the cost cap to £10,000 with a 10-year validity period for exemptions, and stated that increasing standards in the sector will support the delivery of up to 5 million home upgrades by 20307. The consultation page was last updated on 21 January 20267.
Grant support for landlords operates on a different scale. Under the Warm Homes: Local Grant, the cost cap is £30,000 for the first property a landlord upgrades, split as £15,000 for energy efficiency measures and £15,000 for low-carbon heating measures, and £15,000 per property for any other properties a landlord upgrades, split as £7,500 and £7,50029.
The two figures that matter most to a household are therefore the average improvement cost of £7,480 across all tenures and the proposed £10,000 cost cap for privately rented homes1. They are not the same measure: one is an estimated average across the stock, the other is a regulatory ceiling on what a landlord can be required to spend before an exemption applies.
Boiler efficiency and where the least efficient homes are
The survey's heating system data is the starting point for any assessment of where the least efficient homes are. The 2021 to 2022 energy report reports on the presence of different heating systems across the English stock4. That is the measure that shows how many homes still depend on a boiler rather than a heat pump or another low carbon source.
The National Energy Efficiency Data-Framework provides the impact side of the picture. Its data tables cover impact of measures analysis, which assesses the impact of installing home efficiency measures such as loft insulation on household energy consumption12. That is a different question from the EHS's stock description: it asks what changed when a measure was installed, rather than what the stock contains.
The least efficient homes are concentrated where the cost of improvement is hardest to bear. The privately rented sector is the focus of the proposed band C standard, with the 2030 compliance date and the £10,000 cost cap7. The EHS 2021 to 2022 private rented sector report is the survey's dedicated output on that tenure11. Owner-occupied homes, at 64.1% of the stock and 16.6 million dwellings, are the largest group by far, and they are not subject to the same regulatory driver5.
Primary heating fuel varies by tenure, and the Scottish data illustrates the pattern even though it is not an English figure. In Scotland, electricity was the primary heating fuel for 8% of owner occupied and 10% of social sector dwellings in 202430. That is a reminder that the split between gas and electricity as a primary heating fuel is a tenure-linked characteristic, not just a regional one.
For a household, the practical reading is that the least efficient homes are identified by their energy efficiency rating, and the survey's improvement cost work is aimed at the band D or lower portion of the stock4. The measures that move a home up the bands are the ones the survey identifies as more common within the English stock4.
Using the data: the EHS analysis tool and related datasets
The EHS is published in a form intended for reuse, not just reading. The English Housing Survey analysis tool allows users to make use of data from the English Housing Survey easily, with a special focus on energy, and the 2010 version of the tool is still available9. The BRE Housing Data tool provides a simple way to analyse data on housing and energy, and all the data on the Housing Data Tool is obtained from the UK data archive9.
The survey's outputs are released in stages:
- The 2021 to 2022 energy report was published on 13 July 20234.
- The 2023 to 2024 low carbon technologies fact sheet was published on 15 May 20253.
- The 2024 to 2025 headline findings on housing quality and energy efficiency were published on 29 January 20261.
- The 2024 to 2025 home insulation fact sheet was published on 14 May 20262.
Related datasets fill out the picture. The National Energy Efficiency Data-Framework is an Accredited Official statistics release covering the impact of measures analysis12. The energy efficiency characteristics of new dwellings statistics are consistent with the Energy Performance of Buildings Certificates statistics release and are published as Official Statistics in Development6. The Office for National Statistics five-year rolling energy efficiency of housing dataset for England and Wales was released on 28 October 2025, with the next release scheduled for October 202625.
The dwelling stock estimates for England are published as Accredited Official statistics and use the Census as a baseline, applying annual net changes as measured by the related Housing supply: net additional dwellings statistics14. The breakdown of dwelling stock estimates by tenure uses local authority returns, registered social landlord returns and estimates from the Annual Population Survey23.
For a household trying to understand its own position against the national picture, the survey's value is comparative. It shows what share of homes have a heat pump, what the stock's energy efficiency looks like, and what improvement costs average out at. It does not rate an individual home, and it does not replace an assessment of the building in front of you.

Sources31 cited
- English Housing Survey 2024 to 2025: headline findings on housing quality and energy efficiency, GOV.UK, 29 January 2026
- English Housing Survey 2024 to 2025: home insulation fact sheet, GOV.UK, 14 May 2026
- English Housing Survey 2023 to 2024: low carbon technologies in English homes fact sheet, GOV.UK, 15 May 2025
- English Housing Survey 2021 to 2022: energy, GOV.UK, 13 July 2023
- Dwelling stock estimates, England: 31 March 2025, GOV.UK, 21 May 2026
- Energy efficiency characteristics of new dwellings, GOV.UK, 4 February 2026
- Improving the energy performance of privately rented homes: 2025 update, GOV.UK, 21 January 2026
- Housing Energy Fact File 2012: energy use in homes, GOV.UK, 19 December 2012
- Cambridge Housing Energy Tool guidance note, GOV.UK, 7 September 2011
- The risks to housing from overheating, Climate Change Committee, 27 November 2017
- English Housing Survey 2021 to 2022: private rented sector, GOV.UK, 21 July 2025
- National Energy Efficiency Data-Framework: impact of measures data tables 2025, GOV.UK, 26 June 2025
- Household Energy Efficiency Statistics, headline release June 2026, GOV.UK, 25 June 2026
- Dwelling stock estimates in England: 2025, GOV.UK, 21 May 2026
- Energy Performance of Buildings Certificates statistics, April to June 2025, GOV.UK, 31 July 2025
- Northern Ireland energy efficiency of housing, Northern Ireland Department for Communities, July 2024
- Household Energy Efficiency Statistics, headline release October 2022, GOV.UK, 27 October 2022
- EHS briefing: modelling a revised Decent Homes Standard for consultation, GOV.UK, 2 July 2025
- Energy Follow-Up Survey 2011, GOV.UK, 28 January 2014
- Consumer survey: electric vehicles summary, Ofgem, 2021
- Customers' satisfaction with their supplier: supplier level findings, January 2026, Ofgem, 2026
- Research report: modelling proposed energy improvements in new domestic buildings, Scottish Government, 2014
- Dwelling stock estimates quality report, Welsh Government
- Energy Performance of Buildings Certificates statistics, January to March 2023, GOV.UK, 27 April 2023
- Energy efficiency of housing, England and Wales, five years rolling, Office for National Statistics, 28 October 2025
- Energy efficiency of housing in England and Wales: 2025, Office for National Statistics, 23 April 2026
- Heat pumps, House of Commons Environmental Audit Committee, 9 May 2025
- UK off track for net zero, say country's climate advisors, Climate Change Committee, 18 July 2024
- Warm Homes: Local Grant, House of Commons Library, 13 May 2026
- Heat in buildings: progress report 2024, Scottish Government, 2024
- DESNZ public attitudes tracker: heat and energy use in the home, winter 2025, GOV.UK, 2025
 Housing Stock Data for ScotlandScotland's housing is measured differently from England's, so the numbers you see may not compare directly.
 Housing Stock Data for WalesHow energy efficient are Welsh homes, and how many have a rating?
 Efficiency of UK HomesMost UK homes now score better on energy than they did a decade ago, but older houses still lag well behind new builds.
 The Full Statistics GuideHow many homes in the UK have solar panels, heat pumps or batteries?
 Housing Stock Data for NIMost homes in Northern Ireland heat with oil, so why are the grants and help different from the rest of the UK?
 EPC StatisticsHow energy efficient are UK homes, and is it getting better?