In this guide
The sub-national electricity and gas consumption statistics are the official record of how much energy households and businesses use, broken down below national level. The Department for Energy Security and Net Zero publishes them as Accredited official statistics, with the latest estimates covering 2024 and published on 18 December 20251. They give annual electricity and gas consumption for regions, local authorities and smaller areas across Great Britain, built from meter level data rather than surveys2.
The same figures sit behind the benchmarks that appear on every energy bill. Ofgem's Typical Domestic Consumption Values (TDCVs) are derived using an established methodology that draws on the DESNZ sub-national consumption statistics, based on median consumption3. From 1 July 2026 the medium gas TDCV is 9,500 kWh per year and the medium electricity TDCV is 2,500 kWh per year for Profile Class 14. Those two numbers decide what a "typical household" bill means in every price cap headline.
This page explains what the sub-national statistics cover, what the gas and electricity data show at local authority level, how the figures are produced and classified, and how the TDCVs built on them affect bills and tariff comparisons. It also sets out where the data stops: Northern Ireland local government district figures are only available from 2015 onwards, and the gas statistics cover England, Scotland and Wales2.
What the sub-national consumption statistics cover
The sub-national electricity and gas consumption summary report provides estimates of annual electricity and gas consumption below national level1. That means region, local authority and, for some datasets, small area level. The statistics are Accredited official statistics, which places them under the Code of Practice for Statistics and gives them the highest status available to UK official data1.
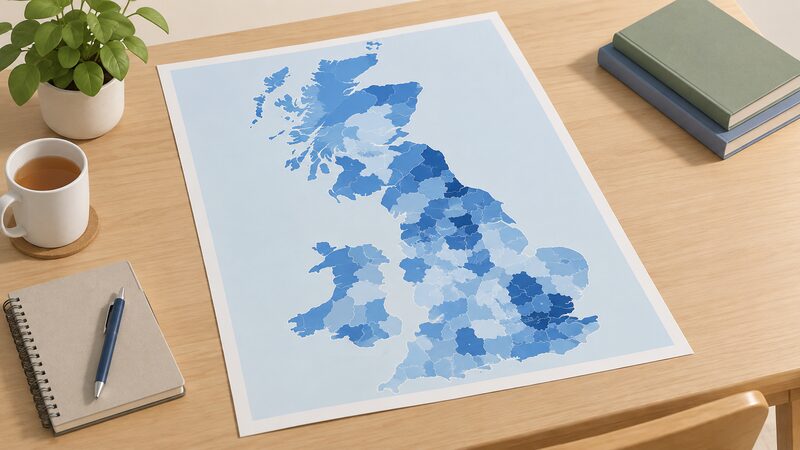
The gas side is published separately as regional and local authority gas consumption statistics. These give estimates of gas consumption at region and local authority levels in Great Britain, and they measure the number of gas meters, total consumption, and mean and median consumption per meter, split into domestic, non-domestic and total gas consumption5. The dataset applies to England, Scotland and Wales, and the subnational gas consumption statistics run from 2005 to 2024, with a separate non-weather-corrected series covering 2015 to 20245.
The electricity side is carried in the same summary report and mirrored in the ONS Explore Local Statistics service, where domestic electricity consumption is one of 109 local indicators2. The indicator is based on meter level electricity consumption data, sourced for Great Britain from the Department for Energy Security and Net Zero and for Northern Ireland from the equivalent department2.
Coverage is not uniform across the UK. Northern Ireland local government district figures are only available from 2015 onwards, so a household in Northern Ireland looking for a long run of local data will find a shorter series than one in England, Scotland or Wales2. The gas statistics do not extend to Northern Ireland at all5.
Gas consumption by local authority: what the data shows
The gas statistics are the more developed of the two sub-national datasets, because gas meters are read and settled through a single network. The regional and local authority gas consumption statistics give the number of gas meters alongside total, mean and median consumption per meter, for domestic, non-domestic and total gas use5. That structure matters: a local authority with high total consumption may simply have more meters, so mean and median consumption per meter are the figures that describe a typical household.
The domestic share of gas consumption is large. Domestic gas customers accounted for 61% of gas consumption in Great Britain, while business users accounted for 39% of total gas consumption7. Electricity runs the other way: domestic customers accounted for 36% of electricity consumption, and business users for 64% of total electricity consumption7. Those shares, from 2016, explain why gas statistics are read as a proxy for household heating demand and electricity statistics are not.
Consumption varies widely between areas, and the Welsh data shows how far. The local authority with the greatest mean domestic consumption is Ceredigion, in the 2020 figures10. That reflects a combination of housing stock, off-gas-grid status and household composition rather than any single cause, and it is the kind of finding the sub-national data exists to surface.
The gas data is also published in a non-weather-corrected form. Weather correction adjusts for how cold a year was, so the non-weather-corrected series shows what households actually consumed rather than what they would have consumed in an average year5. For a household comparing its own usage with its area, the non-weather-corrected figures are the closer match.
Electricity consumption by local authority: what the data shows
Electricity consumption at local authority level is built from meter level data, which means it is measured rather than modelled from a sample2. The ONS Explore Local Statistics service publishes median domestic electricity consumption for lower tier and unitary authorities, with a 2024-25 reference period11. Median is used rather than mean because a small number of very high users would otherwise pull the average up.
The profile class split is the key to reading electricity figures. In 2022, 82% of domestic electricity consumption was on profile class 1 and 18% was on profile class 212. Profile Class 1 meters had a mean annual consumption of 3,245 kWh per meter in November 202212. Profile class 2 covers households on different metering arrangements, typically those with electric heating or other non-standard supply, and their consumption is much higher, which is why the two classes carry separate TDCVs.
The classification boundary for non-domestic electricity is a cut-off point of 100,000 kWh per year13. Meters above that threshold are treated as non-domestic, which keeps very large commercial users out of the domestic statistics and stops a single site distorting a local authority's domestic average.
For a household, the practical use of the electricity data is comparison. A local authority median tells you what a middle household in your area uses, and the gap between your own annual figure and that median is the starting point for understanding whether your home is high or low consumption. The same logic applies to gas, where mean and median consumption per meter are published directly5.
How the statistics are produced and classified
The sub-national consumption statistics are built from meter level data supplied through the energy industry, then aggregated to geographic areas. The greenhouse gas emissions statistics that sit alongside them use the UK National Atmospheric Emissions Inventory and the DESNZ Official Statistics on energy consumption for local authority areas as their main data sources8. The two families of statistics are designed to be read together: consumption in kWh, emissions in tonnes.
The emissions statistics are Accredited official statistics, comply with the Code of Practice for Statistics, and go back to 2005 using nationally available datasets8. They include an interactive map that lets users zoom in to any UK local authority, see the emissions for the area and identify the significant point sources, such as iron and steel plants, with the data filterable by sector and across the time series8. That is a different geography from the consumption statistics, which cover Great Britain only, but the two are complementary.
The National Energy Efficiency Data-Framework (NEED) provides the property level counterpart. NEED holds gas and electricity consumption from 2005 to 2022 alongside property characteristics and energy efficiency measure installations14. Where the sub-national statistics describe an area, NEED describes a dwelling, and the two are used together to assess how much of a local authority's consumption is explained by its housing stock.
The maps showing average energy consumption are the oldest of the geographic products, covering average electricity, gas and total final energy consumption for local authorities in Great Britain15. They remain a useful visual entry point even though the underlying figures have been superseded by later releases.
TDCVs: the national benchmarks behind the figures
The Typical Domestic Consumption Values are the bridge between the sub-national statistics and a household's bill. They are industry standard values for the annual gas and electricity usage of a typical domestic consumer, first established in 2003 by Energywatch12. Ofgem derives them using an established methodology that draws on the DESNZ sub-national consumption statistics, based on median consumption3.
Median is used deliberately. Since the small number of customers who use very high volumes of gas and electricity disproportionately influence the mean, the median gives a better picture of the middle household12. The method averages the two most recent median consumption values, and uses the first, second and third quartiles for the low, medium and high levels16. That is why the published TDCVs come in threes rather than as a single number.
The values have moved over time as consumption has fallen. In the 2017 update, the medium gas TDCV was revised down from 12,500 to 12,000 kWh per year, and the Profile Class 2 medium electricity TDCV from 4,300 to 4,200 kWh13. The 2019 update left the medium gas figure at 12,000 kWh and the Profile Class 2 medium electricity figure at 4,200 kWh, while revising the Profile Class 1 low value from 1,900 to 1,800 kWh and the high value from 4,600 to 4,300 kWh17.
The distribution around the median is wide. The gas 5th percentile was 2,500 kWh per year in 2017 and the 90th percentile 23,500 kWh13. By 2019 the 5th percentile had been revised to 3,000 kWh17. For Profile Class 2 electricity, the 10th percentile was revised from 1,500 to 1,400 kWh and the 90th percentile stood at 11,000 kWh17. Those tails are why a single "average" figure never describes a whole street.
TDCV levels: low, medium and high users
From 1 July 2026, Ofgem publishes three consumption levels for each fuel and profile class. The table below sets out the current values.
| Level | Gas (kWh per year) | Electricity Profile Class 1 (kWh per year) | Electricity Profile Class 2 (kWh per year) |
|---|---|---|---|
| Low | 6,000 | 1,600 | 1,900 |
| Medium | 9,500 | 2,500 | 3,400 |
| High | 14,000 | 3,800 | 6,100 |
The 2026 review lowered every level. Gas fell by 1,500 kWh at the low level, 2,000 kWh at medium and 3,000 kWh at high. Electricity Profile Class 1 fell by 200 kWh at low, 200 kWh at medium and 300 kWh at high. Profile Class 2 fell by 300 kWh at low, 500 kWh at medium and 600 kWh at high4.
The reason is a sustained fall in measured consumption. In 2024, median consumption remained substantially lower than in 2021 by 13% for gas and 9% for electricity6. Both gas and electricity consumption increase with adult occupancy, so household size is one of the drivers behind the spread between the low and high levels6.
The levels are not arbitrary bands. They come from the distribution of consumption across all domestic meters, with low at the 25th percentile, medium at the median and high at the 75th percentile16. A household at the high level is not unusual, it is simply in the top quarter of users.
How TDCVs affect your bill and tariff comparisons
The TDCVs do not set a bill. They set the consumption figure that a bill illustration assumes. Ofgem's own position is that a revision to the TDCVs will not impact the price cap or the Energy Price Guarantee values, as both schemes are in effect caps on standing charges and unit rates, not the bill amount12. The cap limits what a supplier can charge per unit and per day, not what a household pays in total.
What the TDCVs do change is the headline number quoted for the cap. The price cap figures from October 2026 reflect TDCVs of 9,500 kWh of gas and 2,500 kWh of electricity annually for a typical dual fuel household18. Earlier figures used higher values: the figures from October 2023 reflected 11,500 kWh of gas and 2,700 kWh of electricity18. The same cap on unit rates therefore produces a lower quoted annual bill once the assumed consumption falls.
The TDCVs also underpin comparison tools. Elements of the TDCVs form the basis of the Retail Market Review's Tariff Comparison Rate and Tariff Information Label16. When a supplier quotes a rate for a "typical" household, or a comparison site ranks tariffs, the annual figure shown is built on the TDCV rather than on the household's own meter readings.
The price cap benchmark consumption values in the licence condition use the 2017 TDCVs and were not proposed to be amended at the time of the 2023 review12. That is a separate set of values from the TDCVs used in bill illustrations, and the two can diverge.
For a household, the practical consequence is that a quoted annual bill is a benchmark, not a prediction. A home using 14,000 kWh of gas and 3,800 kWh of electricity sits at the high level and will pay more than the headline figure whatever the cap does4.
How often TDCVs are reviewed and when they change
Ofgem's current approach is to review TDCVs every two years, in line with its established framework4. The same two-year cycle was set out in the 2023 consultation, which recorded that Ofgem would review domestic consumption every two years and revise the TDCVs if the latest consumption data warranted it12.
The 2023 review ran to a published timetable. Ofgem aimed to announce a final decision on the proposed revised TDCVs in April 2023, with stakeholder responses due by 27 March 2023, and proposed that the new values be used from 1 October 202312. The data behind that review covered gas from mid-May 2020 to mid-May 2022, and electricity for both meter profile 1 and profile 2 from the beginning of February 2020 to the end of January 202212.
The 2021 update was postponed until more data was available to assess the impact of the pandemic on domestic consumption12. That postponement is why the 2023 revision carried a larger change than a routine cycle would have done.
The next review was expected in 2026, with a call for input in early 2026 open to all stakeholders3. The 2026 decision sets the values in force from 1 July 20264.
A change only counts as material if it meets a threshold. Material means changes to the TDCVs of at least 100 kWh for electricity and 500 kWh for gas when rounded12. Rounding follows the same pattern, at 500 kWh for gas and 100 kWh for electricity16. A revision smaller than that does not trigger a change in the published values.
Using the statistics to understand your own consumption
The sub-national statistics are most useful when read against a household's own meter readings. The starting point is the local authority figure: mean and median gas consumption per meter, and median domestic electricity consumption for lower tier and unitary authorities5. A household's own annual kWh can be set against those figures directly, without any conversion.
The second step is to place the household on the TDCV scale. From 1 July 2026, gas low is 6,000 kWh, medium 9,500 kWh and high 14,000 kWh per year, and electricity Profile Class 1 low is 1,600 kWh, medium 2,500 kWh and high 3,800 kWh4. A household using more than the high level is in the top quarter of domestic users nationally, whatever its local authority average shows.
The third step is to account for what drives the difference. Both gas and electricity consumption increase with adult occupancy, so a larger household will sit higher on the scale without doing anything unusual6. Property characteristics and past energy efficiency installations are held in NEED, which links consumption to the dwelling rather than the area14.
The statistics also connect to local delivery. The Green Homes Grant Local Authority Delivery and Home Upgrade Grant statistical releases cover measures installed, homes upgraded, installation rates, installations by region, local authority and parliamentary constituency, carbon, bill and energy savings, and changes in Energy Performance Certificate ratings19. Those releases show where public funding has gone and what it changed, at the same geography as the consumption statistics.
For a household, the value of all this is a fixed reference point. The sub-national statistics are measured, not modelled, and the TDCVs built on them are the same figures a supplier uses. Comparing your own consumption with them tells you where you sit, and how much of any change is your household and how much is the national trend.
Sources19 cited
- Subnational electricity and gas consumption summary report 2024, GOV.UK, 18 December 2025
- Domestic electricity consumption indicator, Office for National Statistics, 18 December 2025
- Energy price cap benchmark review decision, Ofgem, 21 November 2025
- Review of typical domestic consumption values decision, Ofgem, May 2026
- Regional and local authority gas consumption statistics, GOV.UK, 5 May 2026
- NEED report summary of analysis 2026, GOV.UK, 2026
- Retail energy markets in 2016, Ofgem, August 2016
- UK local authority and regional greenhouse gas emissions statistics, 2005 to 2024, GOV.UK, 25 June 2026
- Domestic electricity consumption indicator, Office for National Statistics, 18 December 2025
- Energy use in Wales report, Welsh Government, June 2022
- Energy price cap and the retail energy market, House of Commons Library, 20 September 2026
- TDCV 2023 call for input, Ofgem, February 2023
- TDCVs 2017 open letter, Ofgem, 22 June 2017
- NEED anonymised data 2024, GOV.UK, 25 July 2024
- Maps showing average energy consumption, GOV.UK, 22 January 2013
- TDCV decision letter, Ofgem, September 2013
- TDCVs 2019 open letter, Ofgem, 18 October 2019
- Fuel poverty scenario modelling based on Ofgem energy price caps, Scottish Government, 2026
- Green Homes Grant LAD and HUG release, July 2025, GOV.UK, 31 July 2025
 Household Energy ConsumptionHow much gas and electricity does a typical UK home use in a year?
 Reducing Your BillRanks household electricity and gas uses by share of the bill and sets out what each measure changes, from heating settings and insulation to appliance use and tariff choice.
 Typical Consumption ValuesOfgem's typical usage figures are what the price cap and most bill comparisons are based on.
 Unit Rates by RegionWhy do electricity and gas prices differ depending on where you live?
 Official Energy StatisticsWhere can you find the government's official figures on UK energy prices and how much gas and electricity the country uses?
 Local Fuel Poverty StatisticsHow many households in your area struggle to afford their heating?