
In this guide
The Household Energy Efficiency Statistics are the official count of insulation, heating and other energy efficiency measures fitted to British homes under obligation schemes. Each headline release covers measures installed under the Energy Company Obligation (ECO) and the Green Deal schemes, and applies to England, Scotland and Wales. The series carries accredited official statistics status1.
The scale of what the series records is substantial. Between 2013 and December 2025, ECO delivered 4.4 million measures in 2.6 million homes across Great Britain2. The gap between those two numbers matters: households frequently receive more than one measure in a single visit, and the statistics have reported an average of 1.47 measures installed per household receiving measures since the start of ECO3. Within the total, 1.03 million energy saving measures were installed over the course of ECO34.
A headline release is not just a count. Each one also includes further analysis and geographical breakdowns of ECO measures, ECO delivery costs, estimated carbon and energy savings from measures installed, and the supply chain1. That combination, volume, cost and modelled saving, is what makes the series the reference point for judging how far obligation-funded retrofit has changed the British housing stock, and how far it has not.
What the Household Energy Efficiency Statistics cover
The defining sentence of the series has barely changed in a decade. The December 2015 release stated that it included measures installed under the Energy Company Obligation and the Green Deal schemes5; so did the May 2018 release6, the October 2022 release7 and the June 2026 release1. That continuity is the series' chief virtue. A householder or analyst comparing insulation volumes across twelve years is comparing measures counted on broadly the same basis, even though the underlying obligation has passed through several distinct phases.
Closed schemes stay in the series rather than disappearing from it. The Green Deal, which no longer takes new customers, continues to be named in the coverage statement, and earlier ECO phases remain part of the cumulative totals. This is why the headline figures are cumulative "since the start of ECO" rather than resets at each scheme boundary. During transition periods the releases report the phases side by side: an early ECO4 release recorded 69,200 measures installed under ECO3 Interim and ECO4 together3.
Measures are defined, not left to the installer's description. The ECO4 Measures Table sets out the energy efficiency measures which suppliers can install to meet their obligations during the ECO4 scheme8, and separate Ofgem guidance governs new measures and products9. The statistics inherit those definitions, which is why a category such as solid wall insulation or a heating measure means a specific, rule-bound thing rather than a loose description.
For the effect of those measures on actual consumption, a separate series does the work: the National Energy Efficiency Data-Framework publishes data tables for impact of measures analysis, assessing the impact of installing home efficiency measures such as loft insulation on household energy consumption10. The Household Energy Efficiency Statistics count what went in; the data framework tests what it did to metered demand. Read together they are the closest thing Britain has to a measured check on modelled savings, a theme developed further in measured versus modelled home energy performance.
Where the numbers come from and how often they appear

The series began under the Department of Energy and Climate Change, continued under the Department for Business, Energy and Industrial Strategy and is now produced by the Department for Energy Security and Net Zero. The publishing department's name changes; the statistical lineage does not. Ofgem, which administers ECO, is the source of the underlying delivery data, and also publishes monthly reports showing how energy suppliers are progressing towards their targets and the number and types of measures installed11.
The rhythm is a headline release, at intervals, with a fuller detailed release behind it. Releases are announced in advance with a stated date and time: the March 2023 detailed release, for example, named the next headline publication as 9.30am on 20 April 2023, containing ECO measures up to the end of February 20233. That pattern of a named future date and a stated data cut-off is standard across the series, and it is the reason the reporting month and the data month are never the same.
Figures are provisional and subject to future revisions7. Suppliers notify measures after installation, so the most recent months in any release are the least complete and tend to be revised upward. Anyone comparing two releases should expect the older months to have moved. The conventions behind that behaviour are set out more fully in how to read UK energy statistics and in the wider guide to official energy statistics publications.
Measures, delivery costs, carbon and energy savings
Four kinds of number sit in a headline release, and they answer different questions.
| What the release reports | What it tells a household |
|---|---|
| Measures installed, by type | How much of each intervention, insulation, heating, has actually been fitted1 |
| Geographical breakdowns of ECO measures | Where delivery has concentrated1 |
| ECO delivery costs | What obligation-funded retrofit is costing to deliver1 |
| Estimated carbon and energy savings | The modelled effect of the measures installed1 |
| Supply chain analysis | The installer capacity behind the delivery1 |
The savings figures are estimated, not metered. They are derived from the assumptions attached to each measure type under the scheme rules, and Ofgem guidance is explicit about the point at which a measure counts: installation is deemed complete at handover, at which point it must be able to deliver savings at a level expected for that measure12. The expected level, not the achieved level, is what enters the statistics.
That distinction has been tested directly. The department has published statistical audit results for solid wall insulation installed under ECO4 and the Great British Insulation Scheme, a publication last updated on 3 November 202513. Audits of this kind exist precisely because a measure lodged and counted is not automatically a measure performing as modelled. For a household, the practical reading is that the national savings totals describe design intent across a large population, and say nothing about what any individual installation achieved.
Delivery cost data is equally worth separating from household cost. The releases report what it costs obligated suppliers to deliver measures, a figure recovered through energy bills across all customers. It is not a price list for a householder buying insulation privately; comparable private-market figures sit in what home energy installations have cost over time.
Geographical breakdowns: region, local authority and constituency
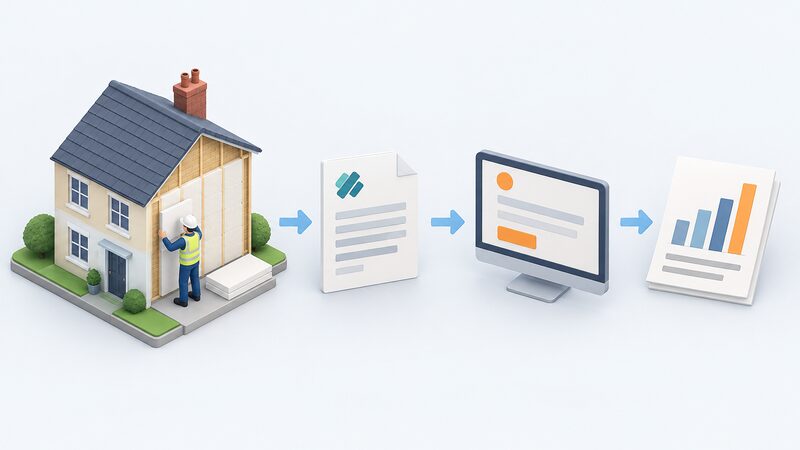
Obligation delivery is not evenly spread, and the releases are built to show that. The Great British Insulation Scheme statistics present analysis by measure type and geographical region14. The companion grant schemes go finer: the Green Homes Grant Local Authority Delivery and Home Upgrade Grant releases carry analysis of measures installed, homes upgraded, installation rates, installations by region, local authority and parliamentary constituency, carbon, bill and energy savings, and changes in Energy Performance Certificate15. That same structure has held across successive releases of the series, including the May 2025 edition16.
Two of those fields deserve attention. Installation rates express measures against the stock in an area rather than as raw counts, which prevents large authorities from dominating simply by being large. Changes in Energy Performance Certificate band give a before-and-after measure of rated performance, linking scheme delivery to the national EPC record.
The territorial extent is England, Scotland and Wales1. Northern Ireland is outside the Energy Company Obligation and therefore outside this series, and the Warm Homes: Local Grant statistics apply to England only17. Anyone assembling a UK-wide picture of household efficiency has to reach for separate sources for Northern Ireland, and for Scotland and Wales must set obligation delivery against devolved programmes. The nation-level stock context is covered in the pages on housing stock data for Scotland, Wales and Northern Ireland, and local delivery patterns alongside renewable installations by local authority.
How ECO delivery is verified
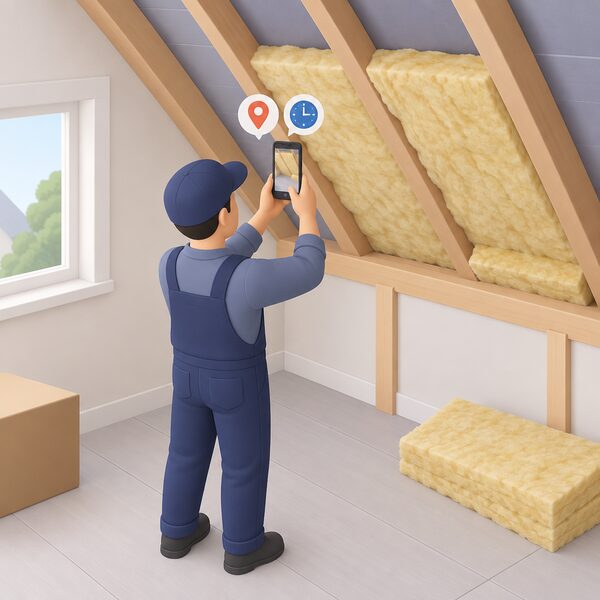
The credibility of the measure count rests on a lodgement and certification chain rather than on self-declaration by suppliers. All ECO4 measures, except district heating connection measures, must be lodged with TrustMark or an equivalent and delivered by a TrustMark or an equivalent registered business9. The same guidance states the installer condition directly:
"All ECO4 measures (except DHC) must be installed by, or under the responsibility of, a person who is registered with TrustMark"
TrustMark's Framework requires compliance and certification with PAS 2035:2023 for all relevant ECO measures9, and the requirement extends to innovation measures, which must likewise be lodged with TrustMark or an equivalent and delivered by TrustMark or equivalent registered businesses9. TrustMark reviews the quality assurance process and has oversight of monitoring for ECO measures, with narrow exclusions.
Evidence requirements are specific. Acceptable supplier evidence for innovation measures includes mid and post-install photographic evidence, geotagged and time-stamped, clearly showing the specific product installed or being installed9.
A wider consumer protection consultation has set out the data a government-owned system would draw together: consumer queries and complaints, building control notifications and additional lodgements, audit findings, scheme data, installer, retrofit professional and installation performance indicators, guarantee claims and outcomes, home condition data, and energy use data before and after19. That list is a fair description of what the current statistics do not yet contain. The measure count is robust; the outcome record, complaints, claims, in-use energy, is not yet assembled in one place.
The wider statistics landscape
The Household Energy Efficiency Statistics are one series among several, and the boundaries between them are where most misreadings happen.
| Series | What it counts | Extent |
|---|---|---|
| Household Energy Efficiency Statistics | ECO and Green Deal measures1 | England, Scotland, Wales1 |
| Warm Homes: Local Grant statistics | Measures installed and homes upgraded under the grant18 | England17 |
| Great British Insulation Scheme release | Measures by type and region14 | Great Britain schemes |
| MCS installation records | Certified renewable installations, including domestic and existing battery installations20 | UK |
| EPC statistics | Certificates on energy efficiency of domestic and non-domestic buildings, and larger public authority buildings, since 200821 | England and Wales21 |
The Warm Homes: Local Grant statistics include analysis on measures installed and homes upgraded18, with a published methodology and background note released in line with the August 2026 statistical releases22. MCS data covers a different population: certified renewable installations, reported for domestic and existing installations in the battery dataset20, and set out in detail in MCS installation statistics and home battery installation statistics.
EPC data is the third leg. An Energy Performance Certificate contains information on potential energy costs and carbon dioxide emissions, with a coloured chart showing how energy efficient the building is or could be23. Because grant releases report changes in EPC band, the two datasets meet, but they count different things: certificates lodged versus measures installed. See EPC statistics. Related series carry their own status caveats: the energy efficiency characteristics of new dwellings tables are published as official statistics in development24, a weaker designation than accredited status.
Context for why measures are installed at all comes from elsewhere again: the DESNZ Public Attitudes Tracker follows public awareness, attitudes and behaviours relating to departmental policies such as energy and climate change25, and local greenhouse gas emissions statistics draw on the National Atmospheric Emissions Inventory and official statistics on energy consumption for local authority areas26. ECO itself is described in parliamentary material simply as energy saving measures to help reduce costs27.
The Energy Saving Trust and the advice layer

Statistics tell a household what has been installed nationally; they do not tell it what to do. The Energy Saving Trust occupies that gap, offering free and impartial advice on how to reduce carbon emissions, how to use water more sustainably and how to save money on energy bills, through a helpline on 0300 123 123428. It also publishes advice on energy at home and a guide to green renovation intended to put energy efficiency first room by room29.
It produces indicative statistics of potential bill savings, carbon savings, up-front costs and payback periods30. The word indicative is doing real work. The methodology draws on housing stock data from sources including statistics from the Department for Energy Security and Net Zero, U-values from the Standard Assessment Procedure, government in-use factors and the heat replacement effect30. Savings, cost assumptions and methodology are reviewed at least annually, and typical installation costs are updated every year using installation cost data from the previous 12 months where available30.
Two of its figures recur in official documents. The Scottish House Condition Survey key findings report its estimate that an uninsulated dwelling loses a third of all its heat through the walls and a further quarter through the roof31; the Trust's own guidance puts the roof share at around 26 per cent32. On controls, a full set is estimated to save the average semi-detached house 100 pounds each year in Great Britain and 110 pounds a year in Northern Ireland32. These are modelled averages for a notional house.
Delivery roles in Scotland and what is withheld
In Scotland the Energy Saving Trust is not only an advice body but a scheme administrator. The Home Energy Scotland Grant and Loan Scheme, which helps eligible homeowners pay for energy efficiency improvements and clean heating systems, is run by the Energy Saving Trust on behalf of the Scottish Government33. Home Energy Scotland itself offers free advice on improving the energy efficiency of a home29. Separately, Energy Efficient Scotland Area Based Schemes were supported by Scottish Government funding and delivered by local authorities34.
The commercial terms of the administration role are not public. The Energy Saving Trust was awarded a new contract following a competitive tender to administer and manage Scottish Government heat and energy efficiency schemes, starting 1 December 2023, with an initial term running until November 202635. Requests for the amount paid have been refused: the sum for administration of the Home Energy Scotland Grant and Loan Scheme from December 2023 onwards was withheld under Regulation 10(5)(e) of the Environmental Information Regulations, confidentiality of commercial or industrial information35, and a parallel refusal covers the management of the wider heat and energy efficiency schemes36.
That is a genuine limit on transparency. The measures delivered are counted and published; the administration cost of one of the largest devolved schemes is not.
What the statistics mean for household energy independence
Obligation-funded retrofit reduces demand rather than replacing supply. A home that has had cavity walls or a loft insulated under ECO still buys all its energy from a supplier on the grid or gas network; what changes is how much it has to buy. Given that an uninsulated dwelling is estimated to lose a third of its heat through the walls and a further quarter through the roof31, demand reduction is the largest single lever most households have, and it is the one that does not depend on an app, a manufacturer's cloud service or a tariff staying favourable.
The dependencies that remain are worth naming plainly. Access to ECO runs through obligated suppliers, not through the household: a homeowner cannot simply apply and receive a measure. Delivery depends on a TrustMark-registered business being available in the area9, and on supply chain capacity, which is itself one of the things the statistics track1. Quality depends on a certification and audit chain whose outcome data is not yet published alongside the measure counts19. And the savings attributed to each measure are expected savings at handover12, not measured savings in occupation.
For a householder reading the series, three habits help. Treat the most recent months as provisional7. Distinguish measures from homes, since the ratio has run at 1.47 measures per household receiving measures3. And check the extent before quoting a figure, because the ECO series covers England, Scotland and Wales1 while the Warm Homes: Local Grant series covers England alone17. The broader framing of how deployment data bears on self-sufficiency is set out in what the data says about household energy independence, within the wider UK home energy statistics collection.
Sources36 cited
- Household Energy Efficiency Statistics, headline release June 2026, GOV.UK, 25 June 2026
- ECO scheme research briefing, UK Parliament, December 2025
- Household Energy Efficiency Detailed Release, March 2023, GOV.UK, 30 March 2023
- Energy Company Obligation ECO3 final determination report, Ofgem, 9 February 2023
- Household Energy Efficiency National Statistics, headline release December 2015, GOV.UK, 17 December 2015
- Household Energy Efficiency National Statistics, headline release May 2018, GOV.UK, 17 May 2018
- Household Energy Efficiency Statistics, headline release October 2022, GOV.UK, 27 October 2022
- ECO4 Measures Table, Ofgem, 11 October 2022
- ECO4 New Measures and Products Guidance, Ofgem, 26 March 2026
- National Energy Efficiency Data-Framework: impact of measures data tables 2025, GOV.UK, 26 June 2025
- Energy Company Obligation contacts, guidance and resources, Ofgem, 2026
- ECO4 supplier administration guidance, Ofgem, 6 July 2026
- Solid wall insulation installed under ECO4 and GBIS: statistical audit results, GOV.UK, 3 November 2025
- Great British Insulation Scheme release, August 2024, GOV.UK, 22 August 2024
- Green Homes Grant LAD and HUG release, November 2025, GOV.UK, 27 November 2025
- Green Homes Grant LAD and HUG release, May 2025, GOV.UK, 29 May 2025
- Warm Homes: Local Grant statistics, May 2026, GOV.UK, 28 May 2026
- Warm Homes: Local Grant statistics, August 2026, GOV.UK, 27 August 2026
- Reforming consumer protection for home upgrade schemes consultation, GOV.UK, 17 June 2026
- MCS domestic retrofit battery installations data, GOV.UK, 28 May 2026
- Energy Performance of Building Certificates, England and Wales, April to June 2025, GOV.UK, 31 July 2025
- Warm Homes statistics methodology and background note, GOV.UK, 27 August 2026
- Energy Performance Certificates, nidirect, 26 February 2026
- Energy efficiency characteristics of new dwellings, GOV.UK, 4 February 2026
- DESNZ Public Attitudes Tracker, winter 2025, GOV.UK, 12 March 2026
- UK local authority and regional greenhouse gas emissions statistics, 2005 to 2024, GOV.UK, 25 June 2026
- Commons Library debate pack on energy costs, House of Commons Library
- Energy efficiency advice, Torridge District Council
- Financial help for energy efficiency and low carbon heating improvements, City of Edinburgh Council
- Our data and methodology, Energy Saving Trust, 1 September 2026
- Scottish House Condition Survey 2024 key findings, Scottish Government, February 2026
- Tips to improve the EPC rating of your home, Energy Saving Trust, 3 August 2026
- Home Energy Scotland Grant and Loan Scheme processing times, Scottish Government, 12 March 2026
- Energy Efficient Scotland Area Based Schemes committee paper, Glasgow City Council
- FOI response on Energy Saving Trust scheme administration, Scottish Government, 22 July 2025
- FOI response on payments to the Energy Saving Trust, Scottish Government, 20 January 2025
 Housing Stock Data for WalesHow energy efficient are Welsh homes, and how many have a rating?
 Housing Stock Data for EnglandHow energy efficient are English homes, and how many have insulation or low carbon heating?
 New Build Energy PerformanceHow energy efficient are new build homes compared with older ones?
 Housing Stock Data for ScotlandScotland's housing is measured differently from England's, so the numbers you see may not compare directly.
 EPC StatisticsHow energy efficient are UK homes, and is it getting better?
 The Full Statistics GuideHow many homes in the UK have solar panels, heat pumps or batteries?