
In this guide
Community energy statistics in the UK are not a single dataset. They are a set of overlapping counts: community-owned generation capacity, the number of locally owned projects, the organisations that own them, and the share of a nation's electricity consumption that renewable generation covers. The most detailed published series covers Wales, where the Welsh Government reports locally owned renewable capacity alongside total installed capacity, and where the gap between the two measures is the point of the exercise.
The headline numbers are these. Wales had 0.99 GW of locally owned renewable energy at the end of 2024, against a target of at least 1.5 GW by 2035, and 4.3 GW of renewable energy capacity was installed in Wales during 20241. Renewable generation equalled 54% of Welsh electricity consumption in 20242. The project count is dominated by households: Welsh statistics recorded 78,373 locally owned projects in 2021, including around 56,200 domestic solar PV projects and over 10,500 domestic heat pumps3.
For a household, the relevance is direct. Locally owned capacity is the part of the system a community, a public body or a household itself can own, and it is measured separately precisely because ownership changes who captures the benefit. What follows sets out what the statistics cover, how the Welsh series is built, how it has changed, and where the remaining dependence on the grid and on national infrastructure sits.
What the UK community energy statistics actually cover
The UK-wide statistical picture is built from general energy publications rather than a dedicated community energy series. UK energy in brief is described as a summary of some of the key annual statistics in the UK energy system, and carries accredited official statistics status5. Energy consumption in the UK carries the same accreditation6. These are the top-level publications; community and locally owned capacity is reported within them only as part of the wider renewable picture.
Historically, the coverage has been broad rather than granular. Energy Trends has been described as statistics on all major aspects of energy in the UK7, and the Digest of United Kingdom Energy Statistics as providing a detailed and comprehensive picture of the production and consumption of individual fuels and of energy as a whole8. Monthly energy statistics have covered UK production and consumption of coal, electricity, gas, oil and total energy up to a stated month end9.
The one UK-wide community energy figure in the older record is striking for its age. A 2019 consultation stated that the equivalent of 67,000 homes in England and Wales were being powered by community energy, making a saving of 71,00010. That figure covers England and Wales only, and it is a homes-powered equivalent rather than a capacity measure, which is why it cannot be compared directly with the gigawatt figures used in Wales today.
Two structural points follow. First, community energy in the UK is measured through different instruments in different nations, so a UK-wide total requires assembling figures that were not designed to sit together. Second, the Community Energy Saving Programme, an older scheme, was targeted at households across Great Britain, which excludes Northern Ireland11. Where a household sits in the UK therefore determines which statistics describe it.
Wales locally owned renewable energy: capacity, projects and generation
Wales is the part of the UK with the most developed published series on locally owned renewable energy, and the numbers reward close reading because the project count and the capacity count tell different stories.
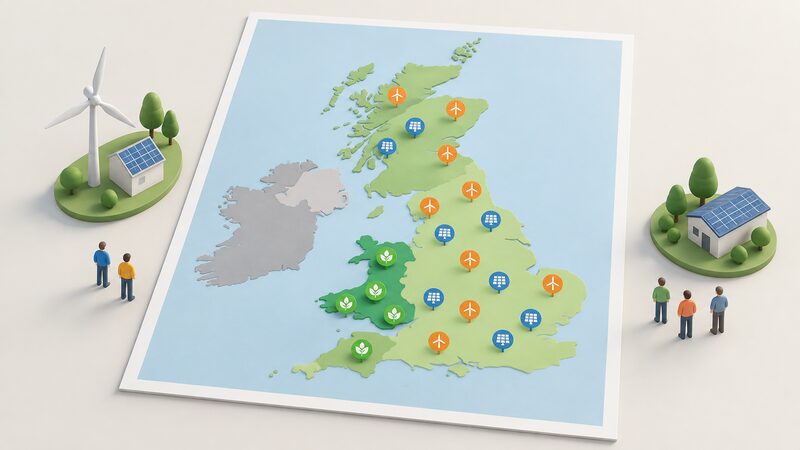
In 2021, Welsh statistics recorded 78,373 locally owned projects with 581 MWe of electrical capacity, 316 MWth of heat capacity and 1,928 GWh of generation3. Of that total, domestic installations accounted for 70,575 projects, 209 MWe, 142 MWth and 500 GWh3. Over 5,500 locally owned renewable electricity and heat projects were commissioned in Wales in 2021, bringing the total to around 78,500, and the additional capacity that year was over 40 MW, consisting of 18 MW of electrical capacity and 22 MW of heat3.
By 2023 the estimated project total had risen to 89,6321. The 2021 report also recorded around 56,200 domestic solar PV projects and over 10,500 domestic heat pumps3. The dominance of domestic solar in the project count is the single most important feature of the series: locally owned capacity in Wales is, in project terms, mostly rooftop.
The capacity target has moved. Wales previously had a target of 1 GW of locally owned renewable energy capacity by 2030, and the Welsh Government raised its local ownership target to 1.5 GW by 20351. The current formulation is at least 1.5 GW of renewable energy capacity to be locally owned by 2035, excluding heat pumps12. The same target appears in the Welsh Government's renewable energy deep dive, in a written statement on the renewable energy targets consultation, in the Energy Use in Wales report, and in the UK Solar Roadmap12.
"for at least 1.5GW of renewable energy capacity to be locally owned by 2035, excluding heat pumps."
The exclusion of heat pumps matters. Heat pumps appear in the project and heat capacity counts, but they do not count towards the 1.5 GW local ownership target, so a household installing one adds to the project statistics without moving the headline target.
Wales renewable electricity: share of consumption and generation mix
The share-of-consumption measure is the one most often quoted, and it needs its definition stated because two different shares circulate.
In 2021, Welsh renewable generation was equivalent to approximately 55% of Wales's electricity consumption, and an estimated 28% of total electricity generation in Wales came from renewable sources3. The 2022 figure was 59% of total electricity consumption14. In 2023, renewable electricity generation in Wales was equivalent to 53% of its electricity consumption, including losses1. In 2024, renewable generation equalled 54% of electricity consumption2.
The distinction between share of consumption and share of generation is not cosmetic. Consumption is what Wales uses; generation is what Wales produces. A nation can generate the equivalent of more than half its consumption from renewables while renewables form a much smaller share of everything generated on its territory, because it also generates substantial non-renewable electricity for export. The 2021 figures show both at once: approximately 55% of consumption, 28% of total generation3.
Wind dominates the renewable electricity mix. In 2021, 70% of all renewable electricity generation in Wales was from onshore and offshore wind3. Approximately 76% of renewable energy capacity in Wales generates renewable electricity, with the remainder providing heat3. Electricity consumption itself represents approximately 16% of Wales's estimated 92.8 TWh total energy consumption3, which is a reminder that electricity is a minority of total energy use even where renewable electricity targets are the headline.
Regionally, two-thirds of renewable electricity capacity in Wales comes from the Swansea Bay City and Cardiff Capital regions, which represent 33% (925 MW) and 29% (824 MW) respectively, with North Wales at 23% (639 MW) and Mid Wales at 419 MW, or 15%3. North Wales accounts for 23% of Wales's total onshore renewable electricity generation1.

Hydropower and pumped storage in Wales: capacity and project scale
Hydropower in Wales is a story of two very different scales: a small number of very large pumped storage sites, and a long tail of small run-of-river schemes.
Wales is home to two operational pumped hydropower energy storage sites, with a combined capacity of 2.1 GW and approximately 11 GWh of storage capacity1. The 2021 statistics recorded pumped hydropower at 2,088 MW across two projects3. The two sites are Ffestiniog at 360 MW and Dinorwig at 1.7 GW, with Glyn Rhonwy at 100 MW contributing to a total of over 2.1 GW of storage3.
Conventional hydropower is far smaller in capacity terms but far larger in project count. Wales's total hydropower capacity is 170 MW across 380 sites1. The 2021 statistics recorded 376 projects, 170 MW and 338 GWh of estimated generation3. Since 2010, all 290 hydropower projects deployed were under 1 MW, with an average capacity of 77 kW, except a 1.8 MW project commissioned in Carmarthenshire in 20203. In 2021 there were seven new hydro projects commissioned across Wales, with a total capacity of 0.4 MW, all under 100 kW and all but one in North Wales3.
Battery storage is the newer part of the picture. There were 11 projects with a capacity greater than 150 kW with planning permission or under construction in Wales, plus nine applications submitted, two of almost 50 MW3. Commercial-scale battery storage stood at 26.6 MW across three projects in 20213. By 2023, two battery energy storage system projects were under construction in Wales, amounting to more than 1 GW of capacity1.
| Technology | Projects | Capacity | Generation |
|---|---|---|---|
| Pumped hydropower (2021) | 2 | 2,088 MW | not applicable |
| Hydropower (2021) | 376 | 170 MW | 338 GWh |
| Commercial-scale battery storage (2021) | 3 | 26.6 MW | not applicable |
| Heat pumps (2021) | 11,171 | 122 MW heat | 199 GWh |
The independence point is that pumped storage is the one form of storage that lets a nation hold large volumes of electricity rather than import it at peak. At 2.1 GW combined and approximately 11 GWh, the two Welsh sites are national infrastructure, not household assets, and a household's own independence does not extend to them.
Progress against Wales's renewable energy targets

Wales has a layered set of targets, and progress against them is reported at different dates, which is why the figures appear to disagree.
The electricity targets are: the equivalent of 70% of electricity demand from Welsh renewable electricity sources by 2030, and 100% of annual electricity consumption from renewable electricity by 2035, continuing to keep pace with consumption thereafter3. The 2035 target is also stated as 100% renewable electricity generation2. A separate target covers 5.5 GW of renewable energy capacity provided by heat pumps by 203512.
The local ownership target is at least 1.5 GW by 2035, raised from a previous 1 GW by 203013. At 0.9 GW, Wales was 60% of the way towards its new target as of 20231. At the end of 2024, the figure was 0.99 GW2. The Welsh Government has also pledged to expand renewable energy generation by public bodies and community groups in Wales by over 100 MW by 20263.
The target-setting process itself has a documented history. A consultation on Wales's renewable energy targets was to be published before the end of 2022, and was published in January 2023, closing on 18 April, with updated targets to be published by summer 202316. The Welsh Government's stated aim is to maximise local ownership, retaining economic and social benefits in Wales12. A consultation on community ownership recommended a 10% offer for community ownership, meaning individuals and households, and 10% of local ownership for any Wales-based organisation17.
The Climate Change Committee's advice on Wales's fourth carbon budget provides an independent view of the pathway. Its Balanced Pathway for Wales provides 78% of electricity generation from variable renewables by 2033, catering for increasing demand in Wales as well as the rest of Great Britain16.
Energy Saving Trust: the organisation behind much of the data
The Energy Saving Trust appears throughout UK home energy statistics in two distinct roles: as an adviser and grant administrator, and as a regulated entity in its own right. Keeping those roles separate matters when reading figures attributed to it.
It is described in HMRC guidance as a grant-awarding body, listed among agencies of that kind19. It is authorised and regulated by the Financial Conduct Authority under firm reference number 716195, and it delivers the District Heating Loan Fund4. Its helpline number is 0300 123 1234, and its stated services are free and impartial advice on how to reduce carbon emissions, how to use water more sustainably and how to save money on energy bills20.
In Scotland its role is contractual and specific. The Energy Saving Trust, in partnership with advice providers and energy companies, manages Scottish Government home energy schemes on the Scottish Government's behalf21. Home Energy Scotland is administered by the Energy Saving Trust on behalf of the Scottish Government22, and can give free impartial advice on energy efficiency and renewable energy in Scotland23. A Freedom of Information response records that the Energy Saving Trust was awarded a new contract as part of a competitive tender exercise to administer and manage Scottish Government Heat and Energy Efficiency live and closed grant and loan schemes, with a contract start of 01 December 2023 and an initial term running until November 202624. The amount paid to it for administration of the Home Energy Scotland Grant and Loan schemes from December 2023 onwards was withheld under Regulation 10(5)(e) of the Environmental Information Regulations, covering confidentiality of commercial or industrial information24.
For a household, the practical consequence is that advice from the Energy Saving Trust is free at the point of use, but the organisation is not a neutral bystander in the market: it administers public money, holds FCA authorisation, and operates under contract to at least one devolved government. Its name is also used by others, which is why it has developed a verification service for properties in England and Wales allowing users to check that a caller claiming to represent it is genuine25.

Savings figures householders can use: heating, insulation and solar
The published savings figures are estimates for average households, and they vary widely by measure and by source. They are useful as orders of magnitude, not as forecasts.
Heating is the largest single component. Heating accounts for over half of most UK energy bills26. On thermostat settings, two independent guidance sources give the same range: 18°C to 21°C for comfort and efficiency26, and 18-21°C to help keep a household safe and well27. On draught-proofing, Cadent Gas states that 21% of heat loss in a home is through windows and doors, and that draught-proofing both could save the average household £40 a year27.
Solar figures are larger and more variable. Plug-in solar panels are stated to save households up to £110 a year on bills through clean, homegrown power28. Rooftop solar is stated to save families up to £480 a year29. A Solar Energy UK report, The Value of Solar Property, estimated that a solar energy system could add £1,800 to the value of an average home and save over £300 on energy bills30.
| Measure | Stated saving | Source type |
|---|---|---|
| Draught-proofing windows and doors | £40 a year, average household | Independent guidance27 |
| Plug-in solar panels | up to £110 a year | Official press release28 |
| Rooftop solar | up to £480 a year | Official press release29 |
| Solar energy system (bill saving) | over £300 | Solar Energy UK report30 |
The spread between the solar figures reflects different system sizes, different assumptions about self-consumption, and different dates. A household reading them should treat the range, not any single number, as the honest answer. The £40 draught-proofing figure is the smallest and the most robust in the sense that it depends least on behaviour.
Where to find official energy statistics and updates

The publication landscape is stable and the accreditation status of each series is stated openly, which is what allows a reader to judge how much weight to place on a figure.
UK energy in brief 2026 is an accredited official statistics publication, first published on GOV.UK on 30 July 2026 and last updated on 3 August 20265. Energy consumption in the UK 2025 is also accredited official statistics, last updated on 20 April 20266. The Energy Trends and Prices statistical release is published by the Department for Energy Security and Net Zero5.
Domestic electricity consumption indicators are published separately by jurisdiction: the Department for Energy Security and Net Zero (Great Britain) for Great Britain, and the Department for Energy Security and Net Zero (Northern Ireland) for Northern Ireland31. This split is the practical reason a UK-wide household consumption figure has to be assembled rather than read off a single page.
For Welsh figures, the Energy Generation in Wales series and the Energy Use in Wales series are the primary sources, with the 2023 edition published in February 20251. The Welsh Government's renewable energy deep dive and its written statements on target consultations carry the policy targets and the reasoning behind them12.
For a household trying to place its own situation in context, the most useful starting points are the UK home energy statistics pillar and the guide to official energy statistics publications, which explain how the release calendar and revisions work. The regional and local energy consumption statistics page covers the sub-national breakdowns, and renewable generation statistics by UK nation sets the four nations side by side.
What community energy means for household independence
Community energy statistics measure a specific kind of independence: ownership. A locally owned project keeps the economic benefit in the area where the generation happens, which is the stated Welsh Government aim of maximising local ownership and retaining economic and social benefits in Wales12. A consultation on Wales's well-being goals put it more broadly: strong support for community ownership of renewable energy should support greater resources into community action and enterprise17.
The scale of the ownership share is modest. The recommended community ownership offer for renewable energy developments in Wales is 10% for individuals and households, and 10% of local ownership for any Wales-based organisation17. That is a share of a development, not control of it. A household that buys into a community scheme, or installs its own solar, holds an asset; a household that does neither holds no ownership stake at all, however much renewable generation is built around it.
The dependence that remains is substantial and worth stating plainly. Locally owned capacity in Wales stood at 0.99 GW at the end of 2024 against 4.3 GW of renewable capacity installed during 2024, so the great majority of Welsh renewable capacity is not locally owned1. Pumped storage, at 2.1 GW across two sites, is national infrastructure1. Grid connection, balancing and the wholesale market remain outside any household's control. A community energy scheme changes who owns a generator; it does not change who operates the network.
The affordability context makes ownership consequential. In England, 36.4% of households, or 8.91 million, were spending more than 10% of income on domestic energy after housing costs in 2023, up from 20.5%, or 4.93 million, in 202132. That is a near doubling in two years. Against that background, the £40 a year from draught-proofing and the up to £110 a year from plug-in solar are small sums, and the up to £480 a year from rooftop solar is larger but requires capital and a suitable roof27.
The honest summary is that community energy statistics describe a real but minority share of UK generation, concentrated in household-scale solar in Wales and in a long tail of small hydro. They give a household a way to measure whether it owns any part of the system it depends on. They do not measure whether that system keeps running when the wind does not blow, and that dependence on the grid, on suppliers and on national storage remains.
Sources32 cited
- Energy Generation in Wales 2023, Welsh Government, 2025-02
- Energy Generation and Energy Use in Wales: first combined edition, Welsh Government, 2026-03-18
- Energy Generation in Wales 2021, Welsh Government, 2022-12
- District Heating Loan Fund, Energy Saving Trust, 2026-02-19
- UK energy in brief 2026, GOV.UK, 2026-07-30
- Energy consumption in the UK 2025, GOV.UK, 2026-04-20
- Energy Trends: June 2016, GOV.UK, 2016-06-30
- Digest of UK Energy Statistics 2016, GOV.UK, 2017-07-27
- Energy Trends and Prices statistical release, 31 August 2017, GOV.UK, 2017-06
- The future for small-scale low-carbon generation, GOV.UK, 2019-01
- Carbon Budget Delivery Plan, GOV.UK, 2023-03-30
- Renewable energy deep dive: biannual recommendations update 2, Welsh Government, 2023-04-27
- Summary of responses: consultation on Wales renewable energy targets, Welsh Government
- Energy Use in Wales report, third edition, Welsh Government
- UK Solar Roadmap, Department for Energy Security and Net Zero
- Wales fourth carbon budget, Climate Change Committee
- Preparing Wales for a renewable energy 2050, Welsh Government, 2023-10
- Energy Generation in Wales 2021: written statement, Welsh Government
- VAT energy saving materials and grant funded heating supplies, HMRC, 2026-09-17
- Energy Efficiency Advice, Torridge District Council, 2026-09-17
- Home energy and fuel poverty: energy saving home improvements, Scottish Government, 2026-09-17
- Research briefing CBP-9585, House of Commons Library, 2026-05-13
- Domestic Renewable Heat Incentive: who to contact, Ofgem, 2026-09-17
- FOI 202500462873, Scottish Government, 2025-07-22
- ECO4 delivery guidance version 4.0, Ofgem, 2026-03-26
- What are the best energy saving tips for households in the UK?, British Gas Energy Trust, 2026-04-21
- Energy efficiency, Cadent Gas, 2026-09-20
- Households can save as plug-in solar panels come to market, GOV.UK, 2026-08-26
- Britain continues to break clean power records, GOV.UK, 2026-05-28
- Research briefing CBP-10170, House of Commons Library, 2025-01-15
- Domestic electricity consumption indicator, Office for National Statistics, 2025-12-18
- Energy security and net zero Committee report, House of Commons, 2021
 Community Energy in WalesWales wants more of its energy owned by local people, not big companies.
 Community Energy in the UKWhat community energy means in practice, the legal structures used, and the types of project householders can join or benefit from.
 Community Energy in EnglandCommunity energy lets neighbours own their own power together, often through solar panels, and share the money it makes.
 Renewable Generation by NationHow much of our electricity comes from renewables, and why do the figures keep changing?
 Community Wind and HydroExplains how community-owned wind and hydro projects are organised, financed and shared with local households, and the scale of installed community capacity across the UK.
 Energy Supply in WalesWales makes more electricity than it uses, but how much of it comes from renewables, and will that reach all of it by 2035?