
In this answer
Short answer
The UK's installed solar capacity stood at nearly 24 GW as of September 2026, according to University of Sheffield PV_Live data1. That figure covers every scale of installation, from rooftop domestic systems to ground-mounted solar farms. It is the most recent single number available, and it sits at the top of a growth curve that has been steepening since 2022.
The trajectory matters as much as the total. The UK had 2.7 GWp of PV capacity in 20142, 11,429 MW by November 20163, 15.7 GW by January 20244 and 20 GW at the end of 20245. In 2025 alone the UK added 2.8 GW, more than in any year since 2015, bringing the national total to 21.7 GW6. Capacity is reported as a jump of 3 GW, or 18%, year on year1.
For a household, the national figure is context rather than a personal calculation. What it shows is that solar is no longer a niche technology in the UK. It also shows the shape of the fleet: domestic solar made up 30% of UK solar capacity but 84% of total installations at the start of 20267. Most systems are small and on roofs; most of the megawatts sit in larger arrays.
What the headline figure covers
The nearly 24 GW figure is a measure of installed capacity, not generation. Capacity is the maximum output a fleet could produce under standard test conditions; actual output depends on sunlight, temperature, shading and how much of the fleet is exporting or storing. A capacity figure therefore tells you how much solar hardware exists, not how much electricity it produced in any given hour.
The measurement itself is not a single official count. The University of Sheffield's PV_Live model estimates installed capacity from a range of inputs, and it is the source behind the September 2026 figure of nearly 24 GW1. Other readings in the same period put the total at 25 GW in July 202610 and 23 GW in June 202611. These are not contradictory in any meaningful sense: they are different estimates, taken at different moments, using different methods. The documents do not resolve the difference, and a household should treat any single figure as an estimate within a band rather than a precise count.
Official statistics have tracked the same fleet over time. The Department for Energy Security and Net Zero publishes monthly deployment figures covering all solar photovoltaic capacity in the United Kingdom, with releases covering periods up to April 202112, August 201913, November 201714, October 201715 and December 201416. Energy Trends Section 6 covers renewables deployment in the same territory17. These releases are the historical backbone of the series, and they show the same pattern: steady growth, a slowdown after subsidy changes, and a sharp acceleration from 2022 onwards.
The distinction between capacity and generation matters for energy independence. A household with its own panels is not relying on the national figure at all; it is generating behind its own meter. The national capacity total is a measure of how much of the country's electricity could come from solar under the right conditions, not a promise about any individual home's supply.
How capacity has grown, and why the pace changed
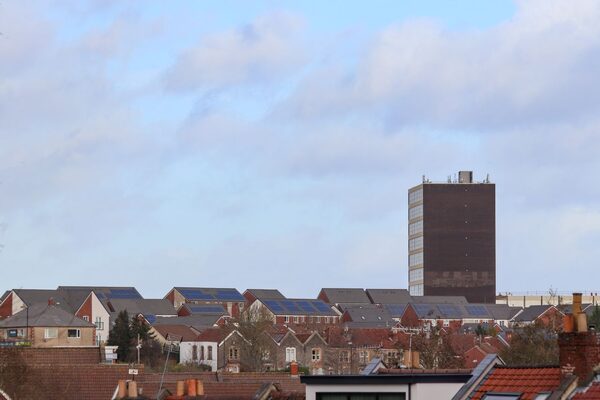
The growth curve has three distinct phases. The first runs from the early 2010s to the mid-2010s, when the UK Solar PV Strategy recorded 2.7 GWp of capacity and projected that the UK had the potential to install up to 20 GWp early in the next decade2. By the end of September 2014, capacity had already reached 4.3 GW18. By November 2016 the overall UK solar PV capacity stood at 11,429 MW3.
The second phase is the slowdown. Analysis found that if solar deployment had continued at 2014 levels, there would have been an extra 15 GW in place by the end of 202419. That is a modelled counterfactual rather than a measurement, but it captures how much the pace fell away once subsidy support changed. The industry itself noted that 2022 was on track to exceed the one gigawatt installed in 2016, when government subsidies were still available20, which puts the intervening years in perspective.
The third phase is the recovery. In the first six months of 2022, 556 MW of capacity was connected at all scales20. By 2023 Solar Energy UK estimated the UK had at least 15 GW of solar power capacity in place, about two thirds on the ground and the remainder on residential and commercial roofs21. By January 2024 the total stood at 15.7 GW4, and by the end of 2024 it had reached 20 GW5. The 2025 addition of 2.8 GW was the largest since 20156, and capacity growth of up to 17% was expected across that year22.
The drivers are not hard to identify. Energy price volatility pushed households towards self-generation, and the industry described the period as one of massive growth driven by the price crisis23. Rooftop installations doubled in a year at one point24. The result is a fleet that has grown from a few gigawatts to nearly 24 GW in roughly a decade, with most of the recent momentum coming from smaller installations rather than large farms.
Who the capacity belongs to
The split between domestic and non-domestic capacity is the most useful breakdown for a household trying to place itself in the national picture. At the start of 2026, domestic solar comprised 30% of UK solar capacity and 84% of total UK solar installations7. In other words, the overwhelming majority of installations are domestic, but they account for less than a third of the megawatts.
That asymmetry has a simple explanation. A domestic rooftop system is typically a few kilowatts; a ground-mounted solar farm or a large commercial roof can be many megawatts. A single large array can therefore carry as much capacity as hundreds of homes. The 2023 estimate that about two thirds of UK solar capacity was on the ground and the remainder on residential and commercial roofs21 describes the same pattern from the other direction.
For a household, the practical implication is that the national capacity figure is not a measure of how much solar is on homes like theirs. It is a measure of the whole fleet, and the domestic portion of it is the part that matters for self-consumption. A home with panels is generating for its own use first and exporting the surplus; the national total includes capacity that is entirely grid-facing.
The territorial picture is also worth noting. Official statistics cover the United Kingdom as a whole16, and the deployment releases are explicitly UK-wide12. Where a policy differs between the four nations, that is a planning matter rather than a capacity one, and it is covered below.
The targets, and the gap to them
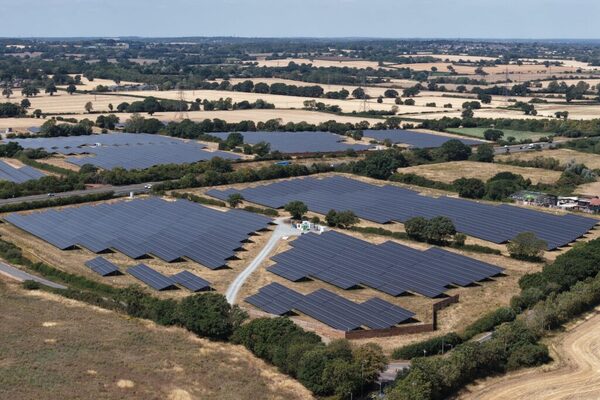
The UK's solar ambitions are set out in several places, and they do not all use the same number. The British Energy Security Strategy stated that solar capacity could grow up to five times by 203525. Solar Energy UK has cited at least 40 GW installed by 2030 as the level recommended by the Climate Change Committee26. The government ambition cited in the industry is 45 to 47 GW of solar nationally by 2030, up from around 20 GW at the time it was set out8. The Climate Change Committee's own pathway puts solar capacity at 82 GW by 20409.
The gap between where the UK is and where it needs to be is the subject of active debate. Solar Energy UK has said the UK will need to nearly treble the amount of solar installed over the next decade27. Carbon Brief reported that around another 5 GW was required by the end of the decade to reach government targets6. Ofgem's own consultation expected solar capacity to increase from 14 GW to 70 GW by the end of the decade28, and MCS has cited a government target of 70 GW by 203529.
These figures are not all measuring the same thing at the same date, and they should be read as a set of ambitions rather than a single trajectory. What they share is the direction: every published target implies a substantial increase on the current total. For a household, the targets are a signal about the direction of policy and grid planning, not a prediction about any individual installation.
Planning rules: what applies where
Planning is where the conditions and exceptions sit, and they differ by nation and by the type of installation. For non-domestic solar photovoltaic equipment on roofs and walls in England, the permitted development output limit was raised to 1 megawatt, up from 45 kilowatts30. Solar equipment not on a roof is limited to 50 kilowatts of microgeneration output30. Installations above the 1 megawatt limit are allowed subject to prior approval31.
The 1 megawatt figure has a longer history. In 2014 the UK Government released its solar strategy to increase non-domestic permitted development rights for non-domestic solar panels to 1 megawatt, again up from 45 kilowatts32. The December 2023 update confirmed that non-domestic installations were allowed to exceed 1 megawatt in capacity, where that had previously been the total limit31. The direction of travel is towards larger permitted installations without a full planning application.
The territorial extent of these rules matters. The call for evidence on solar on car parks and electric vehicle charging applies to England, Northern Ireland and Wales33, which is a reminder that planning is devolved and that a rule in one nation does not automatically apply in another. Scotland has its own permitted development regime for non-domestic solar panels and domestic air source heat pumps34. A household or business considering an installation should check the rules for its own nation rather than assume the English position applies.
For domestic rooftop solar, the position is generally more permissive than for ground-mounted arrays, and permitted development rights cover most typical home installations. The exceptions tend to involve listed buildings, conservation areas and flats, where a full application may be needed. The capacity figures themselves are not affected by planning rules; the rules affect how easily new capacity can be added.
What the capacity figures mean for a household

The national total is a backdrop, not a personal forecast. A household considering solar is making a decision about its own roof, its own consumption and its own export arrangements, and the national figure of nearly 24 GW1 does not change any of those variables. What it does show is that the technology is mainstream, that supply chains and installer networks exist across the country, and that the grid is increasingly used to handling distributed generation.
The independence a household gains from solar is partial and specific. A rooftop system generates behind the meter, which reduces the amount of electricity bought from a supplier during daylight hours. It does not disconnect the home from the grid, and it does not remove the need for a supplier for the hours when the panels are not generating. A battery can shift some generation to the evening, but the grid remains the backup. The national capacity figure is a measure of how much of the country's electricity could come from solar; it is not a measure of how independent any individual home is.
The domestic share of installations, 84% at the start of 20267, is the more relevant number for a household. It shows that the vast majority of solar installations in the UK are on homes, not on solar farms. The domestic share of capacity, 30%7, shows that those homes collectively account for a substantial but minority slice of the megawatts. Both figures are consistent with a fleet that is broad and shallow at the domestic level and concentrated at the utility level.
For households wanting to place their own installation in context, the UK solar PV deployment statistics page covers the official series in more detail, and the MCS installation statistics page covers certified installations by technology and date. The UK home energy statistics pillar page sets solar alongside the other deployment and price data.
Sources34 cited
- UK solar power hits record high over summer 2026, Carbon Brief, 2026-09-04
- UK Solar PV Strategy Part 2, UK Government, 2014-04
- Fire and solar PV systems literature review, UK Government, 2016-11
- Green energy statistics, Uswitch, 2024-01
- Economic impact of solar and battery storage, Solar Energy UK, 2025-04
- CCC: faster electrification will put money back into people's pockets, Carbon Brief, 2025
- POST note 0771, Parliament, 2026
- Setting the standard: product certification and the future of UK solar, MCS, 2025-12-08
- The Seventh Carbon Budget, Climate Change Committee, 2025
- Dear Prime Minister: the sunlit uplands are this way, Solar Energy UK, 2026-07-16
- UK solar homes power equivalent of five hours of daily air con use during heatwave, Ember, 2026-06
- Solar PV deployment: April 2021, Department for Energy Security and Net Zero, 2021-04-30
- Solar PV deployment: August 2019, Department for Energy Security and Net Zero, 2019-09-26
- Solar PV deployment: November 2017, Department for Energy Security and Net Zero, 2017-11-30
- Solar PV deployment: October 2017, Department for Energy Security and Net Zero, 2017-10-31
- Solar PV deployment: December 2014, Department for Energy Security and Net Zero, 2015-01-29
- Energy Trends Section 6: Renewables, Department for Energy Security and Net Zero, 2013-01-09
- Five things we learned from DECC's annual energy statement, Carbon Brief, 2014-09-30
- Cutting the green crap has added £22bn to UK energy bills since 2015, Carbon Brief, 2024
- Energy price crisis drives massive growth in UK solar power, Solar Energy UK, 2022-07-14
- Rooftop solar power installations double in a year, Solar Energy UK, 2023-02-24
- Ignore the doubters: the UK is seizing the solar opportunity, Solar Energy UK, 2025-07-01
- The 2020s will see solar flourish, Solar Energy UK, 2021-06-17
- Britain benefits from the summer sun as July smashes solar generation record, Solar Energy UK, 2025
- Major acceleration of homegrown power in Britain's plan for greater energy independence, UK Government, 2022
- Solar Wizard calculator, Centre for Sustainable Energy, 2030
- What the solar industry really wants: commitment, Solar Energy UK, 2021-06-17
- Smoothing the journey: engaging domestic consumers in energy flexibility, Ofgem, 2023-08-17
- Solar power must be mainstay for new building regulations, MCS, 2023-01-12
- Permitted development rights for non-domestic solar panels, Scottish Government, 2026-09-17
- Updates in December to permitted development rights for solar panels, Planning Portal, 2023-12-21
- Permitted development rights for non-domestic solar panels and domestic air source heat pumps, Scottish Government, 2014
- Solar on car parks and electric vehicle charging, UK Government, 2025-05-07
- Permitted development rights: impact assessments, Scottish Government, 2015
 Solar PV Deployment StatisticsHow much solar power does the UK actually have, and how much of it sits on people's roofs?
 Data and Energy IndependenceHow many UK homes actually make their own power, and is that number really growing?
 System SizingMost UK homes need a solar system of around four kilowatts, which takes up roughly twenty square metres of roof.
 Home Battery Install StatisticsHow many homes in the UK actually have a battery, and is that number growing quickly?
 Solar Panel CostsA typical UK home pays somewhere between four and eleven thousand pounds for solar panels fitted, with most landing in the middle.
 The Full Statistics GuideHow many homes in the UK have solar panels, heat pumps or batteries?