

In this guide
Fuel poverty statistics in the UK are not a single count. They are modelled estimates, produced separately in each nation, from survey data and price assumptions that are several steps removed from any individual household's meter. In England alone, some 2.7 million households are trapped in fuel poverty1, and the average fuel poverty gap in England stands at £4072. The estimated number of households in fuel poverty across the UK ranges from 4.1 million to 7.5 million3.
The reason there is no single UK number is structural. Fuel poverty is a devolved policy area, defined and measured differently in different parts of the UK, and the rates are not directly comparable between nations3. England uses the Low Income Low Energy Efficiency method, Northern Ireland uses the 10 per cent indicator, Scotland uses a definition set in the Fuel Poverty (Targets, Definition and Strategy) (Scotland) Act, and Wales uses its own 10 per cent measure4.
What follows is how those numbers are built: the definitions behind them, the surveys that feed them, the publication cycle, the sub-regional breakdowns, and the lag that means the figures always describe a year already past.
What fuel poverty statistics measure, and who produces them
A fuel poverty statistic is a model output, not a measurement. The ONS article on how fuel poverty is measured in the UK was written in consultation with the producers of fuel poverty statistics to help users understand the differences between the national measures7. It covers the three main influences the models work with: energy efficiency, household income and energy prices7.
In England, the Department for Energy Security and Net Zero produces the figures. A household is considered fuel poor if it has a Fuel Poverty Energy Efficiency Rating (FPEER) of band D or below and a residual income below the official poverty line after modelled energy costs4. That is a two-part test: the home must be inefficient and the household must be poor after energy is paid for. A household with a low income in an efficient home does not count, and neither does a household in a leaky home with a comfortable income.
The producer matters because it determines the method. England's figures come from the Department for Energy Security and Net Zero3. Scotland's come from the Scottish Government, which is required under the Fuel Poverty Act 2019 to publish three-year periodic reports on progress8. Wales publishes modelled estimates through the Welsh Government4. Northern Ireland's figures come from the Northern Ireland Housing Executive4.
The older Fuel Poverty Indicator, a statistical model of fuel poverty based on the 2003 English House Condition Survey and 2001 Census, shows how long this modelling tradition runs9. It is a reminder that the numbers have always been estimates built on survey foundations rather than counts.
For a household, the practical consequence is that no statistic tells you whether you are fuel poor. The definitions are applied to modelled costs and modelled incomes at a national scale. What the statistics do is describe the shape and depth of the problem, and give campaigners, regulators and governments a common basis for argument.
The two definitions: the 10 per cent measure and the Low Income Low Energy Efficiency measure
The 10 per cent measure is the older and simpler test. A household is considered to be in fuel poverty if it needs to spend more than 10 per cent of its income to achieve an adequate level of warmth10. It is intuitive, and it is still in use in Wales, where the Welsh fuel poverty measure is 10 per cent of income on fuel bills6, and in Northern Ireland, where the 10 per cent indicator applies where the fuel costs required to maintain a satisfactory heating regime are greater than 10 per cent of household income4.
England moved away from it. The Low Income Low Energy Efficiency method replaced the earlier Low Income High Costs definition, under which a household was fuel poor if it had required fuel costs above the national median and, were it to spend that amount, would be left with a residual income below the official poverty line11. LILEE tightened the energy efficiency condition, tying eligibility to the FPEER band D threshold4.
The gap between the two approaches is large. The government has estimated that 9.0 million households in England could be classed as fuel poor in 2024 using a version of the 10 per cent definition, almost double its level in 202112. Under the Low Income Low Energy Efficiency metric, an estimated 13 per cent of households (3.17m) in England were living in fuel poverty in 202313.
Scotland's definition sits between the two in structure. A household is fuel poor if more than 10 per cent (20 per cent for extreme fuel poverty) of net income is required to pay for reasonable fuel needs after housing costs have been deducted, and the remaining household income is not enough to maintain an acceptable standard of living5. That second condition, an acceptable standard of living, is what distinguishes it from a bare 10 per cent test.
"more than 10% (20% for extreme fuel poverty) of net income is required to pay for their reasonable fuel needs after housing costs have been deducted and the remaining household income is not enough to maintain an acceptable standard of living"
The choice of definition is not technical housekeeping. It determines whether the headline is 2.7 million or 9.0 million, and it determines which households appear in the count at all.
The surveys behind the numbers: the English Housing Survey and the Scottish Household Survey
Every headline figure rests on a survey. In England, the fuel poverty figures are modelled estimates based on data from the English Housing Survey3. The English Housing Survey is a national survey of people's housing circumstances and the condition and energy efficiency of housing in England, a repeated cross-sectional survey that pairs a household interview with a physical inspection of the home, and one of the longest standing government surveys, first run in 196714.
That physical inspection is what makes the English figures possible. Energy efficiency cannot be modelled from an interview alone; someone has to record the fabric, the heating system and the insulation. The pairing of interview and inspection is why the English Housing Survey carries Accredited Official statistic status, previously known as a National statistic14.
Scotland's survey architecture is different. The Scottish Household Survey provides robust evidence on the characteristics, attitudes and behaviour of private households and individuals, as well as on the physical condition of Scotland's homes15. Every year, a random sample of addresses in Scotland is invited to take part, to make sure the results are representative of everyone in Scotland, not just certain groups of people15. Topics covered include housing, neighbourhoods, finances, internet, physical activity, local services, environment, volunteering, culture and childcare15. Annual methodology and fieldwork outcomes reports are published alongside15.
The Scottish House Condition Survey supplies the physical condition data, and its fuel poverty results are broken down by heating fuel in a way the English series is not. In 2022, 28 per cent of households using oil as their primary heating fuel were in fuel poverty, similar to households using other fuel types at 41 per cent16. Overall rates differed between the social sector at 48 per cent and the private sector at 26 per cent16. In 2023, 26 per cent of households using oil were in fuel poverty, 52 per cent of households using electricity, and 49 per cent using other fuel types17.
The 2022 Scottish figures were the first set of accredited official statistics meeting the full definition of fuel poverty under the 2019 Act and 2020 Regulations18. The 2021 estimates carried a caveat: it is likely that fuel poverty rates are being underestimated due to the over representation of higher income households in the social survey and mode effects driving increases in energy efficiency ratings19. That is a producer stating plainly that its own number is probably too low.
How the annual report is produced and its official status

The Annual fuel poverty statistics report is the core English publication. It carries Accredited official statistics status, applies to England, and presents the latest statistics on the number of households living in fuel poverty in England20. The 2026 edition gives final estimates of fuel poverty in England for 202420.
Accredited Official Statistics is the current label for what was previously called National Statistics. The English Housing Survey is described as an Accredited Official statistic, previously known as a National statistic14. The status signals that the producer's methods have been assessed against a code of practice, not that the figures are exact.
The report is not always right first time. The Annual fuel poverty statistics report: 2026 was republished on 7 August 2026 to correct a calculation error on benefit receipt and the description of the median affordability indicator20. Revisions of this kind are normal in modelled statistics and are the reason the publication carries a version history.
Scotland's reporting runs on a statutory cycle rather than an annual one. The Fuel Poverty Act 2019 set targets and reporting requirements whereby the Scottish Government is required to publish three-year periodic reports on progress8. That produces a different rhythm of publication from England's annual series, and it means Scottish progress against the statutory targets is assessed in multi-year blocks.
The headline figures: 2.7 million households in England and a fuel poverty gap of £407
The English headline is some 2.7 million households in fuel poverty1. The average fuel poverty gap in England stands at £4072. A separate count puts the number affected in England in 2025 at 2.36 million households3.
The gap measures depth, not breadth. It is the amount by which a fuel poor household's required fuel costs exceed the national median, so a rising gap means the fuel poor are falling further behind rather than that more households are joining them. The gap was above average for those using electricity for heat, at £73012.
Scotland has a statutory target for the gap as well as the rate. The Fuel Poverty (Targets, Definition and Strategy) (Scotland) Act 2019 sets a target that the median fuel poverty gap of households in Scotland in fuel poverty would be no more than £250 at 2015 prices by 2040, adjusted for changes in the value of money19.
The historical series shows how much the definition matters. In 2009, there were 4 million households in England living in fuel poverty10. In 2013, 10.4 per cent of all households in England (2.35 million households) were fuel poor using the LIHC definition21. In 2016, an estimated 2.55 million households in England were defined as fuel poor22. The fall from 4 million to 2.35 million is not a fall in hardship; it is a change of test.
| Measure | Figure | Year | Source |
|---|---|---|---|
| England, fuel poor households | some 2.7 million | 2025 | 1 |
| England, average fuel poverty gap | £407 | 2024 | 2 |
| England, gap for electricity heating | £730 | 2025 | 12 |
| England, households affected | 2.36 million | 2025 | 3 |
| England, 2022 figure | 3.18 million households | 2022 | 5 |
| UK, estimate range | 4.1 million to 7.5 million households | 2024 | 23 |
Sub-regional and local authority breakdowns: where the finer-grained numbers come from
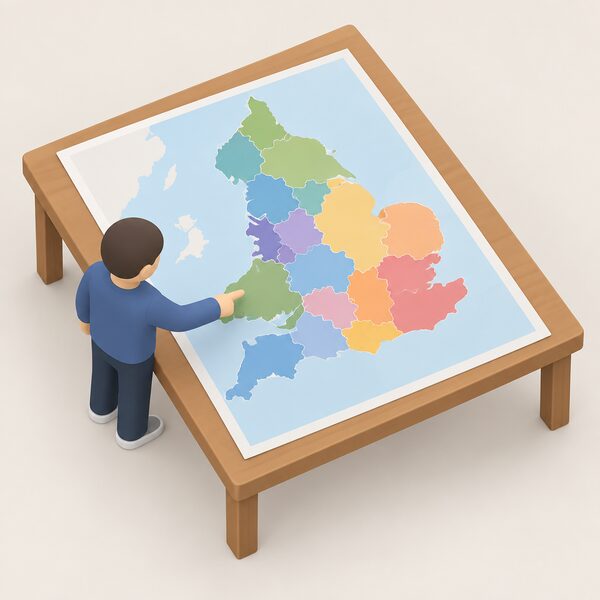
National figures are modelled down to smaller geographies, and the resulting estimates carry a weaker statistical status. Estimates at the sub-regional level are official statistics in development and are modelled and constrained to regional totals3. That constraint matters: the local numbers are fitted to the regional and national totals, so they cannot sum to something different from the headline.
The sub-regional series for England is published annually. The Sub-regional fuel poverty report 2026 (2024 data) applies to England and carries official statistics in development status24. The 2025 report, on 2023 data, and the 2024 report, on 2022 data, carry the same status and extent25. The series runs back further: the sub-regional fuel poverty 2021 report used 2019 data27.
The ONS Explore local statistics service carries a fuel poverty indicator for England, one of 109 local indicators on the service3. Household and fuel poverty numbers at region level come from the national fuel poverty statistics, 2024, and the data source is the Department for Energy Security and Net Zero3. The indicator includes data for 2024 only3.
Scotland publishes local authority tables from the Scottish House Condition Survey. The Local Authority Tables 2022-2024, published on 26 May 2026, show fuel poverty rates ranging from 22 per cent in Stirling to 51 per cent in Orkney Islands against a Scotland average of 31 per cent23. That spread is the point of sub-national data: a national rate of 31 per cent conceals a range of nearly thirty percentage points.
Wales shows a similar pattern by dwelling age and settlement type. Households living in older properties were more likely to be fuel poor, with 33 per cent of households living in pre-1919 dwellings, compared with 24 per cent of households living in urban areas4.
For a household looking up its own area, the practical guidance is to check the status label. A figure marked official statistics in development is a modelled estimate constrained to a regional total, not a count of named households.
Why UK-wide totals differ: England, Scotland, Wales and Northern Ireland are counted separately
There is no UK fuel poverty statistic, and the reason is devolution. Fuel poverty is a devolved policy area, and is defined and measured differently in different parts of the UK22. The ONS article on measurement was the first to use published data to explore the differences and similarities in how the UK measures deal with the main influences of fuel poverty7.
The four measures in outline:
- England: Low Income Low Energy Efficiency, requiring a FPEER of band D or below and residual income below the official poverty line after modelled energy costs4.
- Scotland: more than 10 per cent of net income (20 per cent for extreme fuel poverty) required for reasonable fuel needs after housing costs, with remaining income insufficient for an acceptable standard of living5.
- Wales: the Welsh fuel poverty measure, 10 per cent of income on fuel bills6.
- Northern Ireland: the 10 per cent indicator, where fuel costs required to maintain a satisfactory heating regime exceed 10 per cent of household income4.
The rates that come out of these measures are not directly comparable22. A household counted in Wales under the 10 per cent measure might not be counted in England under LILEE, because LILEE adds an energy efficiency condition and a residual income test.
The fuel mix also differs, and the Scottish data shows why that matters. In 2023, 26 per cent of Scottish households using oil were in fuel poverty, 52 per cent of those using electricity, and 49 per cent using other fuel types17. In Wales, 30 per cent of those using other types of fuel were in fuel poverty28. Off-gas-grid households appear disproportionately in every nation's figures, which is a fact about the housing stock and the fuel, not about the measure.
Northern Ireland's position is the most limited. Estimates for Wales and Northern Ireland have not yet been published for 2022 or later years12. Anyone comparing the four nations is therefore comparing measures, years and coverage at once.
Where the numbers lag: survey years, publication dates and revisions
The figures always describe a year already past. The Annual fuel poverty statistics report: 2026 gives final estimates of fuel poverty in England for 202420. The ONS fuel poverty indicator for England includes data for 2024 only, with the underlying Department for Energy Security and Net Zero source data published on 14 May 20263.
The lag has two causes. Surveys take time to run, process and quality assure, and the modelling is then fitted to price and income data for the reference year. The English Housing Survey pairs an interview with a physical inspection, which lengthens fieldwork14. The Scottish Household Survey publishes annual methodology and fieldwork outcomes reports, which is the audit trail for the same process in Scotland15.
Publication dates cluster in spring and early summer. The Sub-regional fuel poverty report 2026 (2024 data) was published on 14 May 202624. The Fuel Poverty in England: sub-regional dataset was updated on the same date27. The Scottish local authority tables followed on 26 May 202623. The Annual fuel poverty statistics report: 2026 was republished on 7 August 2026 after corrections20.
Wales has its own timing. The Welsh Government stated in June 2025 that it anticipated updated fuel poverty estimates would be published early in the autumn18. An earlier Welsh statistical article, Fuel poverty modelled estimates for Wales, was published on 2 November 202218.
Revisions are part of the cycle rather than an exception. The 2026 English report was corrected for a calculation error on benefit receipt and the description of the median affordability indicator20. The 2021 Scottish estimates carried a stated likelihood that rates were being underestimated because of survey composition and mode effects19. A reader comparing a figure quoted in a campaign release with the current published series may be comparing a superseded version.
Who uses the statistics: charities, regulators and campaigns
The statistics exist to be argued with, and the users are visible in the numbers they quote. The End Fuel Poverty Coalition cites 5 million households in deep fuel poverty, spending over 20 per cent of their income on energy29. Smart DCC, which operates the smart meter system, cites unprecedented levels of financial difficulty with 6 million homes estimated to be in fuel poverty30. Ofgem's own consumer vulnerability work gives the approximately 5.6 million UK figure as of July 20242.
The spread from 5.6 million to 6 million is not a contradiction in the data so much as a difference in who is counting and when. Ofgem's figure is dated July 20242. The 6 million estimate is undated in the same way and comes from a different producer30. The deep fuel poverty figure of 5 million uses a 20 per cent of income threshold, which is a different test again29.
Regulators use the statistics for market monitoring. Ofgem publishes consumer vulnerability material drawing on them2. The Energy Ombudsman directs consumers worried about bills to advice services31. Local authorities use the sub-regional figures to target support: Birmingham City Council's energy bill help pages sit downstream of the same data32.
For a household, the statistics are a map rather than a route. They show how many households are in difficulty, how deep that difficulty runs, and which areas and fuel types are worst affected. They do not determine eligibility for anything. The practical routes are the advice services: Citizens Advice on 0808 223 1133 in England and Wales, Monday to Friday, 9am to 5pm, with a Welsh language line on 0808 223 114433, and National Energy Action on 0800 304 7159 across England, Wales and Northern Ireland, offering free advice about energy bills, keeping warm and safe at home, benefits advice and income maximisation34. National Energy Action can also arrange a British Sign Language interpreter on request32.
Sources34 cited
- Fuel poverty in England: 2.7 million households and the £407 gapRegulations2025), UK Parliament Hansard, 3 September 2025
- Consumer vulnerability strategy: fuel poverty in the UK, Ofgem, April 2025
- Fuel poverty (England) indicator, Office for National Statistics, 20 September 2026
- Fuel poverty modelled estimates for Wales, October 2024, Welsh Government, October 2024
- Home energy efficiency and the Scottish fuel poverty definition, Argyll and Bute Council, 17 September 2026
- Wales fuel support scheme: integrated impact assessment, Welsh Government, 18 July 2023
- How fuel poverty is measured in the UK, Office for National Statistics, March 2023
- Tackling fuel poverty in Scotland: periodic report engagement responses, Scottish Government, 22 April 2025
- Fuel Poverty Indicator (FPI), data.gov.uk, 3 February 2014
- Fuel poverty: the 10 per cent definition, Energy and Climate Change Committee, December 2011
- The Low Income High Costs definition of fuel poverty, House of Commons Library, 2015
- Fuel poverty in England and Wales: statistics and definitions, House of Commons Library, April 2025
- Fuel poverty in England: 13 per cent of households under LILEE, Environmental Audit Committee, 2023
- English Housing Survey 2024 to 2025: introduction and key findings, Ministry of Housing, Communities and Local Government, 29 January 2026
- Scottish Household Survey, Scottish Government, 17 September 2026
- Scottish House Condition Survey 2022: fuel poverty, Scottish Government, 2022
- Scottish House Condition Survey 2023: key findings summary, Scottish Government, 2023
- Tackling fuel poverty: priority actions, Welsh Government, 23 June 2025
- Scottish House Condition Survey 2021: fuel poverty, Scottish Government, 2021
- Annual fuel poverty statistics report: 2026, Department for Energy Security and Net Zero, 26 March 2026
- Fuel poverty in England: the LIHC definition in 2013, House of Commons Library, 2013
- Fuel poverty in England: 2.55 million households in 2016, House of Commons Library, 2018
- Scottish House Condition Survey: percentage of homes in fuel poverty, Scottish Government, 2024
- Sub-regional fuel poverty report 2026 (2024 data), Department for Energy Security and Net Zero, 14 May 2026
- Sub-regional fuel poverty report 2025 (2023 data), Department for Energy Security and Net Zero, 30 April 2025
- Sub-regional fuel poverty report 2024 (2022 data), Department for Energy Security and Net Zero, 25 April 2024
- Fuel Poverty in England: sub-regional, data.gov.uk, 14 May 2026
- Fuel poverty statistics: the fuel poverty gap, House of Commons Library, 2025
- Deep fuel poverty: 5 million households spending over 20 per cent of income on energy, End Fuel Poverty Coalition, 3 April 2026
- Maximising the use of the smart meter system to tackle fuel poverty, Smart DCC, 2024
- Worried about your energy bills, Energy Ombudsman, 2026
- Getting help with your energy bills, Birmingham City Council, 24 June 2026
- Consumer protection rights and advice, GOV.UK, 17 September 2026
- Getting help if you can't afford your energy bills, Ofgem, 17 September 2026
 Fuel Poverty in the UKWho counts as living in fuel poverty, and why does the number change depending on where in the UK you live?
 Fuel Poverty PolicyWhy does fuel poverty mean something different depending on where in the UK you live?
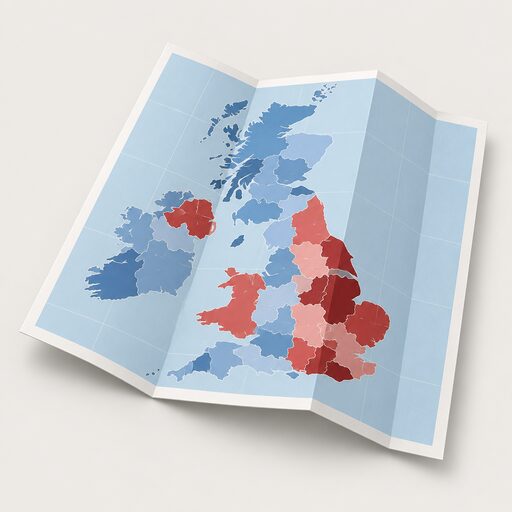 Local Fuel Poverty StatisticsHow many households in your area struggle to afford their heating?
 Fuel PovertyWhy does Northern Ireland have such a high rate of fuel poverty, and how many households are affected?
 The Full Statistics GuideHow many homes in the UK have solar panels, heat pumps or batteries?
 How to Read Energy StatisticsWhy do energy figures change after they are first published, and how much can you trust them?