
In this guide
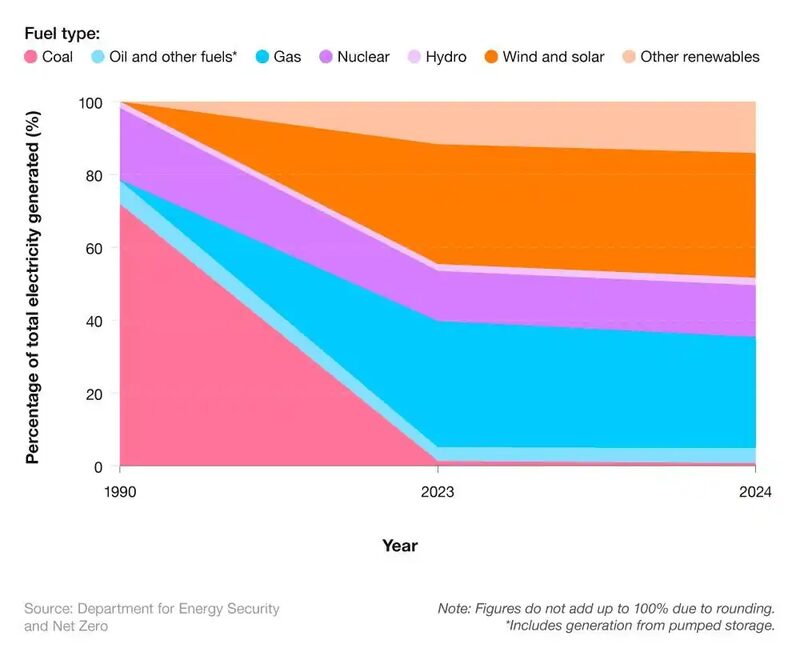
Renewable generation in the UK is reported nation by nation, and the figures do not sit on a single scale. Official statistics put renewables at 51% of UK electricity generation in 20241, while a fuel mix covering April 2024 to March 2025 records 42.1% of electricity added to the National Grid as renewable, with natural gas at 33.3%, nuclear at 16.2%, coal at 5.9% and other sources at 2.5%2. A separate series gives 46.51% of UK electricity generation in 2023 from hydro, wind, solar and other renewables3.
The gap is not a contradiction. Capacity is installed plant, generation is electricity produced, and share of consumption compares output with what a nation uses. Releases also differ in scope: some cover Major Power Producers only, others the whole grid, and the periods differ. Renewables provided a record 53.7% of electricity generation by Major Power Producers in the period from September to November 20254.
For a household, the nation-level figures describe the system it draws from, not its own independence. The grid connection, the supplier and the balancing system remain whatever the fuel mix does. What follows sets out the reported figures for each nation, what drives them, the rules behind them, and what they do and do not mean for a home trying to reduce its dependence on imported fuel.
What the figures measure, and why they differ
Three numbers are routinely quoted for the same subject and they are not interchangeable. Capacity is the installed rating of plant. Generation is the electricity actually produced over a period. Share of consumption compares generation with demand, which is why a nation can generate the equivalent of more than half its consumption while renewables account for a much smaller share of the electricity physically generated on its soil.
The UK-level series illustrate the spread. Energy Saving Trust records that in 2023, 47% of UK energy came from renewable sources8, a figure covering all energy rather than electricity alone. The same organisation's statistics put the renewable share of UK electricity generation in 2023 at 46.51%, including hydro, wind, solar and other renewables3. The Commons Library records 51% of electricity generation from renewables in 20241. A fuel mix for April 2024 to March 2025 gives 42.1% of electricity added to the National Grid2.
The differences come from scope and period. The 53.7% figure for September to November 2025 covers Major Power Producers only, a subset of the market, and is described as a record for that measure4. The 42.1% figure covers electricity added to the grid over a rolling year. The 51% figure covers generation in a calendar year. None of these is wrong; each answers a slightly different question.
"Renewables provided a record 53.7% of electricity generation by Major Power Producers"
The main official series is Energy Trends, published by the Department for Energy Security and Net Zero. It covers renewables electricity generation, renewable electricity capacity, renewable electricity load factors, feed-in tariff capacity and liquid biofuels consumption, and holds accredited official statistics status9. The section on UK renewables was last updated on 10 September 2026, when the Renewables Obligation Certificate tables were updated9. Energy consumption in the UK 2025 also carries accredited official statistics status10.
Wales: capacity, generation and local ownership
Wales publishes its own energy generation report, separate from the UK series, and the Welsh figures are the most detailed nation-level breakdown available. At the end of 2023 there was a total of 3,663 MW of renewable electricity capacity in Wales, alongside 869 MW of renewable heat capacity5. During 2023, 109 MW of new renewable electricity capacity was installed5, and 176 MW of renewable energy capacity was installed in total, comprising electrical and heat capacity5.
The 2021 report gives the composition. Wales generated the equivalent of approximately 55% of its electricity consumption from renewable sources, while an estimated 28% of total electricity generation in Wales came from renewable sources6. There was 3,508 MW of renewable electricity capacity at the end of 2021, with 116 MW installed during that year6. Wind, onshore and offshore, accounted for 70% of all renewable electricity generation in Wales, and 97% of renewable electricity capacity installed in 2021 was solar PV6.
Local ownership is a distinct Welsh policy measure. There was 897 MW of locally owned renewable capacity in 2021, representing an estimated 1.9 GWh of generation that year6. Domestic projects accounted for 70,575 of the 78,373 locally owned projects, with 209 MWe of electrical capacity and 142 MWth of heat capacity6. By 2023, locally owned renewable electrical capacity stood at 688 MW across an estimated 89,632 projects5, and 0.9 GW of locally owned capacity in total, which the Welsh Government reported as 60% of the way towards its target5.
| Wales measure | Figure | Period | Source |
|---|---|---|---|
| Renewable electricity capacity | 3,663 MW | End of 2023 | 5 |
| Renewable heat capacity | 869 MW | 2023 | 5 |
| New renewable electricity capacity | 109 MW | 2023 | 5 |
| Renewable electricity, share of consumption | Approximately 55% | 2021 | 6 |
| Renewable electricity, share of total generation | 28% | 2021 | 6 |
| Wind share of renewable generation | 70% | 2021 | 6 |
| Locally owned renewable electrical capacity | 688 MW | 2023 | 5 |
Wales has also recorded the highest uptake of renewables per household in the UK, placing it at the top of the home nations for renewables uptake11. That is a deployment measure, not a generation one, and it sits alongside the capacity and output figures rather than replacing them.
Scotland and the rest of the UK
Scotland's position has historically been reported separately because its renewable share of generation has run well above the UK average. Official statistics from 2019 put Scotland's renewable share of electricity generation far ahead of the UK as a whole, which stood at 29.3%, or 25.6% for the rest of the UK excluding Scotland12. The Committee on Climate Change recorded in 2013 that Scotland's renewable electricity share was above the UK figure of 9% at that time13.
The direction of travel across the UK is visible in older releases. In 2011, just under 10 per cent of the UK's electricity came from renewable sources14. By 2012 the fuel mix recorded 11.3% from renewables, including wind, hydro and bioenergy15. In 2018, a third of the UK's electricity came from renewables as overall power generation fell to its lowest levels since records began16. The 2010 position, recorded in Northern Ireland building control guidance, was that only 4% of the electricity produced came from renewable sources17.
These older figures matter for one reason: they show how quickly the nation-level shares have moved, and they explain why any single number quoted without a date is unreliable. A household reading that renewables are "about 40%" of the grid is reading a figure that was accurate for a particular period and scope. The Development Bank of Wales estimated about 42% of the UK power grid came from renewable sources, with wind the biggest contributor18.
Northern Ireland's position is less fully covered in the nation-level generation releases. The available official guidance deals with hydropower as a technology rather than with a Northern Ireland renewable share, noting that hydropower from dams, sluices and mill wheels was used for many years to generate electricity in a local area before this method of generation generally disappeared with the introduction of the electricity grid19. The viability of any installation depends on whether there is enough water flowing per second and the height or head it falls from, and there should also be enough residual flow to maintain the water course19. Various consents and licences are required for a hydro project19.
What drives the figures
Three forces move the nation-level numbers: the build rate of new capacity, the weather in the period measured, and the demand the output is compared against.
Build rate is the slowest and most visible. Wales installed 116 MW of renewable electrical capacity and 29 MW of renewable heat capacity in 20216, then 109 MW of new renewable electricity capacity in 20235. The Welsh Government reported 4.3GW of renewable energy capacity installed in Wales in 2024, with 0.99 GW of local ownership at the end of that year20. Renewable electricity generation in Wales increased by only 9% over the five years to 2022, compared with 140% in the preceding period, which the report attributes to the pace of build rather than to resource6.
Weather drives the short-term figures. The record 53.7% from Major Power Producers covers September to November 2025, a period when wind output is typically strong4. A share measured over a windy quarter will exceed one measured over a calendar year, which is why the rolling and annual figures diverge.
Demand is the denominator, and it has fallen. The 2018 release noted that a third of the UK's electricity came from renewables as overall power generation fell to its lowest levels since records began16. A falling denominator raises every share calculated against it, without any new plant being built.
Technology mix shapes the rest. Hydropower is renewable because it uses the natural water cycle, and produces very low greenhouse gas emissions once the system is running because it does not burn fossil fuels during operation21. Globally it generates over 50% of renewable energy, but in Great Britain it made up just 2% of electricity generation in 202421. There may be fewer opportunities for new large-scale hydropower projects, but smaller schemes and community projects could provide local renewable electricity, energy storage and grid flexibility21.
The rules and targets behind the numbers

The framework that produced these figures has changed over time, and the targets now in force are set at nation level rather than UK level.
The UK's earlier target was to cover 15 per cent of the UK's energy demand from renewable sources by 202015, a goal repeated in later official material seeking to ensure 15% of all energy came from renewables by 202022. Ofgem's consultation on the period set out that renewable generation, principally wind, would need to meet around 30% of electricity demand to hit that target23. That target has passed and the current UK-wide position is reported through the Energy Trends series rather than against a single headline goal9.
Wales has set its own, more specific targets. The Welsh Government aims to meet the equivalent of 100% of annual electricity consumption from renewable electricity by 2035, with at least 1.5GW of renewable energy capacity locally owned by 2035, excluding heat pumps8. The same 1.5 GW local ownership target appears in the consultation summary24, and the 100% by 2035 electricity target is repeated in a 2026 written statement20. A separate Welsh statement sets the ambition to at least meet electricity needs from renewable energy sources25.
The trade body landscape is part of the picture. The Renewable Energy Association is the UK's largest trade association for renewable energy and clean technologies, with around 550 members26. It has publicly raised concern over a lack of support for the renewable energy industry in an Autumn Budget26.
For households, the rules that bite are at installation level rather than generation level. Northern Ireland guidance states that a property should be properly insulated before installing renewable technologies19. Hydropower installations require various consents and licences19. These are the conditions a household meets directly; the national targets are not.
What this means for household energy independence
The nation-level generation figures describe a system, and a household's relationship with that system is unchanged by them. A home drawing power from the grid takes whatever mix the grid is running at that moment, and pays a supplier for it. A rising renewable share reduces the carbon intensity of that supply and reduces the UK's exposure to imported gas, but it does not remove the grid connection, the supplier, or the balancing role that keeps the lights on when the wind drops.
The scale of the remaining dependence is visible in the official figures. UK fossil fuel dependency stood at 76.6% of energy consumption in 2023, a fall of 1.6 percentage points on 20227. That is the whole energy system, including transport and heat, not electricity alone, and it is the number that describes how far the UK still relies on fuels it largely imports.
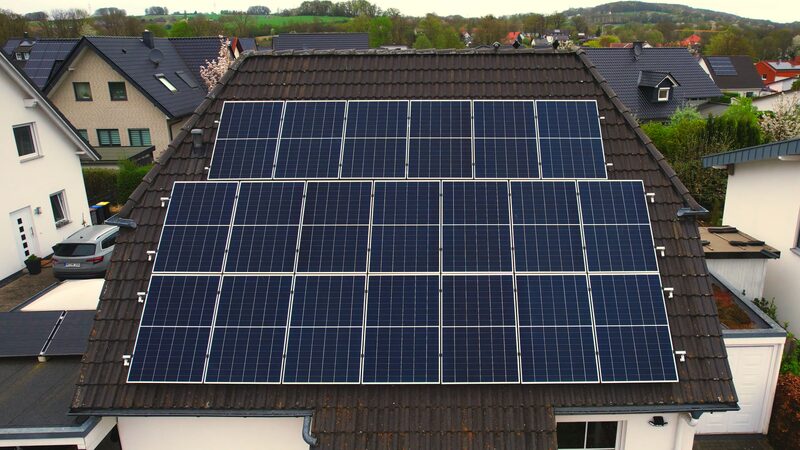
For a household, the practical route to independence runs through its own generation and storage rather than through the national mix. Energy Saving Trust notes that a household could produce more than enough electricity for lighting and household appliances through hydropower27, and that insulation should come before renewable technologies19. The limits are real: a home with its own generation still imports from the grid when output is low, still depends on a supplier for billing and export payments, and still depends on a manufacturer for the equipment and any app that monitors it.
The Welsh figures show what local ownership adds. Of 78,373 locally owned renewable projects recorded in 2021, 70,575 were domestic, with 209 MWe of electrical capacity and 142 MWth of heat capacity6. That is generation and heat sited at or near the point of use, which is the closest the statistics come to describing household-level independence. It remains a small fraction of the 3,508 MW of total renewable electricity capacity recorded in Wales that year6.
Sources27 cited
- Renewable energy statistics research briefing, House of Commons Library, 2025
- Are electric heaters eco friendly, Which?, 2024
- Energy statistics, Uswitch, 17 December 2025
- Energy Trends and Prices statistical release, Department for Energy Security and Net Zero, 29 January 2026
- Energy generation in Wales 2023, Welsh Government, 2025
- Energy generation in Wales 2021, Welsh Government, 22 December 2022
- DESNZ annual report and accounts 2025 to 2026, Department for Energy Security and Net Zero, 2026
- Renewable energy deep dive: biannual recommendations update, Welsh Government
- Energy Trends: UK renewables, Department for Energy Security and Net Zero, 10 September 2026
- Energy consumption in the UK 2025, Department for Energy Security and Net Zero, 25 September 2025
- More than 100,000 Welsh home and business owners turn to renewable energy, MCS, 1 November 2023
- Annual energy statement 2019, Scottish Government, 15 May 2019
- Scotland makes good progress in implementing its climate change strategy, Committee on Climate Change, 12 March 2013
- The Telegraph's confusing laundry, Carbon Brief, 14 February 2013
- The challenge of shifting peak electricity demand, Nesta, 2012
- Proposals to protect consumers and guarantee payments for households with solar, Department for Energy Security and Net Zero, 2018
- Energy conservation, Building Control Northern Ireland, August 2010
- Home energy efficiency key terms explained, Development Bank of Wales, 17 October 2024
- Hydropower, nidirect, 17 September 2026
- Energy generation and energy use in Wales: first combined edition, Welsh Government, 18 March 2026
- What is hydropower and how does it work, Smart Energy GB, 19 August 2026
- The green gas coming to a pipe near you, Committee on Climate Change, 8 June 2015
- Renewable energy consultation, Ofgem, July 2010
- Summary of responses: consultation on Wales renewable energy targets, Welsh Government
- Spring 2023 biannual update: renewable energy deep dive, Welsh Government, 27 April 2023
- Concern over lack of support for renewable energy industry in Autumn Budget, Renewable Energy Association, 29 October 2018
- Could you generate your own energy, Energy Saving Trust, 12 April 2024
 Community Energy StatisticsHow much of the UK's energy comes from projects owned by local people, and is that number growing?
 UK Electricity Generation MixBreaks down the shares of gas, wind, nuclear, solar, biomass, hydro and imports in UK electricity generation, how those shares move by hour and season, where the published figures come from, and what the mix means for a household's energy independence.
 Data and Energy IndependenceHow many UK homes actually make their own power, and is that number really growing?
 Energy Supply in WalesWales makes more electricity than it uses, but how much of it comes from renewables, and will that reach all of it by 2035?
 Energy Supply in ScotlandScotland makes far more low-carbon electricity than it uses and sends the rest south.
 How to Read Energy StatisticsWhy do energy figures change after they are first published, and how much can you trust them?