

In this comparison
Wales has the highest renewable uptake per household of the four UK nations. In 2024, renewable generation in Wales equalled 54% of the country's electricity consumption, and in 2023 the equivalent figure was 53% including losses1. The Welsh Government's target is to meet the equivalent of 100% of Wales's annual electricity consumption from renewable sources by 2035, and to keep pace with consumption thereafter3.
That is a generation-to-consumption measure, not a count of homes with panels on the roof. On the Domestic Renewable Heat Incentive, the scheme that paid households for renewable heat between 2014 and its closure, household penetration was highest in Scotland at 0.8%, then Wales at 0.6% and England at 0.4%5. So the answer depends on which uptake measure is used: Wales leads on renewable generation against consumption, Scotland leads on renewable heat scheme penetration per household.
Across the UK as a whole, only around 2.5% of households use renewable technology to generate their own electricity6. The UK grid itself is estimated at about 42% renewable7, and 51% of UK electricity generation in 2024 came from renewable sources such as solar and wind8.
How the four UK nations compare
The comparison depends on the metric. On renewable generation as a share of electricity consumption, Wales is the clear leader among the devolved nations for which figures are published in this series. Wales generated renewable electricity equivalent to 54% of its consumption in 20241, 53% in 2023 including losses2, and 59% of total electricity consumption in 202211. Within Wales, Denbighshire recorded the highest equivalent percentage at 110% in 202112.
On the Domestic Renewable Heat Incentive, the picture inverts. Scotland had the highest household penetration at 0.8%, Wales 0.6% and England 0.4%5. But the raw installation count was heavily concentrated in England, which took 75.1% of installations, against 18.0% in Scotland and 6.9% in Wales5. England's larger housing stock means a smaller share of households but a much larger absolute number of accredited installations.
For the UK as a whole, 51% of electricity generation in 2024 came from renewable sources8. The UK grid is estimated at about 42% renewable, with wind the biggest contributor7. Older figures show how quickly this has moved: in 2010, only 4% of UK electricity came from renewable sources14, and in 2013 the UK figure was 9%15.
Northern Ireland does not appear in the Domestic Renewable Heat Incentive statistics, which covered England, Scotland and Wales13. Northern Ireland's building regulations set energy conservation requirements separately16, and its renewable installation data sits outside the GB scheme series.
| Measure | Wales | Scotland | England | UK |
|---|---|---|---|---|
| Renewable generation vs electricity consumption | 54% (2024)1 | Not given in this series | Not given in this series | 51% of generation (2024)8 |
| DRHI household penetration | 0.6%5 | 0.8%5 | 0.4%5 | Not stated |
| DRHI share of installations | 6.9%5 | 18.0%5 | 75.1%5 | 100% |
| GSHP share of DRHI accreditations | 19.1%5 | 15.9%5 | 13.7%5 | Not stated |
| Solar thermal share of DRHI accreditations | 11.4%5 | 6.4%5 | 8.4%5 | Not stated |
What counts as renewable uptake in these figures
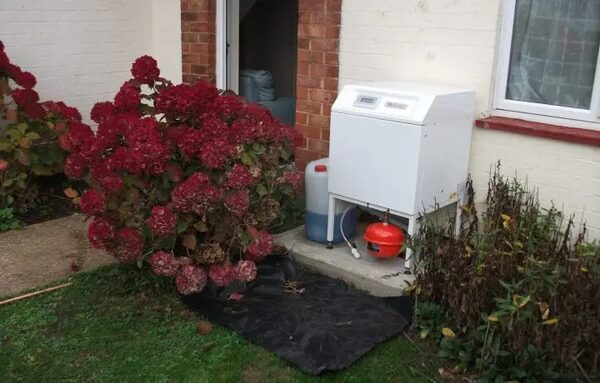
Renewable uptake is measured in at least three different ways in the official statistics, and they do not move together.
The first is generation against consumption. Wales's renewable electricity generation was equivalent to 53% of its electricity consumption including losses in 20232, and 54% in 20241. This measures how much renewable electricity is generated within the nation's borders relative to how much electricity the nation uses. It says nothing about how many homes have installed anything.
The second is scheme penetration. The Domestic Renewable Heat Incentive opened in April 2014 across England, Scotland and Wales13, and its household penetration reached 0.8% in Scotland, 0.6% in Wales and 0.4% in England5. This measures the share of households that received accreditation for a renewable heat installation.
The third is technology mix within a scheme. Wales had the highest proportion of ground source heat pumps at 19.1% and solar thermal at 11.4% of accreditations, against England's 13.7% and 8.4% and Scotland's 15.9% and 6.4%5. England had the highest proportion of air source heat pumps at 69.0%, against Scotland's 66.3% and Wales's 53.6%5.
"Wales has the highest proportion of GSHPs (19.1%) and Solar Thermal (11.4%)"
The distinction matters for a household trying to read the numbers. A high generation-to-consumption ratio reflects large-scale wind and solar deployment as much as domestic installations. A high scheme penetration rate reflects how many homes took up a subsidy. Neither directly measures how much renewable energy a typical household generates or uses.
Why Wales leads: housing, climate and policy context
Wales's position on generation against consumption reflects a combination of a relatively small electricity demand and a growing renewable generation base. Wales consumed 14.8 TWh of electricity in 20232. In 2024, 4.3 GW of renewable energy capacity was installed in Wales1. The Welsh Government raised its local ownership target for renewable energy to 1.5 GW by 2035, alongside the 100% consumption target1.
Housing is a significant part of the Welsh policy picture. Housing produces 21% of Welsh carbon emissions17, and accounts for 9% of all greenhouse gas emissions18. Almost a quarter of Welsh households experience fuel poverty, despite numerous energy efficiency initiatives17. The Welsh Government has funded a £150 million programme for insulation, clean energy and carbon reduction in social homes18.
On renewable heat specifically, Mid Wales accounts for the greatest proportion of renewable heat capacity in Wales at 32%, followed closely by North Wales at 31%, with the Cardiff Capital and Swansea Bay City regions at 18% each12. Over 80% of new electrical and heat capacity in Wales in 2021 was focused in the domestic sector, largely due to the installation of solar PV and heat pumps12.
The policy framework has also moved. Changes to Part L, F and O of the Welsh building regulations were intended as the basis for introducing a performance standard incorporating low-carbon heat in new homes by 202519. The Climate Change Committee's Balanced Pathway for Wales sets out 78% of electricity generation from variable renewables by 203320. Emissions reductions in Wales deliver around 7% of the overall abatement required to meet the UK's recommended Seventh Carbon Budget and Net Zero target20.
What the fuel poverty data adds to the picture
Fuel poverty is the pressure that sits behind household renewable uptake, and Wales has high rates. The Welsh Government's modelled estimates for October 2024 put fuel poverty at 14% of households9. Welsh Government guidance published in February 2024 states that almost a quarter of Welsh households experience fuel poverty17.
The breakdown by heating type is stark. Among Welsh households using electricity for heating, 53% were in fuel poverty, compared with 23% of those with central heating21. Households in the private rented sector were more likely to be fuel poor, at 30%22. Single-person households accounted for 55% of all fuel-poor households22. Rural households had a 26% fuel poverty rate against 24% in urban areas22.
Dwelling type matters less than expected. Fuel poverty ranged from 23% of those in detached homes to 28% of those in end of terrace homes22. Whether cavity walls were insulated made no significant difference: 21% for insulated against 22% for uninsulated22.
For England, the fuel poverty rate was 14% in Wales by comparison, and the aggregate fuel poverty gap increased by an estimated 47% between 2020 and 2023 before falling by 7% in 20249. The gap was above average for households using electricity for heat, at £73021. Around 238,000 more households in England fell into fuel poverty after energy price increases, even after government support23.
High fuel poverty creates a dual effect on renewable uptake. It increases the incentive to cut bills through generation or efficiency, but it also limits the capital available for installations. The Welsh Government's own guidance acknowledges that energy efficiency initiatives have not prevented almost a quarter of households experiencing fuel poverty17.
How uptake is measured and where the numbers come from

The underlying statistics come from several official sources, and knowing which one a figure comes from matters for interpreting it.
Energy Trends: UK renewables carries accredited official statistics on capacity, electricity generation and liquid biofuels consumption for the UK renewables sector24. This is the national series for generation data.
The Welsh Government publishes Energy Generation in Wales and Energy Use in Wales as separate reports. The 2023 generation report gives the 53% consumption-equivalent figure2, and the 2021 report gives the Denbighshire 110% figure and the regional renewable heat capacity breakdown12. The Energy Use in Wales report gives domestic consumption changes and the 6.7 TWh domestic energy use figure for 201925.
Fuel poverty statistics for England come from the Department for Energy Security and Net Zero, published as the Annual fuel poverty statistics report26. The ONS local statistics indicator names the same department as its data source27. Sub-regional fuel poverty data for England is published as Official Statistics28.
For Wales, the modelled estimates for October 2024 were published by the Welsh Government, with headline figures released ahead of detailed analysis22. The Domestic Renewable Heat Incentive statistics come from Ofgem's annual reports on the scheme5.
The measurement question is not academic. A household reading that Wales has 54% renewable generation against consumption might reasonably assume that Welsh homes are more likely to have renewable technology installed. The scheme penetration figures show a different pattern, with Scotland ahead on household uptake of renewable heat. Both figures are correct; they measure different things.
What rising openness to heat pumps means for the nations
Heat pump deployment is the area where the nations' positions are shifting fastest, and the UK-wide picture is one of growth from a low base.
The UK was the only country to experience growth in heat pump sales in 2024, with a 38,000 unit increase from 202310. Government-supported heat pump installations rose 30% in the 12 months to June 2025 compared with the preceding 12 months30, and 41% in the 12 months to March 202531. In the year ending June 2025 there were 46,423 government-supported installations, against 35,702 in the year ending June 202430.
Wales took 14% of government-supported heat pump installations in the year ending March 2025, behind the leading region and level with the South West31. The majority of government-supported installations in the year ending September 2024 were funded by ECO, at 46%32, and installations rose 46% year on year in that period32.
The technology mix within the Domestic Renewable Heat Incentive shows where each nation's strengths sit. Wales had the highest proportion of ground source heat pumps at 19.1% and solar thermal at 11.4%5. England had the highest proportion of air source heat pumps at 69.0%5. Scotland's share of air source heat pumps was 66.3%5.
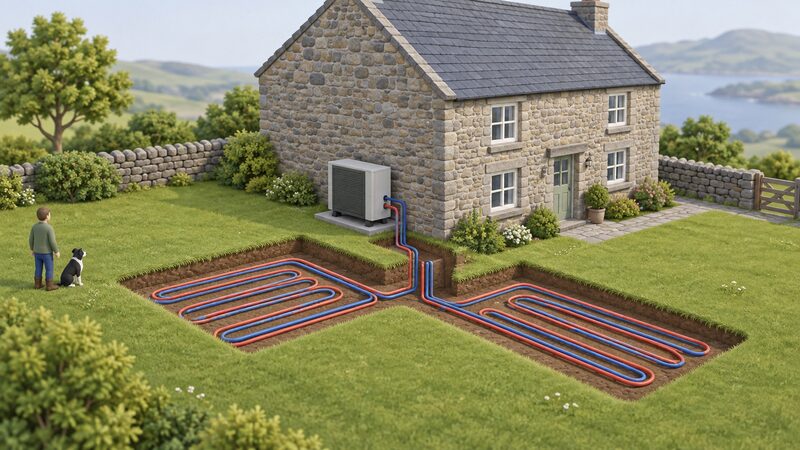
For a household, the practical position is that renewable uptake figures describe where installations have happened, not what is available or suitable. The Welsh Government's target of 100% of annual electricity consumption from renewables by 2035 is a national generation target3, and the 1.5 GW local ownership target sits alongside it1. Neither guarantees a particular outcome for an individual home, and the fuel poverty figures show that high national renewable generation has not eliminated high household energy costs.
Sources32 cited
- Energy generation and energy use in Wales: first combined edition report, Welsh Government, 2024
- Energy Generation in Wales 2023, Welsh Government, 2025
- UK Solar Roadmap, Department for Energy Security and Net Zero
- Summary of responses: consultation on Wales renewable energy targets, Welsh Government
- Domestic RHI Annual Report Scheme Year 11, Ofgem, 2025
- Renewable energy, Electricity North West
- Home energy efficiency key terms explained, Development Bank of Wales, 2024
- Solar PV deployment statistics, House of Commons Library, 2025
- Fuel poverty statistics, House of Commons Library, 2025
- EINAS 2025: heat and buildings, Department for Energy Security and Net Zero, 2025
- Energy Use in Wales report: third edition, Welsh Government
- Energy Generation in Wales 2021, Welsh Government, 2022
- Domestic RHI Annual Report 2023-24, Ofgem, 2024
- Energy conservation, Building Control Northern Ireland
- Scotland makes good progress in implementing its climate change strategy, Climate Change Committee, 2013
- Solar PV deployment, December 2014, Department of Energy and Climate Change, 2015
- Homes of today for tomorrow: decarbonising Welsh housing between 2020 and 2050, Welsh Government, 2024
- £150 million for insulation, clean energy and carbon reduction in social homes, Welsh Government
- Part L Wales impact assessment: domestic existing and new build, Welsh Government, 2022
- Wales fourth carbon budget, Climate Change Committee, 2025
- Fuel poverty statistics research briefing, House of Commons Library
- Fuel poverty modelled estimates for Wales, October 2024, Welsh Government, 2024
- Energy bills support: an update, National Audit Office, 2024
- Energy Trends: UK renewables, Department for Energy Security and Net Zero
- Energy Use in Wales report, Welsh Government, 2022
- Annual fuel poverty statistics report: 2026, Department for Energy Security and Net Zero, 2026
- Fuel poverty indicator, Office for National Statistics, 2026
- Fuel Poverty in England: sub-regional, data.gov.uk, 2026
- Sub-regional fuel poverty report 2025, Department for Energy Security and Net Zero, 2025
- Heat pump deployment quarterly statistics, UK 2025 Q2, Department for Energy Security and Net Zero, 2025
- Heat pump deployment quarterly statistics, UK 2025 Q1, Department for Energy Security and Net Zero, 2025
- Heat pump deployment quarterly statistics, UK 2024 Q3, Department for Energy Security and Net Zero, 2024
 Wales Renewable Energy TargetsWales aims for renewable sources to meet the equivalent of 70% of its electricity consumption by 2030 and 100% by 2035, with at least 1.5 GW locally owned by 2035.
 Renewable Generation by NationHow much of our electricity comes from renewables, and why do the figures keep changing?
 Energy Supply in WalesWales makes more electricity than it uses, but how much of it comes from renewables, and will that reach all of it by 2035?
 Microgeneration UptakeScotland has more solar panels and heat pumps per household than England, while Wales has built larger solar schemes and Northern Ireland lags behind.
 Community Energy StatisticsHow much of the UK's energy comes from projects owned by local people, and is that number growing?
 Data and Energy IndependenceHow many UK homes actually make their own power, and is that number really growing?