

In this guide
Britain's electricity now comes from two roughly equal halves: a renewable and nuclear half, and a gas half that is shrinking but still sets the balance on any given day. Gas supplies about one third of UK electricity1. Official statistics for the three months from September to November 2025 put gas at 33.3% of generation by Major Power Producers, with fossil fuels as a whole at 33.4%2. A published UK fuel mix for April 2024 to March 2025 gives renewables 42.1%, natural gas 33.3%, nuclear 16.2%, coal 5.9% and other sources 2.5%3.
On a calendar-year basis for 2024, 51% of UK electricity generation came from renewable sources and 14% from nuclear4. Gas was the largest single source of electricity generation until 2024, when wind overtook it5. That ordering matters less than the daily swing: gas supplies around a quarter of generation on a good day and up to 60% depending on the day6.
This page sets out the published shares, why different official and independent figures disagree, what moves the mix hour by hour and season by season, how the picture differs across the four nations, the rules that govern what is reported and what is built, and what the whole thing does, and does not do, for a household's energy independence. For the wider picture of where the fuel itself originates, see UK energy supply.
The headline shares, and why the published numbers differ
There is no single correct percentage, because the published series measure different things. Some count generation by Major Power Producers, the large licensed generators, which excludes a great deal of embedded and small-scale output. Some count all UK generation. Some count electricity demand met, which includes imports over interconnectors. And the reporting periods differ: calendar years, rolling supply years from April to March, and rolling three-month comparisons.
| Measure | Renewables | Gas or fossil | Nuclear | Period |
|---|---|---|---|---|
| UK generation4 | 51% | not stated | 14% | 2024 |
| UK fuel mix added to the grid3 | 42.1% | 33.3% gas, 5.9% coal | 16.2% | Apr 2024 to Mar 2025 |
| Major Power Producers2 | not stated | 33.4% fossil, 33.3% gas | not stated | Sep to Nov 2025 |
| Electricity demand met11 | around 38%, plus 7% biomass | 30% fossil gas | 15% | undated |
The same April 2024 to March 2025 fuel mix is published independently as renewables 42.1% and natural gas 33.3%12, which is the figure a household is most likely to meet, because it is the basis on which suppliers describe the electricity they sell. Elsewhere nuclear is described as contributing around 20% of generation13, and in 2023 nuclear was 14.2% of UK electricity14. These are not errors so much as different denominators and different years; where a figure matters, its period and its measure matter with it.
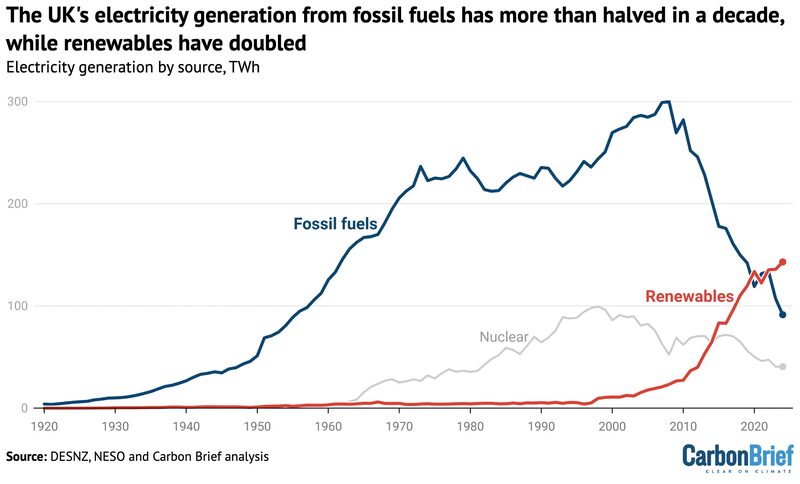
Total generation is falling even as demand for electricity in some sectors rises. The UK produced 294.1 TWh in 2023 and 285 TWh in 20249, and in 2024 generated 10.85% less electricity than in 1990, with over a third of that energy coming from wind and solar9. Renewables generated 57% more electricity than fossil fuels in 202415. Renewable output more than doubled from 65 TWh in 2014 to 143 TWh in 2024, a rise of 122%15.
How far the mix has moved since 2012
The scale of the change is clearest against the old baseline. In 2012 the UK fuel mix was gas 39.3%, nuclear 27.5%, coal 19.4%, renewables 11.3%, oil 1.5% and other 1%16. Zero-carbon sources were less than 20% of Britain's electricity mix in 20103.
Coal has gone from the second largest source to a residual, and the nuclear fleet has shrunk in share as reactors closed: nuclear was 26.9% of generation by Major Power Producers in June 20172, 27% in 201917, and 16.6% in the period to May 20267. Renewables have travelled the opposite way, from 11.3% in 201216 to 23% in 201917 to 51% in 20244. Gas held a steady middle: dominant for electricity generation since 200818, 46% of electricity generated in 201917, 40% as of early 202217, over a quarter in 20255.
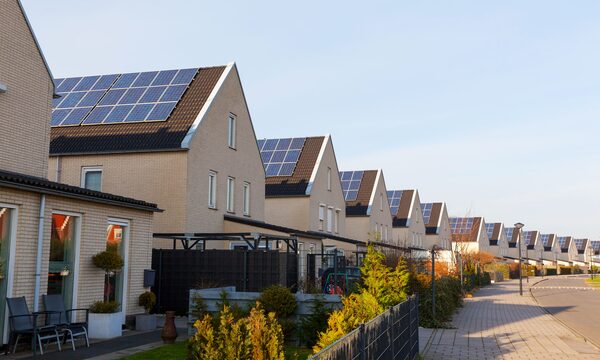
The UK has around 80GW of electricity generating capacity16. The move from a coal and gas fleet to a wind and solar one changes what that capacity means, because a gigawatt of wind and a gigawatt of gas do not produce the same energy in the same hour.
What drives the mix hour by hour and season by season
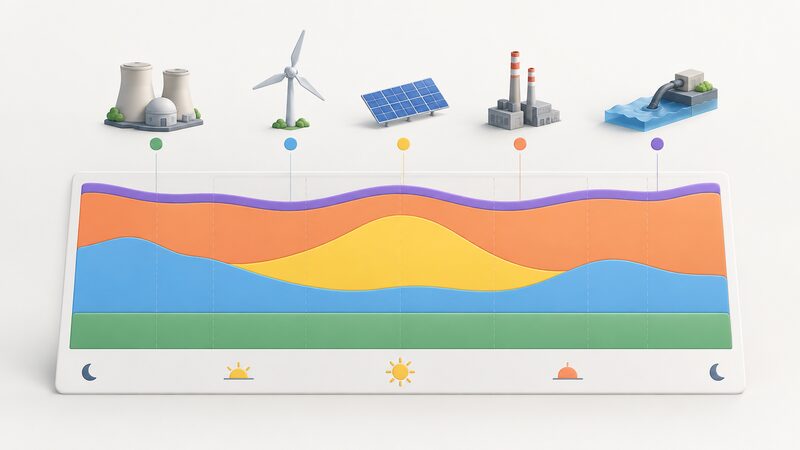
Annual percentages hide the thing that actually determines what is on the grid at any moment: weather and demand. Wind and solar run when the resource is there. Nuclear runs close to flat. Gas fills what is left, which is why its share ranges from around a quarter to up to 60% depending on the day6.
Solar is the sharpest illustration of that swing. Solar power in Great Britain rose by a third in the first six months of 2025 to produce a record 9.91 TWh, up 32%, breaking generation records for five months in a row since March 202519. A record for the highest level of solar on the grid, 14 GW, was set on 8 July 2025, 44% higher than the peak five years earlier19. Output has since reached a maximum of 15,427MW on 12 July 2026, and the record for power generated from embedded solar stands at 16.3 gigawatts, set at 12.30pm on 23 April 202620. Solar's record share of generation is 19.5%, set on 24 May 202620. None of that happens at 6pm in January.
Wind and solar are complementary rather than coincident, which is what makes the combined share stable. Only 2% of days in a typical year have both low wind generation and low solar generation, measured from January 2017 to June 202519. In the first half of 2025 the solar share of total generation increased by 2.4 TWh while the combined wind and solar change was only a 0.4 TWh reduction19. Research by the Royal Society suggests the optimal solar and wind mix is 20/8021.
Demand is also shifting. Generation by Major Power Producers rose by 3.0% over September to November 2025 against the same period a year earlier2, and nuclear generation was up 0.2% in the three months to May 20267. For how that plays out at peak, see rising electricity demand and household demand flexibility.
What is being built: wind, solar and nuclear pipelines
Offshore wind is intended to carry most of the growth. It forms the backbone of the future system, in the words of the Climate Change Committee22:
"Offshore wind forms the backbone of the future system."
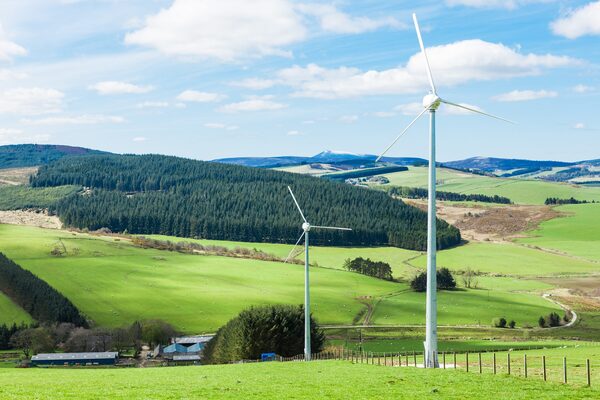
Government ambition is up to 50GW of offshore wind by 2030, including up to 5GW floating offshore wind23, a target repeated as delivering up to 50 GW by 2030 alongside work on supply-chain bottlenecks including ports, vessel capacity and manufacturing capability22. An earlier commitment set 40GW in 2030 growing to 100GW or more by 205022. The latest renewables auction in early 2026 secured 8.4GW of offshore wind overall24. More detail sits on wind power on the UK grid.
Solar deployment has run ahead of older projections. Modelling in 2014 expected about 10 to 12 GWp of solar PV in the UK by the end of that decade, from 2.7 GWp then installed, and judged that 10 GWp of non-controllable solar PV in Great Britain could be accommodated without significantly changing operational practices24. UK solar PV capacity reached 11,429 MW by November 201624, and the UK had 18 GW of solar in 202421. Estimates assume up to 47 GW of installed solar PV capacity in Great Britain by 2030, supporting up to 20,000 direct jobs and up to 35,000 direct and indirect jobs24. Seventh Carbon Budget modelling takes solar capacity to 82 GW by 204025.
| Pipeline item | Figure | Date |
|---|---|---|
| Offshore wind ambition23 | up to 50GW (incl. 5GW floating) | 2030 |
| Offshore wind secured at auction24 | 8.4GW | early 2026 |
| Offshore wind long-term22 | 100GW or more | 2050 |
| Solar PV capacity, GB24 | up to 47 GW | 2030 |
| Solar capacity, modelled25 | 82 GW | 2040 |
The four nations do not look the same
Generation mix is a UK-level statistic that conceals four very different pictures. Scotland's renewable share of generation has long run above the rest of the UK: an official comparison gave 29.3% for the UK as a whole against 25.6% for the rest of the UK excluding Scotland26, the gap being entirely Scottish hydro and wind. Scotland is legally committed to net zero greenhouse gas emissions by 2045. See energy supply in Scotland.
Wales has adopted a target to meet the equivalent of 100% of annual electricity consumption from renewable sources by 2035, alongside a target of at least 1.5 GW of renewable capacity being locally owned by 2035. Those are consumption-equivalence targets rather than hour-by-hour self-sufficiency: Welsh electricity still flows onto a shared transmission system. Energy supply in Wales covers this in detail.
Northern Ireland is the clearest exception. It is not part of the Great Britain market at all, sitting instead in the all-island Single Electricity Market with its own system operator and its own interconnection. Figures quoted for "GB" generation, including the solar records and the Smart Export Guarantee, do not apply there. See energy supply in Northern Ireland and the Moyle and East-West interconnectors.
Set against neighbours, the UK generates comparatively little per head: EU members produce on average almost 50% more electricity than the UK on a per capita basis27. That is a statement about the size of the system, not its cleanliness, and part of the explanation is the UK's reliance on gas for heat rather than electricity in homes.
The rules that shape what is reported and what is built
Three sets of rules bear on the mix a household actually sees.
Fuel mix disclosure. All UK energy suppliers are required to publish information about their energy fuel mix annually28. That is why a supplier's percentages exist at all, and why they cover a supply year rather than a calendar year. For renewable electricity generated overseas and supplied in Great Britain, qualifying renewable electricity must be generated in a Member State of the EU29. A "100% renewable" tariff is therefore a contractual and certificate claim about a supply year, not a statement that renewable electrons reached a given meter.
Support for generation. The Smart Export Guarantee supports solar photovoltaics, wind, micro-combined heat and power, hydropower and anaerobic digestion up to 5 megawatts in capacity, or up to 50 kW for micro-CHP, and installations must be located in Great Britain30. Larger low-carbon plant is funded through Contracts for Difference, with the closed Renewables Obligation still appearing on bills.
Levies and the price signal. An official expert group found that most of the regulated social and environmental levies are made on electricity rather than gas, increasing electricity's relative price, and that a rebalancing through action of the UK Government and Ofgem is urgently needed31. That policy choice sits between a cleaning grid and any household saving from it.
On safety, all UK electricity systems comply with the exposure limits in force in the UK for electromagnetic fields28.
What the mix means for household energy independence
A cleaner grid is a national gain in energy security before it is a household one. Renewables have cut the UK's dependence on foreign fuels for electricity generation from 65% in 2014 to under 50% today, reported in 202510, and solar is credited with reducing dependence on fossil fuel imports20. Against that, the UK remains, on the Treasury's own description, "a net energy importer with a high dependence on gas and oil"33.
Gas is the connection point between a household bill and a global market. Of UK gas demand in 2024, 26% was for electricity generation4, and in 2021 electricity generation took 29.8% of UK gas use11. Because gas frequently sets the wholesale electricity price, a household on a fully renewable tariff still buys electricity priced in part by gas. That is the case even though offshore wind is reported as 60% cheaper than fossil fuels10. The mechanism is explained further in how the wholesale markets work and how global events move UK energy prices.
What a household can and cannot control is worth stating plainly:
- Cannot be changed by switching: the physical mix delivered to a meter, which is whatever the grid is running at that second.
- Can be chosen contractually: a tariff backed by UK-generated renewable electricity from independent producers, for example one supplier whose tariffs are described as powered by 100% renewable energy generated in the UK by independent producers28.
- Can be reduced but not removed: grid dependence, through on-site generation and storage. Even a well-equipped home retains a connection, a supplier, standing charges and network charges.
- Remains external: fuel imports, interconnector flows, the capacity market and the balancing services that hold the system together.
The practical consequence of the daily swing is that timing matters more than the annual percentage. Where a home can shift load into the hours when wind and solar are plentiful, it uses a cleaner and often cheaper grid; where it cannot, it draws on the gas that is filling the gap. The UK grid is supplied by a mix of wind, nuclear, gas and solar32, and around half of UK electricity now comes from renewable sources34, with over a third of Britain's electricity generated by wind, solar or hydro8 and over half from renewable energy sources on another 2026 assessment34. Independence at household level is built from the storage, flexibility and generation a home controls, set against a grid mix it can read but not choose. For that side of the question, see energy security and household independence.
Sources34 cited
- How to save money on energy bills, CIPHE, 2026-09-17
- Energy Trends and prices statistical release, 29 January 2026, GOV.UK, 2026-01-29
- Are electric heaters eco-friendly?, Which?, 2024
- Energy research briefing, House of Commons Library, 2025
- Energy UK explains the April 2025 price cap rise, Energy UK, 2025-02-20
- Why are energy bills so high?, Energy UK, 2026-05-27
- Energy Trends and prices statistical release, 30 July 2026, GOV.UK, 2026-07-30
- Getting smarter with energy, Centre for Sustainable Energy, 2026-03
- UK energy statistics, Uswitch, 2025-12-17
- Factcheck: why expensive gas, not net zero, is keeping UK electricity prices so high, Carbon Brief, 2025-05
- What's in an energy bill: wholesale costs, Nesta, 2024-11-22
- Differences between green energy suppliers, Which?, 2024
- Decarbonisation of heat, Energy Systems Catapult, 2025-06-27
- Nuclear energy briefing POST-PN-0736, UK Parliament POST, 2023
- Analysis: UK's electricity was cleanest ever in 2024, Carbon Brief, 2024
- The challenge of shifting peak electricity demand, Nesta, 2013-11-01
- What's in my energy bill, ECIU, 2019
- Quarterly Energy Prices, March 2012, UK Parliament, 2012-03
- A record year for British solar, Ember, 2025-08-28
- Britain benefits from the summer sun as July smashes solar generation record, Solar Energy UK, 2026-07-12
- Solar power briefing POST-PN-0771, UK Parliament POST, 2026-06-25
- End the fossil fuel age for a secure and prosperous future, Climate Change Committee, 2025-02-26
- NESO system documentation, NESO
- DESNZ annual report and accounts 2025 to 2026: performance report, GOV.UK, 2026
- The Seventh Carbon Budget, Climate Change Committee, 2025
- Annual Energy Statement 2019, Scottish Government, 2019-05-15
- Electricity prices in Great Britain, House of Lords Library, 2026-06
- Where does my energy come from?, Uswitch, 2026-08-03
- FIT Guidance for Licensed Electricity Suppliers V17.1, Ofgem, 2024-09-06
- Smart Export Guarantee briefing CBP-9585, House of Commons Library, 2026-05-13
- Heat Pump Sector Deal Expert Advisory Group interim report, Scottish Government, 2021-06-14
- Plug-in solar panels, Energy Saving Trust, 2026-09-17
- Spring Statement 2022, HM Treasury, 2022-03
- Electric heating, Centre for Sustainable Energy, 2026-06
 What Makes Up a BillBreaks a domestic energy bill into wholesale costs, network charges, policy levies, operating costs, supplier margin and VAT, with the share each takes and how those shares have moved since the energy crisis.
 The Full Where Our Energy Comes From GuideWhere does the gas in your boiler and the electricity in your sockets actually come from?
 The Full Statistics GuideHow many homes in the UK have solar panels, heat pumps or batteries?
 Household Import DependenceGas and oil make up most of what a typical UK home spends on energy, and roughly half of that gas comes from abroad.
 Renewable Generation by NationHow much of our electricity comes from renewables, and why do the figures keep changing?
 Data and Energy IndependenceHow many UK homes actually make their own power, and is that number really growing?