

In this guide
The National Energy System Operator publishes a seasonal assessment of whether Great Britain's electricity system is expected to meet demand: a Winter Outlook before the winter period and a Summer Outlook before the summer. These are forecasts of headroom, not predictions of power cuts. The headline number is the de-rated margin, the amount of generation and other capacity expected to be available above peak demand once each plant type is discounted for the chance it is unavailable. For winter 2025/26 the electricity assessment gave a de-rated margin of 6.1GW, 10.0% of average cold spell peak demand, with a loss of load expectation below 0.1 hours a year1.
NESO itself was established in October 2024. It is the whole system planner, the operator of the electricity system and expert adviser to government and Ofgem2. Being responsible for ensuring there is enough power to meet demand, it is the body that would instruct regional network operators to reduce demand if supply could not be met, which is why its seasonal publications are read closely3.
The practical message from the network companies that would carry out any such instruction is consistent: emergency power cuts are described as unlikely, a worst case with robust industry plans in place and disconnection used as a last resort3. For a household, the Outlooks are best read as a description of how much slack the system has, what would have to go wrong at once for that slack to disappear, and which parts of the system are carrying the risk.
What the seasonal Outlooks are, and what they are not
A seasonal Outlook is an assessment document. It states expected demand for the season, expected available supply, the resulting margin, and the assumptions behind both. It is not a policy statement and it does not commit anyone to build anything. The same distinction applies to other government-published outlook documents: the Net Zero Technology Outlook, for example, states plainly that it is not a statement of government policy and exists to orient decision-making6.
That matters when Outlook figures appear in news coverage. The operator's winter work has previously set out a worst-case scenario in which a very cold period combined with significantly reduced gas supplies from Europe affecting electricity generation would create a greater potential for emergency customer disconnections4. That is a scenario built to test the edges of the system, published alongside a central view. The operator raised the possibility of emergency power cuts in its Winter Outlook report but said it was unlikely they would be needed3.
The two companion questions, how much capacity exists and how much is contracted, are answered by different documents. Margin comes from the Outlook. Contracted firm capacity comes from the Capacity Market, which is technology neutral and procures ahead of delivery1.
Why a system operator publishes ahead of each season
Seasonal publication exists because the risks in an electricity system are seasonal and because the parties who must respond need lead time. Generators plan maintenance around it, interconnector operators and traders price around it, government reads it for security of supply reporting, and network companies use it to rehearse emergency procedures.
There is also a transparency function. NESO's whole-system advisory role includes producing a Strategic Spatial Energy Plan, setting out future generation and storage needs, and assessing the resilience of the energy system in Great Britain7. Seasonal Outlooks are the short-horizon end of that same duty: the long plan says what should be built, the Outlook says what is actually available this winter.
Weather correction is one reason these documents need refreshing rather than repeating. Gas demand in particular is adjusted so that the latest view of seasonal normal is applied, giving the most up to date view of weather correction for the gas dataset8. Electricity consumption is less affected by the weather, and in the national efficiency statistics electricity data is not weather corrected at all9. Gas is the weather-sensitive fuel, which is why gas assumptions do so much work in a winter assessment.
What the Winter Outlook covers: supply adequacy and margin
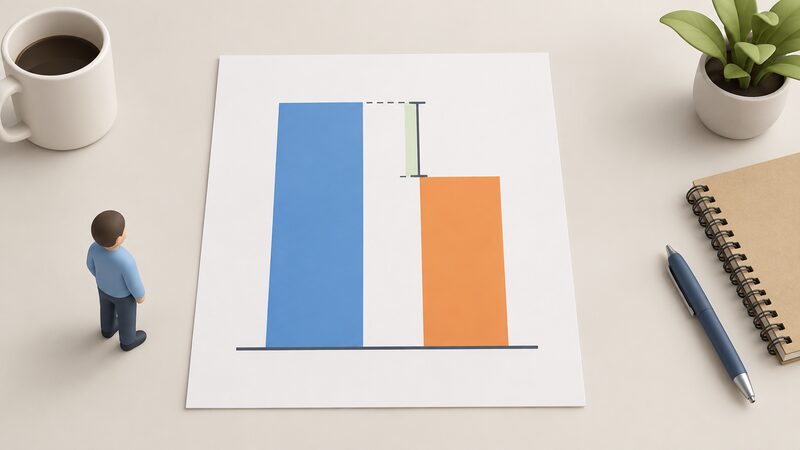
The winter document answers one central question: at the hour of highest expected demand, how much capacity is expected to be available, and by how much does it exceed that demand? The measure used is the de-rated margin, expressed in gigawatts and as a percentage of average cold spell peak demand. For winter 2025/26 that was 6.1GW, or 10.0%1.
Alongside it sits loss of load expectation, the statistically expected number of hours per year in which supply would need to be supplemented by emergency actions. For 2025/26 this was assessed as below 0.1 hours a year1. The reliability standard framing matters: loss of load expectation counts hours where the operator would need to act, not hours where households lose supply. Most of those hours, in the rare years they occur, would be met by measures well short of disconnection.
The winter assessment also draws on demand-side capability. Demand side response covers a range of services that vary the demand of both domestic and commercial consumers to help balance the power grid, and it is used to manage peak demand so as to reduce the network investment required as electrification of heating and transport raises demand, and to match demand with the intermittent output of renewable generation10. NESO has published a target to secure an additional 750MW of non-domestic flexibility in its services and markets by 20305. Household participation runs through the Demand Flexibility Service and similar arrangements11.
What the Summer Outlook covers: demand lows and maintenance windows
The summer document inverts the winter question. The risk in summer is rarely that there is too little generation; it is that there is too little demand, and too little of the right kind of plant running, on a sunny, windy, low-demand day. That creates problems of voltage management, system stability, and the need to constrain generation off.
Summer is also the maintenance season. Thermal plant, transmission circuits and interconnectors take outages in the months when the margin can absorb them, and the Summer Outlook sets out the planned outage programme and what it leaves available. Where a cold snap in winter is the binding case, in summer the binding cases are a warm low-demand Sunday and the restoration of plant in time for autumn.
Two other summer themes appear in the operator's work programme. Constraint management is changing: NESO will no longer procure constraint management actions through the Local Constraint Market from 7 October 202611. And the treatment of curtailment is being made more visible, with skip rate figures for clean flexibility behind thermal constraints due to be published by Q3 2026, and NESO's approach to clean flexibility in Regional Energy Strategic Plans due in Summer 20265.
How the assessment is built
The method is broadly the same in both seasons, and knowing it is what stops the headline figure being over-read.
- Estimate peak demand for the season, on an average cold spell basis for winter, using weather-corrected data where the fuel is weather sensitive8.
- De-rate each capacity type by its expected availability, so that a nominal gigawatt of a plant type that is sometimes unavailable counts as less than a gigawatt.
- Add interconnector and storage contributions, again de-rated, reflecting how much can be relied on at the peak hour rather than nameplate capability.
- Subtract demand that can be turned down, including contracted demand-side services10.
- Express the result as a margin in GW and as a percentage, and run the probabilistic model to produce a loss of load expectation1.
- Test sensitivities, including cold weather combined with reduced imports, to produce the worst-case narrative that accompanies the central view4.
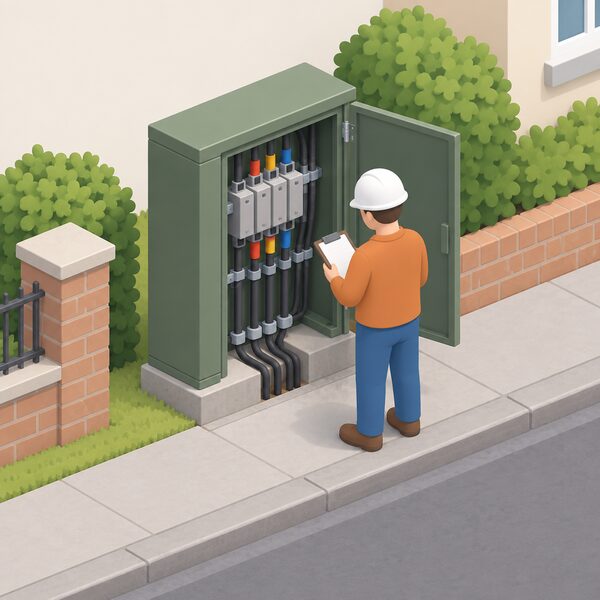
The same underlying availability question runs through connections work. On the distribution side, a network operator must check whether the grid is able to take extra electricity load before a new installation is running12. Nationally, connections reform will deprioritise almost 500GW of projects in the oversubscribed connections queue, a reform NESO has planned and is delivering2. What eventually clears that queue determines the capacity available to future Outlooks, which is discussed further on the grid connection queue page.
Key figures: margin, loss of load and what sits behind them
| Measure | Winter 2025/26 value | What it means |
|---|---|---|
| De-rated margin | 6.1GW, 10.0% of average cold spell peak demand1 | Expected headroom at peak after availability discounts |
| Loss of load expectation | Below 0.1 hours per year1 | Statistically expected hours needing operator intervention |
| Capacity Market status | Technology neutral1 | Firm capacity procured regardless of technology type |
| T-1 auction, 2025/2026 delivery | Concluded 5 March 20251 | Top-up procurement close to delivery |
| T-4 auction, 2028/2029 delivery | Concluded 11 March 20251 | Main forward procurement |
| Next auctions | March 20261 | Following T-1 and T-4 round |
Interconnector flows are the most volatile input in the table's background. They are assumed rather than guaranteed: a connected market under its own stress will not export. NESO is due to issue updated connection offers to Gate 2 interconnectors by Q3 2026 in phase 1 and Q4 2026 in phase 25. The role of imports and exports is set out on the electricity interconnectors page.
Weather, imports and plant availability
Three variables move a seasonal forecast more than any others.
Weather. Cold raises heating demand and gas demand together; still, dark conditions suppress wind output at the same time. The gas dataset is weather corrected to the latest view of seasonal normal for exactly this reason8. Adaptation of networks to a changing climate is now a regulatory expectation as well as an operational one: in Northern Ireland, the Utility Regulator's price controls require business plan strategies to consider how climate change could impact networks and to outline adaptation actions to manage risks to services7.
Imports. Gas and electricity imports are assumed available at levels drawn from market behaviour, not from contracts that guarantee delivery. The published worst case makes the dependency explicit: significantly reduced gas supplies from Europe during a very cold period is precisely the combination that produces a greater potential for emergency customer disconnections4. See where Britain's gas comes from for the supply picture behind that assumption.
Plant availability. De-rating factors encode historical availability. A fleet that breaks down more than history suggests erodes the margin without any change in the headline capacity number. This is where the Outlook and the electricity margins notices differ: the Outlook is seasonal and statistical, notices are issued in real time when the day-ahead position tightens.
What the Outlooks mean for a household's energy security
For a household, a seasonal Outlook is information about a dependency, not a lever. The figures describe the reliability of a national system the home is connected to; they do not change what the home can control.
"Emergency power cuts are unlikely this winter"
That framing matters, but so does the qualification. Power cuts arising from an energy shortage can take place without warning where NESO instructs local networks to reduce power demand14. Compensation rules do not cover this case: under the Guaranteed Standards of Performance there is no payment for blackouts caused by a national power shortage, nor for damage to electrical equipment or appliances, nor for a low supply after a power cut15. A household therefore carries the consequence of a national shortage directly.
What a home can influence is its own exposure. Reducing demand is the durable route: the Future Homes and Buildings Standards work sets out a policy priority to reduce the energy demand of homes and non-domestic buildings by requiring high performing building fabric and building services in new buildings, thereby improving energy security16. The national efficiency data framework exists to assess the impact of installing home efficiency measures such as loft insulation on household energy consumption17. A better insulated home needs less at the peak hour the Outlook is modelling, which is discussed further under energy security and household independence.
The stakes are not abstract. Excess winter deaths attributable to cold homes are tracked annually using Office for National Statistics data for England and Wales combined with National Records of Scotland and Northern Ireland Statistics and Research Agency figures18. In Northern Ireland, NISRA recorded 740 winter excess deaths in 2023/2419. Northern Ireland is not covered by the Great Britain electricity Outlook at all; it sits in the Single Electricity Market, and households there can get independent and impartial energy advice, plus referrals to energy grants, from NI Energy Advice20. The arrangements are set out on energy supply in Northern Ireland.
Reading the published reports without over-reading them

A few habits make the documents usable.
- Check the scenario label. Central case and worst case sit in the same publication and carry very different meanings3.
- Read margin and loss of load together. A percentage margin alone says nothing about probability; the loss of load figure does, and for 2025/26 it was below 0.1 hours a year1.
- Note the geography. The electricity Outlook covers Great Britain. NESO is establishing a GB-wide National Steering Committee including representatives from NESO, government and Ofgem, and is expected to establish regional strategic boards to steer and oversee Regional Energy Strategic Plan development2. In Wales, government has been asked to work with distribution network operators and the development community to better understand grid net capacity requirements and the impacts of connection delay times by region21.
- Pair the Outlook with the government's own report. The annual Statutory Security of Supply Report restates the season's margin and loss of load figures and the Capacity Market auction calendar1.
- Watch the dated commitments. NESO is to complete an impact assessment of previously delivered load response actions to determine next steps by October 2026, will develop a Market Navigator Tool in 2027, and will remove key barriers enabling Wider Access participants, Virtual Lead Parties and suppliers, by Q3 20275.
Broader statistical context for demand sits elsewhere. Subnational electricity and gas consumption figures for 2024 were published on 18 December 2025 and last updated on 19 December 202524, and the government's Public Attitudes Tracker, whose Winter 2025 wave was published on 12 March 2026 as the fifteenth wave in a series beginning in Autumn 2021, tracks how the public views energy security25. Neither is part of the Outlook, but both are read alongside it.
Finally, the Outlook does not remove the dependencies it describes. Reading it tells a household how much margin the national system expects to have; it does not give the household any of that margin. Independence from the swings the document tracks comes from lower demand, on-site generation and storage, and the ability to shift use away from the peak hour, not from the report itself.
Sources25 cited
- Statutory Security of Supply Report 2025, GOV.UK, 17 December 2025
- Electricity distribution networks study: government response, GOV.UK, 7 July 2025
- Emergency power cuts guidance, Electricity North West, 19 September 2026
- Electricity Supply Emergency Code, SSEN, 19 September 2026
- Clean Flexibility Roadmap, July 2026 update, GOV.UK, 2026
- Net Zero Technology Outlook report, GOV.UK, 21 August 2025
- Monitoring framework: a well adapted energy system, Climate Change Committee, 19 September 2026
- Review of typical domestic consumption values: decision, Ofgem, 27 May 2026
- National Energy Efficiency Data-Framework summary of analysis 2026, GOV.UK, 11 June 2026
- Demand side response, Parliamentary Office of Science and Technology, 7 June 2026
- Demand Flexibility Service, NESO, 2026
- Building regulations and renewables guidance, Bedford Borough Council, 2026
- Electricity networks briefing, Parliamentary Office of Science and Technology, 6 January 2025
- Care and assisted living providers guidance, Energy Networks Association, 17 September 2026
- Check if you can get a payment for a power cut, Ofgem, 2026
- The Future Homes and Buildings Standards consultation, GOV.UK, 2026
- NEED impact of measures data tables 2025, GOV.UK, 26 June 2025
- Excess winter deaths caused by cold homes, End Fuel Poverty Coalition, 17 January 2024
- Northern Ireland fuel poverty strategy comment, National Energy Action, 2023
- Energy saving grants in your area, nidirect, 17 September 2026
- Preparing Wales for a renewable energy 2050, Welsh Government, October 2023
- Check if you are owed money on your energy bill, Ofgem, 2026
- Customer credit balance explanatory note, Ofgem, March 2024
- Subnational electricity and gas consumption summary report 2024, GOV.UK, 18 December 2025
- DESNZ Public Attitudes Tracker: Winter 2025, GOV.UK, 12 March 2026
 UK Cooling DemandPublished data on air conditioning ownership and home overheating, with projections for summer temperatures in each UK nation, and what rising cooling demand means for summer electricity use.
 Electricity Margin ShortagesWill the lights stay on this winter, and what would have to happen before homes lose power?
 The Winter GapSolar panels make most of their power in summer, but homes need the most electricity on dark winter mornings and evenings.
 Household Resilience and RiskWhat happens to your heating and lights if the power goes off for days?
 The Full Energy Suppliers GuideWho the UK's domestic gas and electricity suppliers are, how the market is structured across Great Britain and Northern Ireland, what a supplier is licensed and obliged to do, how the price cap limits bills, what happens when a supplier fails, and who regulates it all.
 Rising Electricity DemandElectric cars, heat pumps and data centres all need more electricity, so how much more will the UK actually use, and will the grid cope?