
In this guide
A household bill in Britain is set by events that happen thousands of miles away, and the route between them is short. The UK is a net importer of natural gas, meaning it imports more than it exports, so it is vulnerable to global price volatility1. Gas is bought and sold on an international market, and as of May 2025 UK wholesale gas prices remained three times higher than they were before the global energy crisis2. When supply is disrupted anywhere, the price paid in Britain moves with it.
The most recent example is the Middle East conflict in 2026, which severely limited the production, storage and transportation of natural gas across the world, which has driven gas prices up3. That pressure reached the cap on household tariffs: from 1 July 2026 bills increased by around 13.5%, and gas unit rates rose from 6.29p per kWh last winter to 8p from 1 October, up around 27% year on year and the highest for some years4. Electricity unit rates were held roughly stable, helped by the Government cutting VAT on electricity4.
The scale of the transmission is what makes it worth understanding. Ofgem's cap does not set a bill; it sets maximum unit rates and standing charges, and it is reset every three months5. Between those resets, a war, a sanction or a cold snap in another hemisphere becomes a number on a household's statement. This page sets out how that happens, what the cap actually limits, and what remains within a household's own control.
Why global events reach a UK household bill
The chain has three links: international supply, the wholesale market, and the cap. Britain sits at the end of it because of how it heats and generates. Domestic energy consumption accounts for about 30% of the UK's total energy budget, so what happens to gas prices is not a marginal matter for households7. Nor is the effect confined to the gas burned at home: up to half of the rise predicted for 2022 was expected to come not from the gas a household burns, but from the impact of gas on electricity prices.
The second link is the wholesale market. UK and European wholesale gas prices increased by more than 30% between the week beginning 14 February and the week beginning 14 March 2022, a period that followed the invasion of Ukraine8. Earlier in the same episode, there had been a record increase in global gas prices over the last six months, with wholesale prices quadrupling in the last year9. The high gas price rise forced several energy suppliers out of the market1, which is the point at which a global price becomes a domestic administrative event: a supplier fails, its customers are moved to another, and the cost of that failure is spread across bills.
The third link is the cap. Ofgem adjusts the level of the cap up or down twice a year to reflect the costs of supplying electricity and gas for suppliers, a description that dates from the 2021 methodology decision and has since been superseded by quarterly resets10. The direction of travel is set by the wholesale market, and the cap follows with a lag of weeks to months.
"We provide this advice in the context of heightened concerns over energy security and record increases in energy bills reflecting record highs in international gas prices"
The effect is not confined to energy. Homes are facing more than £400 extra in food bills this year because of the impact of climate change and oil and gas prices on the farming and food system, according to a 2023 consultation12. A household's exposure to global events runs through the gas boiler, the electricity meter and the shopping basket.
The price cap: what Ofgem actually limits
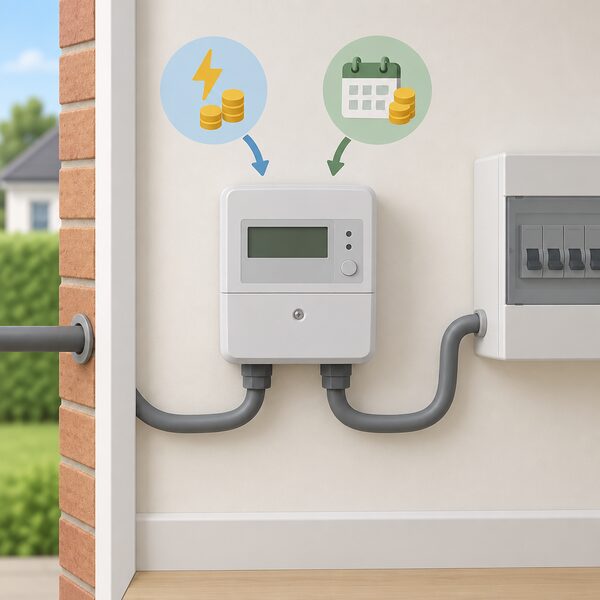
The cap is administered by Ofgem, Great Britain's energy regulator, and it applies to standard and default tariffs, reviewed and updated every three months5. Its purpose is narrow and specific: it protects people who are on tariffs where the unit rate can go up or down depending on the energy market, which are called standard variable tariffs13. It limits the maximum amount of energy suppliers can charge you for each unit of energy you use5.
That distinction matters more than any headline figure. The price cap limits the unit cost of energy and standing charges which firms can charge, not the total bill4. A household using more than the modelled typical consumption pays more than the quoted level; one using less pays less. The cap is a rate ceiling, not a spending ceiling.
The cap was first introduced in January 2019, and Ofgem, the government regulatory body for gas and electricity, reviews it regularly14. It applies to around 20 million GB households who are on variable tariffs, including 5 million prepayment meter customers and 3 million standard credit customers4. A separate market exists alongside it: around 11 million households fix their rates4.
| What the cap does | What the cap does not do |
|---|---|
| Sets a maximum unit rate for gas and electricity5 | Cap the total annual bill4 |
| Sets a maximum daily standing charge4 | Cover fixed tariffs a household has agreed13 |
| Applies to standard variable and default tariffs5 | Cover business contracts, heat networks or heating oil13 |
| Covers around 20 million GB households on variable tariffs4 | Apply below regional level15 |
How your bill is built up: wholesale costs, networks and levies
A bill is a stack of costs, and only one of them is the wholesale market. Ofgem lists wholesale costs, network costs, operating, debt and industry costs, EBIT, policy costs, VAT, the type of energy used, the type of meter installed and how you pay your bill16. VAT is charged at 5%16.
The composition of recent increases is the clearest evidence of what drives bills. Wholesale costs account for 54% of the rise in UK household electricity bills since pre-crisis levels, network charges 20% and green levies 6%2. In cash terms, some £162 of the increase is due to wholesale costs, which have roughly doubled over the period, while some £63 has been added to bills since 2021 as a result of rising network charges, another £18 from green levies2. The same figures appear in parliamentary research, which puts network charges and green levies at 20% and 6% of the rise since pre-crisis levels respectively17.
The practical consequence is that a fall in wholesale prices does not return a bill to its old level. Network charges and policy costs are recovered through standing charges and unit rates that do not move with the gas market, and they have been rising. Ofgem attributed its August 2025 increase to increases to parts of the costs of transporting energy in Great Britain, covering England, Scotland and Wales, and costs towards government schemes and essential support18. Annual bills for typical consumption under the cap were still almost £800, or 69%, above their summer 2021 levels as of October 202319.
Wholesale gas: bought and sold on a global market
Britain's gas comes from its own fields, from Norway by pipeline, and from LNG shipped from further afield. The relevant fact for prices is that the UK is a net importer of natural gas, meaning it imports more than it exports, and is therefore vulnerable to global price volatility1. Once gas is landed, it trades at prices set by international supply and demand rather than by domestic production.
The electricity market inherits that price. Gas sets the wholesale price of electricity for a very high share of hours in Great Britain, far more often than in other European countries, including France at 7% or Germany at 24%2. That is why a gas price spike becomes an electricity price spike even in a system with substantial renewable generation. The mechanism is the marginal plant: the most expensive generator needed to meet demand sets the price for the period, and that plant is usually gas-fired.
The record of the 2021 and 2022 episode shows how fast this can move. Wholesale prices quadrupled in the year to February 20229, and UK and European wholesale gas prices rose by more than 30% in a single month that March8. Several suppliers failed under the strain1. As of May 2025, wholesale gas prices remained three times higher than before the global energy crisis2.
For a household, the dependence is structural. A gas boiler, a gas hob and a gas-fired electricity system all connect the home to a market it cannot influence. The pages on where Britain's gas comes from and how the wholesale gas and electricity markets work set out the supply routes and the trading arrangements behind that exposure.
Conflict in the Middle East: the current driver of cap rises
The Middle East conflict in 2026 has severely limited the production, storage and transportation of natural gas across the world, which has driven gas prices up3. The effect on the cap has been direct and recent. From 1 July 2026 bills increased by around 13.5%4. Gas unit rates rose from 6.29p per kWh last winter to 8p from 1 October, up around 27% year on year and the highest for some years, while electricity unit rates were held roughly stable, helped by the Government cutting VAT on electricity4. Initial predictions for the period beginning 1 January 2027 point to a further 12% rise in the gas unit rate4.
The same conflict has reached fuels outside the cap. Heating oil prices rose as a knock-on effect of the ongoing conflict in the Middle East and fluctuating oil prices, and heating oil is not covered by Ofgem's energy price cap, leaving consumers fully exposed to sudden market increases20. That is the sharpest illustration of the difference the cap makes: two households facing the same global event, one with a regulated rate ceiling and one without.
The pattern is consistent with earlier episodes. A conflict or a supply restriction reduces the volume of gas that can be moved, the marginal price rises, and the cap follows at its next reset. The lag is the household's only buffer, and it is measured in weeks.
What past crises did to bills: from £1,277 to a £3,116 peak

The recent record gives the scale. The cap stood at £1,277 before the crisis, and the Energy Price Guarantee, which replaced the cap as the effective limit for households, set a typical annual figure of £2,500 from October 2022. The cap level reached £3,116 in April to June 202322. The Energy Price Guarantee ran until 30 June 202323.
The comparison Ofgem itself uses is against the height of the crisis. Its February 2025 announcement put the new level £531, or 22%, lower than at the height of the energy crisis at the start of 2023, when the Energy Price Guarantee was in place, for an average dual fuel direct debit household18. That is a fall from a peak, not a return to the starting point: annual bills for typical consumption under the cap were still almost £800, or 69%, above summer 2021 levels as of October 202319.
| Period | Cap level or typical bill | Note |
|---|---|---|
| Before the crisis | £1,277 | Cap level before the price spike22 |
| April to June 2023 | £3,116 | Cap level at the peak22 |
| 1 April 2024 to 30 June 2024 | £1,110.43 | Electricity only, London, 4,200 kWh, first consumption band24 |
| 1 October to 31 December 2025 | £1,717 for the same period in 2024 | The 2025 cap was 2.2% per year higher than the 2024 figure18 |
| 1 January to 31 March 2026 | around £1,758 | Dual-fuel home with typical usage paying by direct debit6 |
The £1,110.43 figure is not comparable with the headline numbers: it is an electricity-only cap for London at a defined consumption level, and it shows how much the published level depends on what is being measured24. The £1,717 and £1,755 figures are the same kind of illustration for different periods, and the published levels for overlapping periods do not match, so both are given as published18.
How the cap moves: quarterly resets and how to track them
The cap is reviewed and updated every three months5. Ofgem's earlier methodology described adjusting the level up or down twice a year to reflect the costs of supplying electricity and gas for suppliers10, and the quarterly cycle has since replaced that rhythm. The practical effect is four announcements a year, each roughly a month before the period it governs.
The next period starts on 1 January 2027 and will be announced in late November 20264. The period running from 1 October 2026 is already set, with the gas unit rate at 8p per kWh and the electricity unit rate at 26.32p per kWh4. The gas standing charge is 29.68p per day, a rise of 2.2% from the previous quarter, while the gas unit rate rose 8.7% over the same step4.
Tracking the cap means tracking the wholesale market that feeds it. The announcements themselves are published by Ofgem, and the level for each region is published alongside them. A household wanting to know what is coming can follow the wholesale price and the quarterly announcement dates rather than the headline figure alone, because the headline figure is an average that may not describe their home.
Regional variation: 14 caps across Great Britain

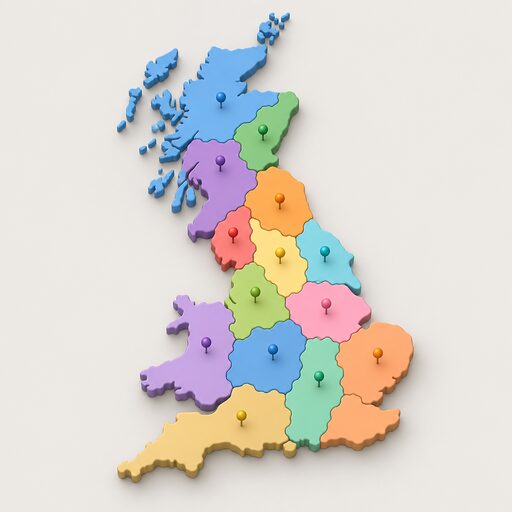
There is not one cap. A separate price cap is set for each of the 14 regions and applies throughout the region, with no breakdown below regional level15. It sets maximum prices for a unit of energy and daily standing charges for customers in each energy supply region of Great Britain15. The cap does not extend to Northern Ireland, which has its own arrangements.
The differences between regions are material. Some regions, such as Merseyside and North Wales, will pay substantially more than others, such as those in London4. The Northern region's electricity table for 1 July to 30 September 2026 shows a standing charge maximum of £223.48 and an annual bill of £824.03 at 2,500 kWh on a single-rate meter, and a standing charge of £220.70 with an annual bill of £986.44 at 3,400 kWh on a multi-rate meter26. Those are maximum charges for that region and that consumption, not a national figure.
The regional spread reflects the cost of moving energy to different parts of the network, and it means a household comparing its bill with a national headline is often comparing unlike things. The pages on the electricity distribution networks and the network charges behind your bill explain what those regional costs recover.
Who the cap protects, and who falls outside it
The cap protects people on standard variable tariffs, where the unit rate can go up or down depending on the energy market13. It does not cover fixed tariffs a household has agreed with a supplier, business energy contracts, heat networks or heating oil13. A household that has fixed its rate has chosen a different protection: certainty for the term of the deal, in exchange for giving up the benefit of a fall.
There is one important exception in the other direction. A household is still covered by the energy price cap even if it is put on a deemed contract, which is what happens when a supplier fails and the customer is transferred27. That matters because supplier failure has been a feature of the recent market: the high gas price rise forced several energy suppliers out of the market1. The cap follows the customer through the transfer.
Outside the cap, the exposure is complete. Heating oil prices are not regulated by Ofgem and are not covered by the energy price cap21, and heating oil is not covered by Ofgem's energy price cap, leaving consumers fully exposed to sudden market increases20. The same logic applies to LPG and to heat networks. The page on heating oil and LPG supply in the UK covers those fuels in more detail.
"heating oil is not covered by Ofgem's energy price cap, leaving consumers fully exposed to sudden market increases"
What this means for household energy independence

The honest reading of the evidence is that a household's exposure to global events is structural, and the cap manages it rather than removing it. Domestic energy consumption accounts for about 30% of the UK's total energy budget, and the price cap limits the unit cost of energy and standing charges which firms can charge, not the total bill7. As long as a home is heated by gas and supplied by a grid whose price is set by gas, the international market reaches the meter.
What a household controls is demand, not price. The UK Government's Heat and Buildings Strategy states that delivering on its goals will help to protect UK consumers from future price spikes and increase energy security by reducing energy needs and shifting demand from gas to electricity, which in future will be predominantly supplied from UK-based renewable generation11. That is a statement of direction, not a guarantee of a lower bill, and it depends on the generation mix and the network being built to support it.
The historical record offers one caution against reading any single trend as permanent. Energy prices have risen, but energy bills are actually down since the Climate Change Act was passed in 2008, reflecting improved energy efficiency28. In 2024 consumption per household increased by 2.9 per cent, as consumption increased more sharply than the number of households29. Efficiency gains and consumption growth pull in opposite directions.
The dependence that remains is specific: the grid, a supplier, the gas network, imported gas, and the international market that prices it. The pages on energy security and household independence and the UK energy supply pillar set out what a home can and cannot insulate itself from. The cap is a ceiling on rates, not a shield from the world.
Sources29 cited
- UK energy market research briefing, House of Commons Library, 2022
- Why expensive gas, not net zero, is keeping UK electricity prices so high, Carbon Brief, 2025
- Gas only energy guide, Uswitch, 2026
- Ofgem price cap explained, End Fuel Poverty Coalition, 2026
- Grants and schemes for energy bills, Smart Energy GB, 2026
- Energy price cap explained, Welsh Government, 2026
- Scotland without fuel poverty, Scottish Government, 2016
- Spring Statement 2022, HM Treasury, 2022
- Price cap methodology decision, Ofgem, 2022
- Changes to the energy price cap, October to December 2025, Ofgem, 2025
- Written evidence on domestic energy consumption, UK Parliament, 2019
- Food bills and energy prices consultation, UK Parliament, 2023
- Energy price cap, Ofgem, 2026
- Energy price cap research briefing, House of Commons Library, 2026
- Energy price cap research briefing, House of Commons Library, 2026
- How your electricity or gas bill is calculated, Ofgem, 2026
- Electricity prices in Great Britain, House of Lords Library, 2026
- Energy price cap announcements, Ofgem, 2025
- Energy price cap research briefing, House of Commons Library, 2023
- Heating oil support debate, Hansard, 2026
- Breaking the cycle: tackling fuel poverty, Smart DCC, 2026
- Energy Price Guarantee, GOV.UK, 2023
- Energy consumption in the UK 2025, GOV.UK, 2025
- Default tariff cap level, April to June 2024, Ofgem, 2024
- Energy price cap increase, Ofgem, 2025
- Energy price cap levels, July to September 2026, Ofgem, 2026
- Energy prices and bills: impacts of meeting carbon budgets, Climate Change Committee, 2020
- Climate policy that cuts costs, Climate Change Committee, 2023
- Independent assessment of the UK's heat and buildings strategy, Climate Change Committee, 2022
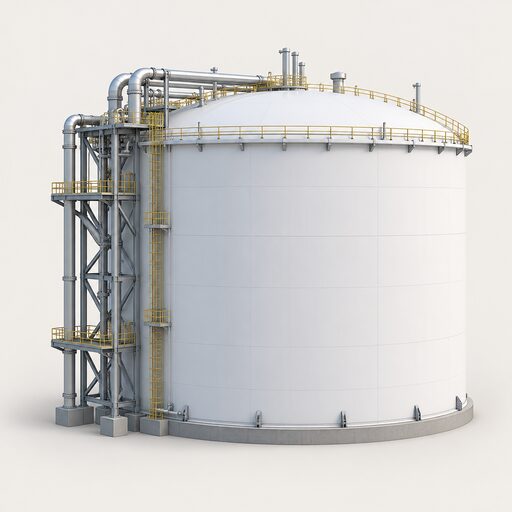 LNG Imports and TerminalsHow much of Britain's gas arrives by ship, where does it come from, and why does a damaged plant in Qatar or a storm of bidding in Asia change what a household pays?
 UK Energy Prices vs EuropeWhy does the UK pay so much for electricity when our gas is cheaper than most of Europe?
 Wholesale Prices and BillsGas prices around the world keep changing, so why do your bills move so slowly, and why does gas still set what you pay for electricity?
 Domestic Energy Prices Over TimeTracks the published domestic gas and electricity unit rates, standing charges and cap levels over time, from the £1,277 cap of early 2022 through the crisis peak to the 2026 quarters.
 Standing ChargesWhy is there a daily charge on a gas or electricity bill even when nothing is used, and what does it actually pay for?
 Unit Rates by RegionWhy do electricity and gas prices differ depending on where you live?