
In this guide
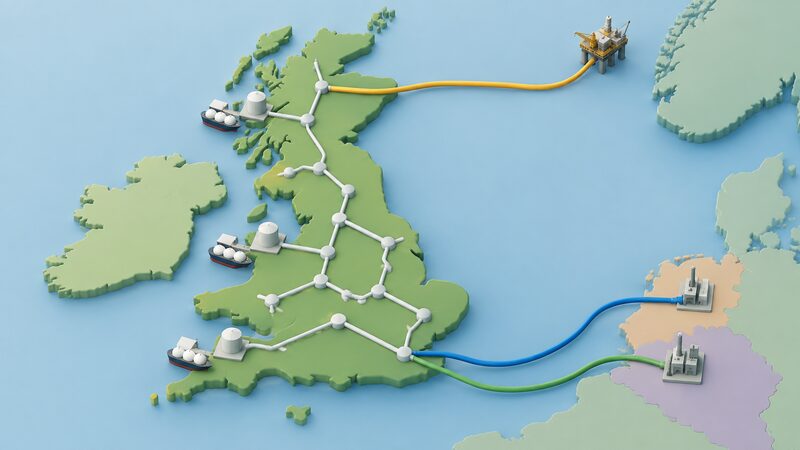
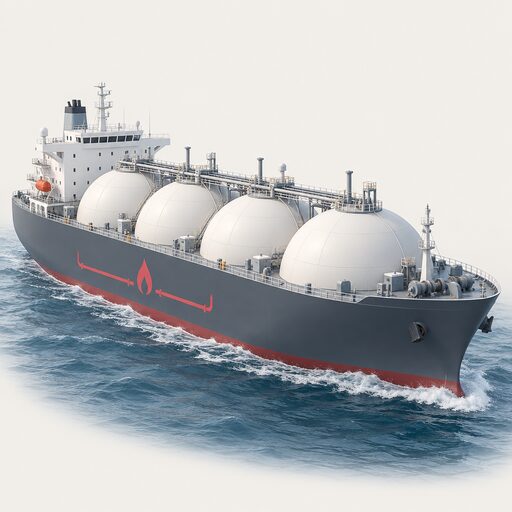
Britain is joined to the European gas market by two sets of pipes. The larger is the subsea route from Norway, which can deliver about 135 million cubic metres a day. The smaller is the pair of interconnector pipelines running under the English Channel to Belgium and the Netherlands, with a combined import capacity of 83 million cubic metres a day. Ships bringing liquefied natural gas add a third route, with terminal capacity of 150 million cubic metres a day1. Those Channel links are the pipes people mean when they say "the interconnectors": they are bi-directional, and in 2012 they were switched from export to import mode2.
On a five-year average the UK Continental Shelf supplied 43 per cent of gross annual gas supply and the Norwegian Continental Shelf 35 per cent. LNG shipments made up 21 per cent, and the Belgian and Dutch interconnectors just 1 per cent, a small share that matters out of all proportion to its size because the pipes play a key role in balancing supply and demand on cold winter days1. The pattern of that trade has reversed once already and can reverse again: the direction of flow follows the price, not the flag.
For a household, the point is blunt. Most heating in the UK is supplied by gas4, around 85 per cent of homes are connected to the gas grid5, and the gas in that grid is sold at the international price wherever it is drilled6. Britain has been a net importer of natural gas since 20047, and by 2027 UK production is set to fall short of what is needed just to heat homes8. A pipe under the Channel is therefore a live input into the unit rate on a gas bill.
The pipes that connect Britain to the continent
Two interconnector pipelines run under the English Channel, linking Great Britain to Belgium and to the Netherlands2. They sit at the end of a domestic network of gas pipelines across Great Britain9, which is designated as Critical National Infrastructure and which also serves 67,000 industrial sites and nearly half a million commercial sites alongside its domestic customers10. Below the national transmission system, four distribution networks carry gas to streets and meters: Cadent Gas, Northern Gas Networks, SGN, and Wales & West Utilities11. Where the pipes in your street come from is covered in gas distribution networks, and the backbone itself in National Gas Transmission.
The Norwegian route is a different thing in scale and in character. It is a long-term, high-volume pipeline supply, and in 2012 the majority of the country's gas came from Norway3. Its capacity, around 135 million cubic metres a day, is roughly 52 million cubic metres a day above the Channel links' 83 million cubic metres a day1. Norwegian gas is not an interconnector in the trading sense: it is a producer supplying a market, not a two-way bridge between two liquid hubs.
That distinction matters when supply is tight. The Norwegian pipes deliver what is contracted and produced. The Channel links deliver, or take away, whatever the price signal calls for on the day. Gas from the North Sea, Norway, the Middle East and North Africa all meets in the same system12, and the household appliance at the end of it cannot tell them apart.
How import and export mode actually work
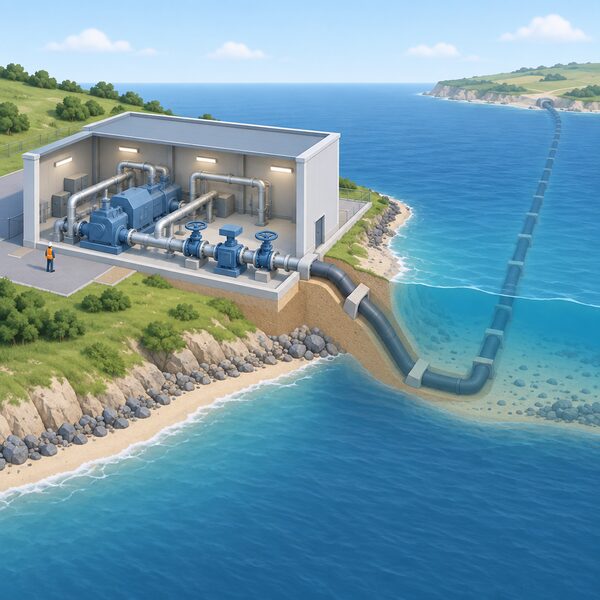
The Channel pipelines are reversible. They can be used to import or export gas as needed3. Compressors at each end determine the direction, and the commercial decision behind them is simple arbitrage: gas moves towards the market paying more. When British production was abundant, the flow was outward. In 2012 the interconnectors were switched from export to import mode, in the same year that Norway became the dominant single source of UK gas3.
Export has not stopped. In 2021 the UK exported £3.4 billion worth of gas13, the same year that UK gas imports rose by 312 per cent compared to the year before. Both directions can be busy in the same twelve months, because the flows respond to season and to price rather than to an annual balance. Summer, when British demand is low and continental storage is filling, tends to pull gas out. A cold, still winter week pulls it back in.
This is why the interconnectors' 1 per cent five-year share of gross annual supply understates their role. The official assessment is explicit that these pipeline imports play a key role in balancing supply and demand on cold winter days1. They are a swing resource: small in the annual average, large in the hour when demand peaks and wind output is low. The same logic, in a different commodity, governs electricity interconnectors, where net imports fell 11 per cent from 33 TWh in 2024 to 30 TWh in 202514.
From exporter to importer: how the balance tipped
In 2000 the country sourced its gas almost entirely from the North Sea15. Since 2004 the UK has been a net importer of natural gas, meaning domestic supplies can no longer meet demand7. By 2013 the country was already getting much of its gas from Norway, Europe, Russia, and LNG imports from places like Qatar7. Russian volumes have since become marginal: LNG shipments now account for 21 per cent of gross annual supply1, with around 15 per cent of the UK's gas arriving as LNG on a separate estimate16.
Estimates of the current import share differ. Imported gas has been put at around 50 per cent of the UK's natural gas supply13, while official Scottish Government material stated that by 2025 the UK was expected to be importing 67 per cent of its gas from outside the UK17. Independent analysis puts the UK as producing about half the gas it consumes, with another third coming by pipeline from Norway and the balance arriving as LNG or via the two interconnector pipelines18. The spread reflects different years, different treatments of exports and different definitions of gross versus net.
| Source | Share of gross annual supply, five-year average | Import capacity |
|---|---|---|
| UK Continental Shelf | 43% | not applicable |
| Norwegian Continental Shelf | 35% | around 135 mcm/d |
| LNG shipments | 21% | 150 mcm/d |
| Belgium and Netherlands interconnectors | 1% | 83 mcm/d |
All figures above are from the 2025 statutory security of supply assessment1.
North Sea decline and the 2027 heating shortfall
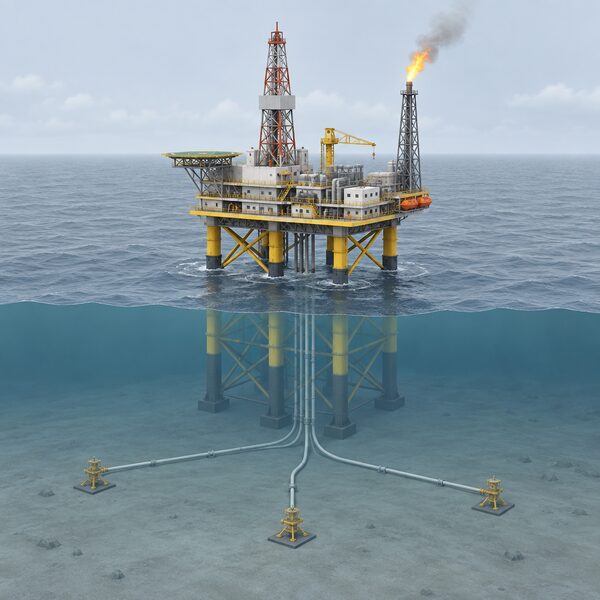
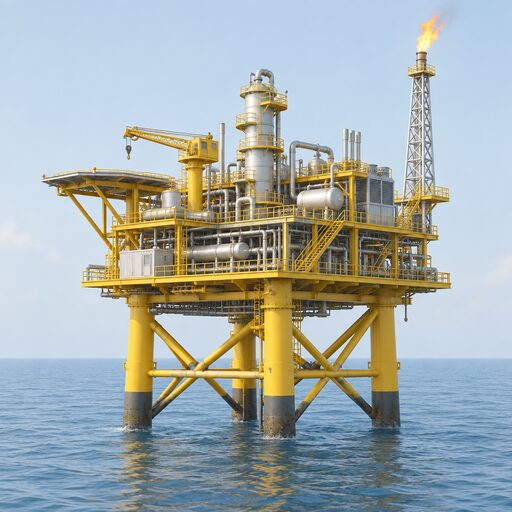
Gas production in the North Sea fell by 74 per cent between 2000 and 2025, while oil output fell by 75 per cent16. The basin is ageing, and import dependence is rising as a direct result6. Forecasts made in 2023 put North Sea production down 55 per cent by 2030 and 75 per cent by 203519.
The date that matters for households is 2027. By then, UK gas production is set to fall short of what is needed just to heat homes8. Put another way, within a few years the UK will no longer be able to meet heating demand from the North Sea20. That threshold is not about total gas demand, which includes 26 per cent for electricity generation and 19 per cent for industry in 2024, and which in that year was at its lowest level since the early 90s9. It is about the narrower question of whether domestic wells alone could keep the radiators warm, and the answer becomes no.
New drilling does not change the price consequence, because UK gas is sold at the international price wherever it is drilled6. The projected trajectory for imports is steep: net imports rising to almost 60 per cent above current levels by 2035, equating to almost 80 per cent of UK demand and four times the level met by UK production, with almost 85 per cent of UK gas demand met by net imports under one scenario, compared to an even split at the time of writing19. The bill consequence has been estimated at up to £30 billion a year for net imports of gas from the early 2030s21. More detail sits on where Britain's gas comes from.
Why gas unit rates move with the pipes
The link between an interconnector flow and a household bill runs through the wholesale market, not the meter. Because the UK is a net importer, it is vulnerable to global price volatility4. When continental demand pulls gas eastwards through the Channel links, the British price follows, and when the continent is well supplied the flow and the price both ease. Analysis of the 2021 to 2022 spike listed the return of global gas demand after pandemic restrictions, high demand from cold weather, supply unable to keep up, regional factors in Europe, low levels of wind, outages at nuclear plants, and a fire that shut down a key electricity interconnector4.
The residue of that period is still in bills. The latest unit prices for gas are around 120 per cent higher than their mid-2021 levels22. For the price cap period 1 July to 30 September 2026, the gas unit rate for a standard variable tariff paid by direct debit in England, Scotland and Wales was 7.33 pence per kilowatt hour including VAT23. Network costs move separately and by smaller amounts: adjustments to gas network costs added 72 pence a month to the average household bill at the August 2025 cap announcement24.
Two structural effects sit behind the headline. UK gas prices are in the lower quartile of the EU range for all domestic consumers and almost all commercial and industrial consumers25, so Britain is not an expensive gas market by European standards. But the ratio of electricity-to-gas prices is still too high for households who switch to heat pumps to see the full benefits of their greater efficiency26, which slows the one move that would break the link between a Channel pipeline and a domestic heating bill. Reduced demand also cuts import exposure: net gas imports in 2024 were 31 per cent higher, at 315 TWh instead of 216 TWh, than they would have been had earlier efficiency policy been retained27. See also how global events move UK energy prices.
"UK gas is sold at the international price wherever it is drilled"
Storage: the thin buffer behind the pipelines
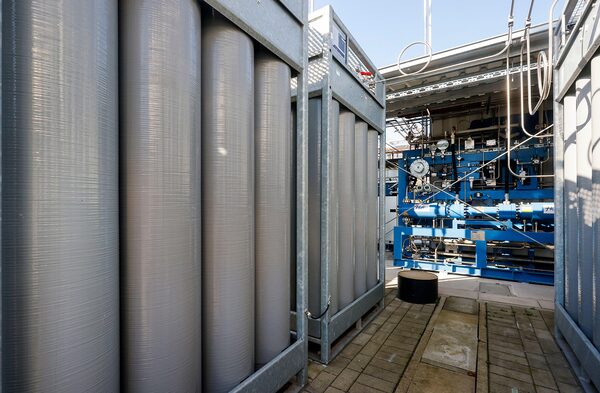
Interconnector flows carry more weight in Britain than elsewhere in Europe partly because there is less cushion behind them. The UK has less gas storage relative to its consumption than any other major European economy7. Available storage has been characterised as about fourteen days' supply15, and the Rough facility, the country's main gas storage site in the North Sea, was at one point set to close28.
The practical effect is that Britain meets a cold snap by drawing harder on pipes and ships rather than by emptying tanks. That works when the Channel links are flowing inward and LNG cargoes are heading for European terminals, and it is exposed when both are competing with continental buyers for the same molecules. Storage is covered in full on UK gas storage and the site itself on Rough; the ship-borne route is set out on LNG imports and UK terminals.
Electricity storage does not substitute. The UK's existing pumped hydropower storage stands at 2.8 GW, the majority contributed by Ffestiniog and Dinorwig29, which is a resource for grid balancing over hours, not for heating a housing stock through a fortnight of frost.
When supply fails: emergency arrangements
Britain has a defined command structure for a loss of gas supply. Any gas network, or the Network Emergency Coordinator, can declare a Gas Supply Emergency30. The Coordinator is described as an independent body responsible for coordinating the actions of all gas networks during a Gas Supply Emergency, focusing on safety and protecting the public30.
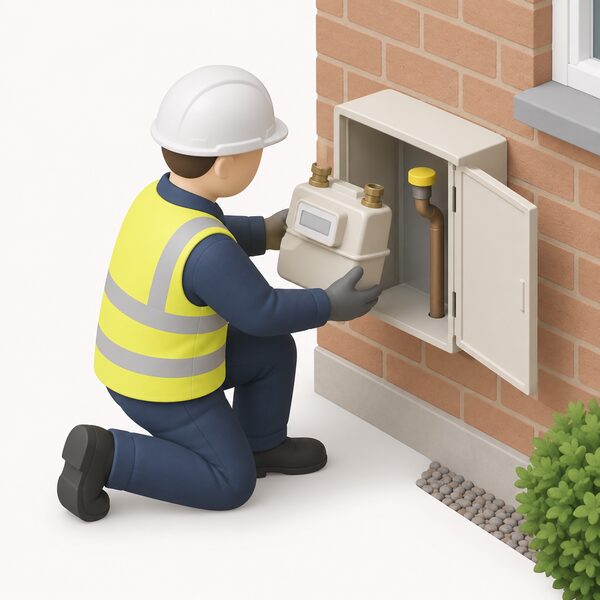
Below that, the distribution networks run continuous cover. Northern Gas Networks provides its region's 24/7 gas emergency service, and although its engineers do not repair appliances or pipework inside the home, their training means they can assess the situation, identify potential hazards and take the right action to make things safe31. The boundary of network responsibility runs up to the Emergency Control Valve, located just before the gas meter32. In a loss of supply incident, engineers visit all affected properties to temporarily turn off gas supplies at the meter, provide an information card or letter, and later visit each property again to restore supply and perform safety checks33.
Fuller detail on warnings, deficit notices and household priority is on gas supply emergencies.
What this means for a household's independence
The honest summary is that a gas-heated home is connected, through four or five links in a chain, to decisions made in Norwegian production planning and in continental European trading. The gas network itself is reliable: it has been described as one of the most reliable pieces of national infrastructure34, and it is designated as Critical National Infrastructure10. Reliability of delivery is not the same as security of supply or stability of price. Government has described the UK as a net energy importer with a high dependence on gas and oil35, and the country has been strongly affected by the energy crisis because of its dependence on natural gas for heating, electricity generation and industry36.
Ownership adds a further layer. Of the significant owners of gas infrastructure operators, just one company is headquartered in the UK37. Decline in gas and oil production in the North Sea continues38, and the sources that replace it are further away and more contested.
What a household can and cannot control is therefore sharply divided:
- Not controllable: the wholesale price, the direction of interconnector flows, Norwegian production, LNG cargo destinations, and network charges recovered through the bill.
- Partly controllable: the volume of gas used, through fabric efficiency and controls, which is the only lever that reduces exposure to every one of the above at once.
- Controllable, with conditions: the decision to move heating off gas entirely, though the electricity-to-gas price ratio currently limits the saving26, and the supply chain in some nations is uneven. In Northern Ireland the low carbon heating supply chain has been assessed as not sufficiently established to cope with demand for installations if demand increases1.
Leaving the network is not a casual step. Where a gas service is disconnected, the meter must be removed by the supplier first32, metal pipes will usually be disconnected unless they supply gas to neighbours, and the pipe is cut as close to the gas main as possible and more than 12 months after meter removal39. There is also a collective cost: gas transporters cannot charge for health and safety disconnections, so according to industry those costs are ultimately passed onto other customers through network charges, leading to higher household bills for those remaining on the network40. Further reading sits on energy security and household independence and the wider picture on UK energy supply.
The network's own future is being pointed at green gases such as biomethane and hydrogen10, and over 80 per cent of the gas distribution network is now made up of polyethylene pipe, which the operators cite as preparation for carrying different gases41. Whether that changes the import picture depends on where the molecules are made. A pipe is a route, not a source.
Sources41 cited
- Statutory Security of Supply Report 2025, GOV.UK, 17 December 2025
- Where does my energy come from?, Uswitch, 3 August 2026
- Gas from Norway, coal from Russia: eight graphs on the UK energy system, Carbon Brief, 2012
- Gas prices and energy bills briefing, House of Commons Library, January 2022
- Navigating the network: improving the consumer journey for low carbon technology, Citizens Advice, 1 July 2026
- More North Sea drilling will not knock a penny off household bills, End Fuel Poverty Coalition, 8 August 2026
- How the global market is pushing up UK gas prices, Carbon Brief, 19 February 2013
- The link between energy bills and fossil fuels, End Fuel Poverty Coalition, 9 September 2025
- Gas networks and the gas grid, House of Commons Library, 17 September 2026
- Why gas networks remain central to the UK's energy security, IGEM, January 2026
- Energy terms explained, Ofgem, 2026
- Heating fuel guide, Uswitch, 27 January 2026
- Supporting energy security, Smart Energy GB, 8 April 2026
- Progress in Reducing Emissions: 2026 Report to Parliament, Climate Change Committee, 2026
- Is the UK's limited gas storage capacity a problem?, Carbon Brief, 25 March 2013
- Factcheck: nine false or misleading myths about North Sea oil and gas, Carbon Brief, 25 March 2026
- Scottish Energy Strategy: the future of energy in Scotland, Scottish Government
- Energy bills: how households could feel the cold this winter, UKERC, 2 November 2023
- Getting off gas, ECIU, 24 April 2023
- Gas and heating oil prices spike as energy risks mount, End Fuel Poverty Coalition, 4 March 2026
- UK homes to be heavily dependent on foreign gas under government plans, ECIU, 2023
- Domestic energy prices briefing, House of Commons Library, 20 September 2026
- Current gas and electricity prices, Centre for Sustainable Energy, 2026
- Energy price cap will rise 2 per cent in October, Ofgem, 27 August 2025
- Consumer bills project, UKERC, 20 September 2026
- Progress in Reducing Emissions: 2025 Report to Parliament, Climate Change Committee, 2025
- Analysis: cutting the green crap has added £22bn to UK energy bills since 2015, Carbon Brief, 2024
- Factcheck: less than 1 per cent of UK gas supplies come from Russia, Carbon Brief, 16 March 2018
- Energy generation in Wales 2021, Welsh Government, October 2022
- Gas supply emergencies, Cadent Gas, 2026
- Take no chances with gas safety, Northern Gas Networks, 14 September 2026
- Getting connected: what to expect, Northern Gas Networks, 4 September 2026
- Gas supply updates, SGN, 2026
- Heatwaves highlight UK's energy infrastructure vulnerability, Energy and Utilities Alliance, 17 August 2026
- Spring Statement 2022, HM Treasury, March 2022
- Climate policy that cuts costs: international policy comparison, Climate Change Committee, 19 September 2026
- Tariff watch, End Fuel Poverty Coalition, 20 September 2026
- Which energy suppliers are British?, Uswitch, 26 June 2026
- Disconnecting from the gas network, IGEM, 20 September 2026
- Exercising Consumer Choice: a review of the gas disconnections framework, Ofgem, 13 January 2025
- Ensuring a safe hydrogen gas network, SGN, 2026
 The Full Where Our Energy Comes From GuideWhere does the gas in your boiler and the electricity in your sockets actually come from?
 Electricity InterconnectorsWhere does Britain's electricity come from when the wind drops, and how much do we buy from abroad?
 Where Britain's Gas Comes FromWhere does the gas in British homes actually come from, and how much of it is ours?
 The Full Energy Suppliers GuideWho the UK's domestic gas and electricity suppliers are, how the market is structured across Great Britain and Northern Ireland, what a supplier is licensed and obliged to do, how the price cap limits bills, what happens when a supplier fails, and who regulates it all.
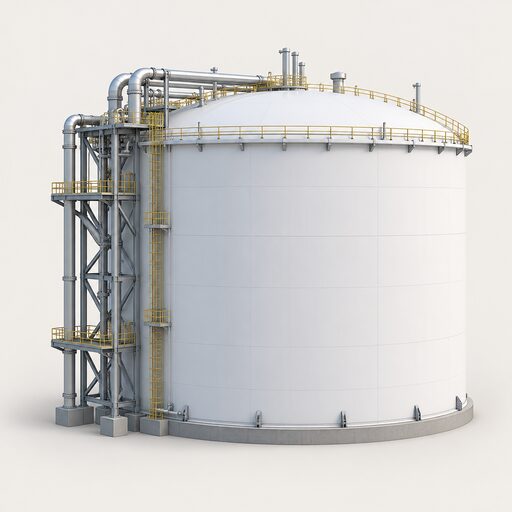 LNG Imports and TerminalsHow much of Britain's gas arrives by ship, where does it come from, and why does a damaged plant in Qatar or a storm of bidding in Asia change what a household pays?
 Gas Distribution NetworksWho actually owns the pipes under your street, and who do you call when gas smells or the supply fails?