
In this guide
Britain's electricity system runs at 50Hz, and holding it there is a continuous operational job rather than a fixed property of the network. Frequency is the balance between supply and demand which needs to be maintained at 50 hertz1. Every time a generator trips, a large load switches on, or the wind drops across a whole region, that balance shifts and the system operator has to correct it within seconds.
The correction is bought through a set of balancing services. The fastest of these, Dynamic Containment, is designed to arrest a deviation almost immediately. Slower products, including Firm Frequency Response, cover the minutes that follow. Behind all of them sits the balancing mechanism, which matches individual trades against real-time system need. One independent trial recorded an availability price of £17/MW/h for Dynamic Containment, with a utilisation percentage of 0.55%, meaning the service was held ready constantly but called on very rarely2.
For a household, the practical question is whether any of this touches the home. It does, in two ways. Balancing costs are recovered through the network and operating elements of the unit rate and standing charge, so they appear on every bill without a separate line3. And household assets, chiefly batteries and electric vehicle chargers, can now earn from these markets through an aggregator, because the services are procured in blocks far larger than a single home can supply.
Why the grid must hold 50Hz, and what puts it off balance
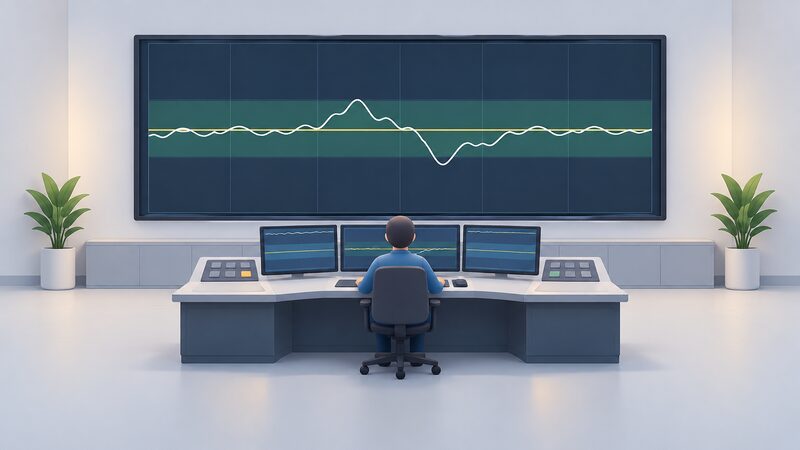
Frequency is not a setting that can be fixed once. It is the visible result of generation and demand matching at every instant, and the system operator's job is to keep that match close enough that equipment designed for 50Hz continues to work. Ofgem's original description of the problem is blunt: frequency is the balance between supply and demand which needs to be maintained at 50 hertz1.
What pushes it off balance is any sudden mismatch. A large generating unit disconnecting removes supply instantly. A cold snap that brings on heating load across a region adds demand faster than generation can follow. On a system with more inverter-connected generation, such as wind and solar farms, the physical inertia that used to slow these changes is lower, so deviations develop faster and the response window shrinks. That is the reason the fastest response products exist at all.
The consequences of a large deviation are not gradual. Protection equipment is set to disconnect plant before damage occurs, and those settings are published. One independent filing records under-frequency protection operating at 48Hz with a 0.5 second delay5. The same document describes a solid state switching device reducing output voltage to below 50V within 0.5 seconds when it fails to disconnect a micro-generator5. Both are examples of the same principle: equipment protects itself, and if enough of it does so at once, the mismatch grows rather than shrinks.
For a household, this is the part of the system that cannot be replicated at home. A battery can shift when energy is bought and used, and can earn from providing response, but it cannot hold the national frequency. That remains a system operator function, and it depends on a portfolio of providers large enough to move together.
Frequency response: the answer in seconds, not minutes
Frequency response is the family of services that correct a deviation as it happens, rather than after it has settled. The distinction from reserve is one of timescale: response acts within seconds, reserve within minutes. That difference determines what kind of asset can provide each, and what it is paid.
The products are defined by how they deliver. Dynamic response varies its output in proportion to the size of the frequency deviation, so a small deviation draws a small correction. Static response delivers a fixed block of power once triggered, regardless of how far frequency has moved. Both are procured ahead of time and held available.
| Product type | How output is set | When it acts |
|---|---|---|
| Dynamic response | In proportion to the size of the deviation | Within seconds of a deviation starting |
| Static response | A fixed block of power once triggered | Within seconds of a deviation starting |
| Reserve | Scheduled delivery | Within minutes |
Delivery speed is the defining characteristic across the technologies involved. Pumped storage, for example, is described in official guidance as able to deliver very quickly, which is why it has historically been the backbone of response6. Batteries match or exceed that speed without the geographical constraints of a reservoir, which is why they have moved into the response markets so quickly.
The procurement itself is organised as a market. Firm Frequency Response is the monthly tendered market used by National Grid ESO to commercially procure frequency response services7. That monthly cycle means providers bid for a defined capability over a defined period, and the system operator accepts the volume it needs at the prices offered.
For a household, the relevant point is that response is bought as a capability, not as energy. A battery providing response is not primarily selling kilowatt hours; it is selling the promise that it will move its output in a particular way within a particular time. That is a different product from the electricity a home consumes, and it is priced differently.
Dynamic Containment: the fastest service, and what it costs to hold in reserve
Dynamic Containment is the fastest category in the response family, designed to arrest a frequency deviation in the first seconds after it begins. It is procured as capacity held ready, and providers are paid for holding it whether or not it is used.
The economics of that arrangement are visible in one independent trial, which recorded an availability price of £17/MW/h for Dynamic Containment and a utilisation percentage of 0.55%2. Read together, those two figures describe the product precisely: a provider is paid a standing fee for the capability, and the capability is called on for a very small fraction of the time it is held. The revenue comes from availability, not from delivery.
That structure has a direct consequence for what kind of asset can supply it. A unit held in reserve cannot simultaneously be charging, discharging for arbitrage, or supporting a household's own consumption. The availability payment exists to compensate for that opportunity cost, and a provider weighing up whether to offer capacity has to compare the availability fee against whatever else the asset could be doing in the same hours.
The trial also modelled what a large fleet of small assets would need to look like to replace conventional response. Assuming that National Grid ESO had a dynamic response requirement of 650MW, it would take 780,000 charge points to fulfil it7. That figure is the clearest available illustration of the scale mismatch between individual household assets and system need, and it explains why aggregation rather than direct participation is the route open to homes.
Firm Frequency Response: how often events happen and how long they last
Firm Frequency Response sits behind the fastest products in the response stack. It is the monthly tendered market used by National Grid ESO to commercially procure frequency response services, which means the volumes and prices are set in a recurring auction rather than continuously7.
The monthly cycle matters for anyone trying to understand how often response is actually delivered. Because the service is procured in advance and held available, the frequency of delivery is a separate question from the frequency of payment. A provider receives its availability fee for the whole contracted period, and the number of times the service is called on within that period is a much smaller number. The 0.55% utilisation recorded for Dynamic Containment in one trial is the clearest published indication of how rarely the fastest service is triggered2.
The system operator publishes what was actually instructed. Market report publications covering frequency response volumes instructed in August 2026, September 2026, October 2026, November 2026 and December 2026 are scheduled through to 14 January 2027, which gives a rolling public record of how much response was used in each month. That is the authoritative source for event frequency, and it is published after the fact rather than forecast.
For a household considering whether to let a battery be used for response, the practical implication is that the asset will spend almost all of its time doing nothing for the system. The value comes from being available, not from being busy. That is a comfortable arrangement for a battery that would otherwise be idle, and an awkward one for an asset that needs to cycle regularly to earn its keep.
Who provides response: batteries, aggregators and the 1MW bid
Response is not bought from individual homes. It is bought in blocks, and the block size is the barrier that shapes the whole market. Government statistics record that domestic consumers, smaller non-domestic consumers and electric vehicle charging collectively contributed 0.6GW of flexibility in 20244. That is a substantial aggregate, but it is made up of hundreds of thousands of small assets that only become useful to the system operator once something pools them.
The pooling is done by aggregators, which contract with many households and bid the combined capacity into the response markets as a single unit. The minimum bid size is the reason this structure exists: a single domestic battery is orders of magnitude too small to bid directly, and no amount of clever control changes that.
The asset base is growing. Government statistics on MCS domestic battery installations use capacity bands chosen to cover distinct groupings in the data, covering batteries approximately smaller than 6kWh, approximately larger than 11kWh, and a grouping in between8. That banding reflects a market where domestic batteries cluster into recognisable sizes rather than spreading evenly.
Electric vehicle charging adds a second pool. Of publicly available charging devices in the UK at 1 July 2025, those rated 8kW to 49kW represented 26% of charging devices, devices rated 50kW to 149kW represented 10%, and the highest power rating banding, 150kW and above, accounted for 11%9. The larger bands are the ones with the technical capability to respond quickly, though the great majority of domestic charging happens at far lower power.
Larger sites are registered publicly. Generation and demand-side response projects above 50kW holding connection agreements are listed in distribution network operators' Embedded Capacity Registers10. That threshold is well above a single home but well below a grid-scale battery, and it marks the point at which a site becomes visible to the network as a controllable asset.
What household flexibility is worth on a grid built for balancing
The value of household flexibility to the grid is real but indirect, and it is worth being precise about what a home can and cannot do for system balancing.
What a home can do is shift when it draws power and, with a battery, when it exports. That makes it useful for the slower end of balancing and for the reserve and demand-side services that sit alongside frequency response. The 0.6GW contributed by domestic consumers, smaller non-domestic consumers and electric vehicle charging in 2024 is the measure of how much of this is already happening4.
What a home cannot do is hold frequency on its own. The response requirement modelled in one trial, 650MW of dynamic response, would take 780,000 charge points to fulfil7. That number is not a criticism of household assets; it is a statement about the ratio between one home and one system. Aggregation is what converts a large number of small assets into something the system operator can dispatch.
There is a further limit that has nothing to do with scale. A battery providing response has to be available when the system needs it, which means it is not available for the household's own purposes at that moment. The availability payment is the compensation for that, and the 0.55% utilisation figure recorded in one trial suggests the conflict is rare in practice2. But it is a real transfer of control, and it is the point at which a household asset stops being purely a household asset.
The dependence that remains is straightforward. A home with a battery and an aggregator contract is still connected to the grid, still supplied by a licensed supplier, and still subject to the system operator's decisions about when its asset is called. What it gains is a share of the revenue from a service the grid needs, and what it gives up is a degree of control over when its battery is used.
Balancing services and your bill: where the costs land

Balancing costs reach a household through the bill rather than as a separate charge. Ofgem lists the components used to calculate bills as VAT at 5%, wholesale costs, network costs, operating, debt and industry costs, EBIT and policy costs, along with the type of energy used, the type of meter installed and how the bill is paid3. Balancing services sit inside the network and operating elements of that list.
The scale of the bill itself varies by region and by meter arrangement, which is why the same service can cost different amounts in different parts of the country. Under the default tariff cap for 1 April 2024 to 30 June 2024, the annual figure for a single-rate meter at the third consumption band was £914.17 in the Northern region and £883.07 in the North West11. The cap at nil consumption, which is the standing charge element, was £199.53 for a multi-register meter in the South East and £177.93 for a single-rate meter in the North West over the same period11.
| Benchmark | Figure | Region and meter |
|---|---|---|
| Default tariff cap, 1 April to 30 June 2024, third consumption band | £914.17 a year | Northern, single-rate11 |
| Default tariff cap, 1 April to 30 June 2024, third consumption band | £883.07 a year | North West, single-rate11 |
| Default tariff cap, 1 April to 30 June 2024, third consumption band | £895.98 a year | Eastern, single-rate11 |
| Default tariff cap, 1 April to 30 June 2024, nil consumption | £199.53 | South East, multi-register11 |
| Default tariff cap, 1 April to 30 June 2024, nil consumption | £177.93 | North West, single-rate11 |
| Benchmark maximum charge, electricity at 3,100kWh | £977.30 a year | North West, single-rate12 |
| Benchmark maximum charge, gas at 12,000kWh, other payment method | £813.93 a year | Northern Scotland12 |
Where the costs of a support scheme land is a live policy question. In a consultation on a debt relief scheme, Ofgem set out that these would fall on the unit rate for gas and the standing charge for electricity, which it recognised as a particular allocation choice13. The same document notes that consultation responses may be shared with the Department for Energy Security and Net Zero14. That is the mechanism by which a system-level cost becomes a line in a household's unit rate.
Where the household sits in a system built for balancing
The balancing system is designed around blocks of capacity measured in megawatts, and a home is not a block. That single fact explains almost everything about how households relate to frequency response: they participate through aggregators or not at all, they are paid for availability rather than delivery, and the asset they contribute is unavailable for their own use whenever the system calls on it.
The independence a household gains from this is partial and specific. A battery plus an aggregator contract turns a passive asset into an earning one, and it does so without any change to the connection, the supplier or the meter. What it does not do is reduce dependence on the grid, the supplier or the system operator. The home remains a small participant in a national service, and the terms on which it participates are set by the market rules rather than by the household.
The costs run the other way as well. Balancing services are recovered through the network and operating elements of the unit rate and standing charge, so every household pays towards the system that keeps frequency at 50Hz, whether or not it owns anything that can provide response3. That is the trade at the centre of the subject: the same system that a battery can earn from is the system every bill already funds.
Sources14 cited
- Demand Side Response in the Domestic Sector, Ofgem, 2010
- Project Sciurus Trial Insights Report, Cenex, 2021
- How your electricity or gas bill is calculated, Ofgem, 2026
- Statutory Security of Supply Report 2025, Department for Energy Security and Net Zero, 2025
- Technical Test Report, Energy Networks Association, 2026
- How does storage help us balance the grid, NESO, 2026
- V2G Britain, Cenex, 2021
- MCS domestic retrofit battery installations 2025 to 2026, Department for Energy Security and Net Zero, 2026
- Electric vehicle public charging infrastructure statistics July 2025, Department for Transport, 2025
- UK Solar Roadmap, Department for Energy Security and Net Zero, 2025
- Default tariff cap level 1 April 2024 to 30 June 2024, Ofgem, 2024
- Benchmark Maximum Charges for the Charge Restriction Period 13a, Ofgem, 2025
- Resetting the energy debt landscape, Ofgem, 2024
- Review of additional wholesale costs in the default tariff cap, Ofgem, 2023
 Grid Inertia and StabilityAs more wind and solar replace coal, gas and nuclear, what keeps the lights on when the grid loses its steadying effect?
 Backup Power and EPSWill your lights stay on when the power goes out?
 Demand Flexibility and the GridGetting paid to shift your electricity use away from peak times is now a real option for households with a smart meter.
 Electricity Margin ShortagesWill the lights stay on this winter, and what would have to happen before homes lose power?
 Batteries and Smart TariffsA home battery can earn its keep if your electricity prices change through the day.
 Backup Power and IndependenceA power cut leaves most homes completely dark, so how much backup do you actually need to keep the lights on?